Clinical Ophthalmology 2018:12 2553–2561
Clinical Ophthalmology
Dove
press
submit your manuscript | www.dovepress.com 2553
R e v i e w
open access to scientific and medical research
Open Access Full Text Article
visual function, digital behavior and the vision
performance index
Sarah Farukhi Ahmed1
Kyle C McDermott2
wesley K Burge2
i ike K Ahmed3,4
Devesh K varma3
Y Joyce Liao5
Alan S Crandall4
S Khizer R Khaderi2,6
1Shiley eye institute of Ophthalmology, University of California, San Diego, CA, USA; 2vizzario, inc., venice, CA, USA; 3Ophthalmology and vision Sciences, University of Toronto, Toronto, ON, Canada; 4Ophthalmology and visual Sciences, University of Utah School of Medicine, Salt Lake City, UT, USA; 5Ophthalmology and Neurology, Stanford University Medical Center, Stanford, CA, USA; 6Ophthalmology, Stanford University Medical Center, Stanford, CA, USA
Abstract: Historically, visual acuity has been the benchmark for visual function. It is used to measure therapeutic outcomes for vision-related services, products and interventions. Quantitative measurement of suboptimal visual acuity can potentially be corrected optically with proper refraction in some cases, but in many cases of reduced vision there is something else more serious that can potentially impact other aspects of visual function such as contrast sensitivity, color discrimination, peripheral field of view and higher-order visual processing. The measurement of visual acuity typically requires stimuli subject to some degree of stan-dardization or calibration and has thus often been limited to clinical settings. However, we are spending increasing amounts of time interacting with devices that present high-resolution, full color images and video (hereafter, digital media) and can record our responses. Most of these devices can be used to measure visual acuity and other aspects of visual function, not just with targeted testing experiences but from typical device interactions. There is growing evidence that prolonged exposure to digital media can lead to various vision-related issues (eg, computer vision syndrome, dry eye, etc.). Our regular, daily interactions (digital behavior) can also be used to assess our visual function, passively and continuously. This allows us to expand vision health assessment beyond the clinic, to collect vision-related data in the whole range of settings for typical digital behavior from practically any population(s) of interest and to further explore just how our increasingly virtual interactions are affecting our vision. We present a tool that can be easily integrated into digital media to provide insights into our digital behavior.
Keywords: vision education, visual acuity, vision assessment, technology, video games, mobile gaming, software applications, mobile applications
Measuring visual acuity: past and present
Visual acuity serves as the backbone by which ocular function is measured. As prac-ticed in clinical ophthalmology, visual acuity is the subjective measurement obtained by an individual reading the smallest recognizable optotype from a standardized list (ie, Early Treatment in Diabetic Retinopathy Study [ETDRS], Snellen; Figure 1). The test yields information regarding not only a patient’s ocular health but also his or her neurological health in regard to intracranial visual pathways and processing.1 A patient’s ability to perform the test successfully requires a certain degree of mental capacity and compliance. This is perhaps the greatest drawback of current methods of vision testing. Ideally, vision assessment should be objective, reproducible and exact without dependence on patient compliance.2
The Snellen chart, developed by Dr Hermann Snellen in 1862, is among the most common forms of visual acuity testing (Figure 1A). The chart essentially measures spatial patterns or angular acuity. Each line on the chart is sized dif-ferently and yields data regarding the smallest angular measurement able to be
Correspondence: S Khizer R Khaderi vizzario inc., 724 Lincoln Boulevard Suite A, venice, CA 90291, USA
Tel +1 424 258 0701 email [email protected]
Journal name: Clinical Ophthalmology Article Designation: Review Year: 2018
Volume: 12
Running head verso: Ahmed et al
Running head recto: Visual function, digital behavior and the vision performance index DOI: 187131
Clinical Ophthalmology downloaded from https://www.dovepress.com/ by 118.70.13.36 on 20-Aug-2020
For personal use only.
Dovepress
Ahmed et al
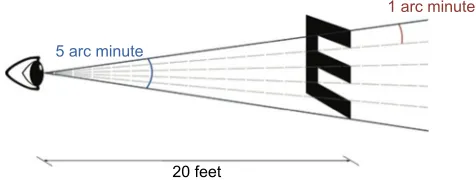
visualized by the individual at a standardized distance. For example, at 6 m (or 20 feet) away from the chart, the 20/20 line is composed of letters that subtend 5 minutes of arc (Figure 2). Each part of the letter subtends 1 minute of arc. At the same distance, the 20/200 line letters subtend 50 minutes of arc.2
The disadvantages of this method are multiple, much of which have to do with the line-to-line inconsistencies.2,4 First, each line contains a different number of letters. While the 20/200 line contains 1–3 letters, the 20/20 line contains 8 letters. Because of this difference, the scoring system of the chart is highly inconsistent. A patient may miss one letter on the 20/20 line (or 20/20-) in which he or she has read 7/8 letters correctly. Whereas if the patient has scored 20/200-, he or she has read only 2/3 letters correctly. Furthermore, the difference between the size of the letters of each line and the space between each line does not follow standardized progression pattern. This potentially overestimates vision, especially in the lower spectrum of visual acuities. For this reason, statistical analysis of Snellen visual acuity is very difficult for research studies.2
In addition, the chart does not address other aspects involved in vision such as pattern recognition or contrast sensitivity, especially in patients with poor visual acuity. For example, mistaking the letters “G” and “C” is given the
same score as mistaking the letter “A” for “C”. In the first scenario, the letters “G” and “C” have similar patterns.9 Yet, the patient is given no credit for this recognition.
Ideally, a vision score should be consistent and repro-ducible. This is key to allow for detection of subtle changes in vision. The test–retest variability (TRV) is a measure of the variance of a single test carried out under the same conditions.10 The higher the TRV, the lower the ability to detect a true change in visual patterns. Snellen TRV is very high, ranging from 5 to 16.5 letters in normal patients and up to 3.5 lines variation in patients with visual pathology such as cataracts or macular degeneration.11 Clinically, the same patient could be 20/20 in one sitting and 20/50 in another on the same day under the same conditions, without any real change in vision. While the clinical repercussions of such large variations are problematic, the lack of reproducibility makes this test almost impossible to utilize for vision testing in research studies.
In order to overcome the deficiencies in the Snellen chart, in 1982, a new chart was developed for the ETDRS called the ETDRS chart (Figure 1B).12 This chart was designed such that each line has an equal number of letters per line with equal spacing between letters and rows (0.1 log units). Between rows, the size of the letters increases with a logarithmic progression. So, a change in vision can be calculated as an overall percent change, no matter in which line on the chart the change occurs.13 These factors have led to the ETDRS chart’s increased accuracy and reduced TRV. The TRV of the ETDRS chart is about 3.5 letters for patients with normal acuity and 10 letters for patients with ocular disease.14
Nonetheless, despite its apparent benefits, the ETDRS has not completely replaced the Snellen chart in the clinical setting. Resurgence of interest and use of the mobile version of Snellen chart can be seen in more recent literature. Results of these studies demonstrate a large discrepancy between clinical Snellen measurements and mobile measurements,
%
$
Figure 1 examples of standardized eye charts.
Notes: (A) Snellen test for acuity.3 Reproduced from Dahl J. A typical Snellen chart. Available from: https://commons.wikimedia.org/wiki/File:Snellen_chart.svg. Creative Commons license and disclaimer available from: http://creativecommons.org/licenses/by/4.0/legalcode.38 (B) LogMAR test for acuity.4 Reprinted from Vision Res, 90, Bailey iL, Lovie-Kitchin Je, visual acuity testing. From the laboratory to the clinic. 2–9, Copyright (2013), with permission from elsevier.37
DUFPLQXWH
DUFPLQXWH
IHHW
Figure 2 Illustration of a typical block letter E where each of five vertical segments
subtends 1 minute of arc (totaling 5).
Note: Note that the angles are not drawn to scale.
Clinical Ophthalmology downloaded from https://www.dovepress.com/ by 118.70.13.36 on 20-Aug-2020
Dovepress visual function, digital behavior and the vision performance index
in addition to the baseline inconsistencies within the Snellen chart itself.15,16
Though the Snellen chart is far from ideal, the ETDRS chart is considered impractical for daily use.13 ETDRS-based testing takes longer to perform, often leading to increased patient and examiner fatigue. The chart is calibrated for a 4 m lane, whereas most ophthalmology offices are designed based on the Snellen 6 m lane layout.13 Factors such as patient fatigue and ophthalmology office design cause confounding variables that are difficult to control, thereby reducing the accuracy of the overall test.
In short, the current standards of measuring visual behav-ior are wrought with inconsistencies and impracticalities. The purpose of our research was to develop a means of vision assessment through the use of widely adapted digital technology, which will increase not only the accuracy of visual acuity assessment but also the logistical ease of per-forming the test.
Growing trends in digital behavior
We live in an era of digital technology. On average, an American adult spends between 2 and 12 hours on a desk-top, phone or laptop a day.17,18 Studies have shown that even preschoolers are spending on average 2.4 hours a day with screens.19 Changing technology has led to the development of small handheld devices (eg, smart phones, tablets, wrist watch displays, etc.), which not only increase daily screen time further but also impact viewing demands as these smaller devices require smaller fonts/images and closer viewing distances.20
Not surprisingly, there has also been a parallel increase in visual and ophthalmic problems associated with increased screen time use. One of the most prevalent is a collection of vision problems termed computer vision syndrome (CVS). CVS, also known as digital eye strain, encompasses many types of vision issues related to increased screen time, including dry eyes, ocular discomfort and diplopia.21 There is a positive relationship between symptom severity and the duration of exposure to computers. Symptoms may appear after $2 hours of computer screen use.21 CVS is also incred-ibly common – approximately 40%–90% of adults and 80% of adolescents experience symptoms of CVS during or after screen time.22,23 Furthermore, in a recent study of school-aged children in South Korea, 7% of the sample had been diagnosed with dry eye disease, and increased screen time use was shown to be a risk factor for developing dry eye disease.24,25
Another visual problem caused by increased screen use is related to wearable screens (eg, virtual reality glasses,
head-mounted virtual reality devices, etc.). These types of screens can induce virtual reality sickness or cybersickness. Cybersickness is distinct from other motion sicknesses as no real motion needs to occur, only the perception of self motion. Cybersickness symptoms include nausea, head-aches, disorientation, fatigue and eye strain.26 As wearable screens become more ubiquitous (ie, you can stick your smartphone in a head mount), cybersickness may become more prevalent.
Visual damage may also occur due to extended screen time. For example, continuous light exposure can damage the retina.27–30 In children, extended exposure to screens can decrease the caliber of retinal arterioles.31 The retina is most sensitive to insult from blue light.32–35 This is especially problematic with modern technology as light-emitting diodes (LEDs) have become the primary light source for screens and home lighting, and these light sources have high luminance with a significant blue-light component of their spectra. However, the long-term consequences of LED exposure on vision function and health is currently unknown.
Furthermore, extended exposure to blue light (especially in the evening and night) can suppress melatonin and nega-tively alter sleep patterns, leading to insufficient and poor sleep quality and other health-related disorders.36 Some com-panies have developed applications (apps) in an attempt to manage these potential visual problems. For example, there are apps and programs that can automatically filter blue light after a certain time every day (usually dusk) to reduce blue-light exposure and alleviate potential sleep problems. Both Apple and Samsung now include some form of blue-light filter (Samsung – Blue Light Filter, Apple – Night Shift) in the operating systems for their flagship phones. There are also apps that can set a screen time limit on a device, where the user (or child) is automatically locked out of use after the time limit.
Despite the growing effort by technology companies, there is a lack of research on lighting and displays used in everyday life and their effects on visual function and acuity. Some of us are already spending up to 12+ hours a day in front of some form of screen, and this exposure is starting at younger and younger ages. As digital technology becomes increasingly omnipresent in every aspect of our social and economic lives, screen time usage and its associated visual demands will only continue to increase. Further research to understand the effects of digital technology on vision across all ages is crucial. Screen display optimization and standardized measurement tools to detect deterioration of visual performance are important to set guidelines for tech-nology usage. The goal of our research is not only to identify
Clinical Ophthalmology downloaded from https://www.dovepress.com/ by 118.70.13.36 on 20-Aug-2020
Dovepress
Ahmed et al
problems with prolonged technology usage but also to gather information regarding vision health (such as visual acuity and contrast sensitivity) from these devices.
Opportunities for new benchmarks
The missing tool
Our growing time spent engaged in digital behavior elicits the following question, as well as the potential to answer it: What effect is our increasing interaction with artificial displays having on our vision? To address this and related questions, we require a tool
1. to measure, analyze and monitor vision performance during digital behavior interactions;
2. to record the necessary data about these interactions with-out altering the interactions or the overall experience; 3. to be easily and quickly integrated into any experience
where users respond to visual stimuli and
4. to present an evaluation of vision performance that is concise and easy to understand while being comprehen-sive enough to provide specific guidance.
The devices with which we engage in these digital behaviors already have the capability to display stimuli and record responses – we just need to put that information to use. In order to encourage as many developers as possible to integrate such a tool into the widest possible diversity of experiences, the tool needs to be minimally invasive and easy to use. The application developer should not be required to handle storage, processing or interpretation of the data; they should simply be asked to pass data along and be ready to receive the resulting evaluation. This evaluation should be concise enough that both the developer and the user can understand the information, but at the same time, it should include enough specificity so that targeted guidance may be offered. For example, a developer may want to provide information about vision issues dependent upon specific aspects where a user’s performance was poor. Alternatively, a user may be encouraged to engage in tasks specifically aimed at improving certain aspects of their performance, and the application could additionally monitor the progress of such training.
A developer, whether on his or her own or at the behest of a vision care provider, could create an experience similar to that of the previously discussed clinical measures of visual acuity. This application could use the tool to analyze the data and provide comprehensive feedback without requiring any specific expertise in vision from the developer. More importantly, the application experience can be anything: as faithful a recreation of a classic Snellen chart as possible for
the display used, an enhanced test aimed at overcoming some of the many shortcomings discussed earlier or something completely novel and experimental; the tool should be gen-eral enough to accommodate any of these. It is important to note, however, that this generalizability means the evaluation from the tool may not be able to provide just any arbitrary, specific measure.
vision performance index (vPi)
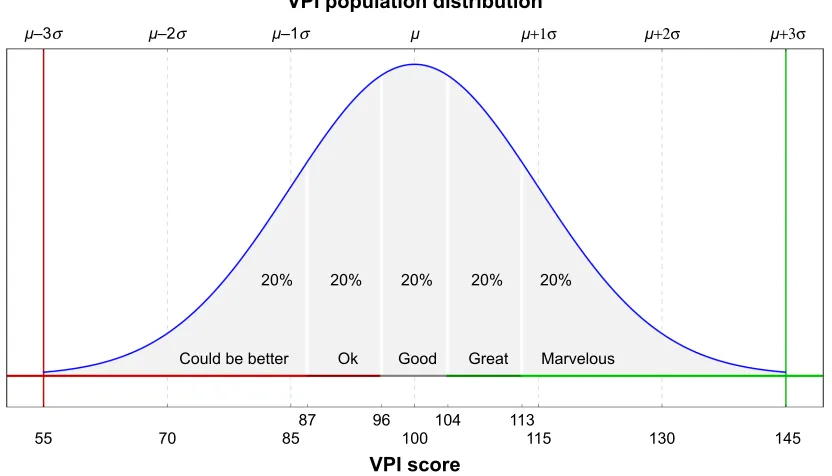
The VPI was developed to be such a tool. Using data from an application about the appearance of stimuli and the resulting user responses, over 100 individual metrics are estimated that are ultimately summarized into one VPI score (depending on the task and the information provided by the developer). Modeled after the familiar intelligence quotient (IQ), the VPI score has an expected distribution among normal users with a mean of 100 and an SD of 15; the higher the score, the better the vision performance (Figure 3). It is possible to present qualitative labels based on the VPI score value. For example, as shown in the figure, the expected distribution can be divided into equal area quintiles and each assigned names such as “could be better”, “Ok”, “good”, “great” and “marvelous”, going from the lowest to highest quintile.
A user’s VPI comes with five component scores: field of view, accuracy, multi-tracking, endurance and detec-tion (FAMED; Figure 4). These components cover specific aspects of vision performance relating to F) relatively central or peripheral stimuli, A) response time and accurate posi-tioning of responses, M) performing tasks with relatively few or many stimuli to process at once, E) maintaining performance over time and recovery of performance after rest and D) thresholds for detecting or discriminating stimuli based on color, contrast or size. The FAMED breakdown of VPI allows for the specific guidance of intervention or train-ing, while the overall VPI score is the most minimal, useful presentation for the evaluation of vision performance.
It is not necessary for an application experience to provide data sufficient to estimate values for all of the components of VPI. For example, an experience approximating a standard acuity test may record correct or incorrect responses to pre-sented letters, as well as their sizes. This relatively short list of variables could be used to estimate a reaction subcomponent score (derived, among other things, from the user’s time to respond from stimulus onset), which would then feed into an accuracy component score, as well as an acuity subcomponent score (derived, among other things, from variations in response characteristics dependent upon the size differences among presented stimuli), which would then feed into a detection
Clinical Ophthalmology downloaded from https://www.dovepress.com/ by 118.70.13.36 on 20-Aug-2020
Dovepress visual function, digital behavior and the vision performance index
±σ ±σ ±σ +1σ +2σ +3σ
&RXOGEHEHWWHU
2N *RRG *UHDW 0DUYHORXV
93,VFRUH
93,SRSXODWLRQGLVWULEXWLRQ
Figure 3 Distribution of vPi scores among a population, modeled as a normal distribution with a mean of 100 and an SD of 15.
Note: Shaded areas show regions with an equal area of 20%: scores less than 87 (bottom 20%) are considered as abnormally low, while scores greater than 113 (top 20%)
are considered as abnormally high.
Abbreviation: vPi, vision performance index.
3HULSKHUDO
2YHUDOO93,
)LHOGRIYLHZ $FFXUDF\ 0XOWLWUDFNLQJ (QGXUDQFH 'HWHFWLRQ
&HQWUDO 5HDFWLRQ 7DUJHWLQJ )RFXVHG 'LYLGHG )DWLJXH 5HFRYHU\ &RORU &RQWUDVW $FXLW\
Figure 4 The five components of the VPI: FAMED and their subcomponents.
Note: each individual component is scored, providing additional detail on top of the main, or overall, vPi score. Abbreviations: VPI, vision performance index; FAMED, field of view, accuracy, multi-tracking, endurance and detection. component score. All the components and subcomponents
of VPI are independently normalized to have the same IQ-inspired 100±15 distribution (Figure 3). A different application might only generate color- and field of view-related scores. Repeated interaction with any experience over time is all that would be needed to generate an endurance score.
The Vizzario software development kit (SDK) provides simple functions allowing developers to log details about the appearance of stimuli and resulting user responses and ultimately to request an evaluation of those interactions. While nothing about the user experience needs to change in order to collect and evaluate these data, developers are free to incorporate the evaluation into the experience to share the results with the user or other parties (given the explicit consent of the user). The SDK, as well as the analytics per-formed on the data passed through it, is designed to be as
general as possible to facilitate integration into most kinds of applications that engage users in any manner of interaction. Careful segmentation and normalization of data allow for comparison, correlation and even statistical analysis of VPI scores from different tasks, device configurations (screen size, orientation, etc.), device platforms, input modalities (ie, touch screen vs mouse or trackpad) and any other contextual variables provided by the application developer.
To construct VPI from data supplied by the application, the basic sequence of steps is as follows:
1. Estimate simple measures relating to the speed, accuracy and appropriateness (ie, correct vs incorrect) of user responses to stimuli and how these measures depend upon stimulus characteristics such as color, contrast, size, speed, duration, eccentricity and the total number of visible stimuli at the time of interaction.
Clinical Ophthalmology downloaded from https://www.dovepress.com/ by 118.70.13.36 on 20-Aug-2020
Dovepress
Ahmed et al
2. Normalize measures within the context of the application, specific experience or task, hardware configuration and, potentially, demographic details of the user.
3. Combine measures into subcomponent scores, subcompo-nent scores into composubcompo-nent scores and composubcompo-nent scores into an overall VPI.
Each experience provides data that are more or less appro-priate for estimating various measures (step 1), and in some cases, there will be insufficient data to estimate some measures (eg, a user’s response cannot be correct or incorrect if such a distinction is not made). Some tasks may emphasize speeded responses more than others, or the difficulty of a task may be very different, necessitating the second step to scale measures appropriately for the context. The third step uses principal component analysis (PCA) to favor those measures with more informative variation and reduce an arbitrary number of mea-sures down to one score. A distribution of data collected over time from multiple users is required for both normalization and combination, and so, like IQ, VPI scores can provide a relativeevaluation of users’ vision performance.
Baseline sample
The Vizzario SDK has been integrated into an application that is aimed at educating users about their vision. This applica-tion was built specifically to provide adequate informaapplica-tion for constructing VPI with all its components and subcomponents. Users are tasked alternatively with hitting targets among dis-tractors or adjusting a stimulus to match a sample. Figure 5 displays a sample screenshot of three such interactions. Each task measured various aspects of vision performance. Interac-tion data, collected from thousands of users, form a baseline sample allowing for accurate VPI scoring for similar tasks.
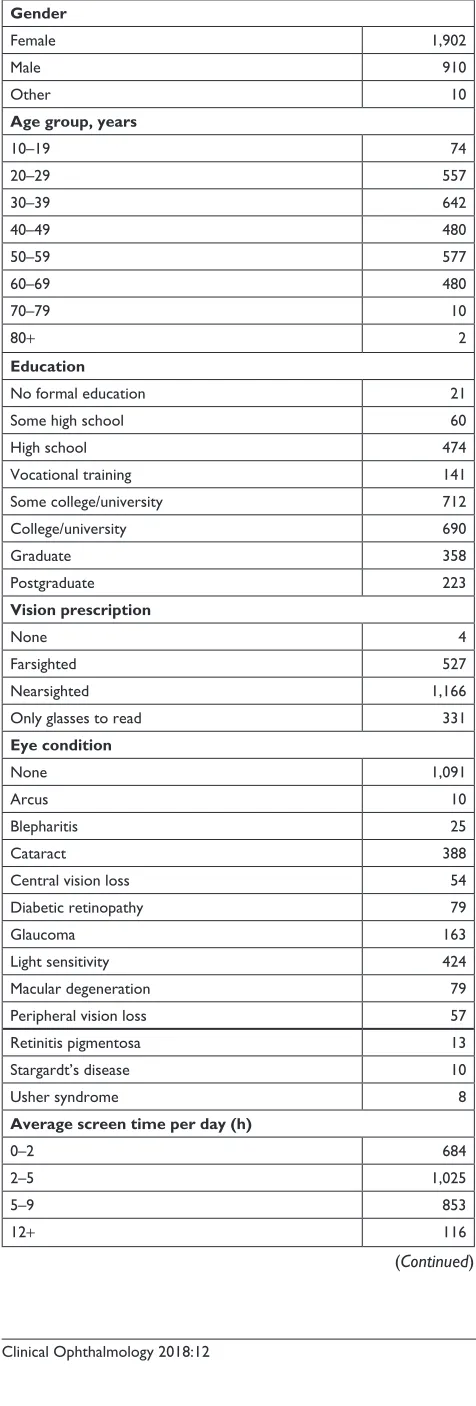
This normative database allows new users to be evaluated against a known distribution of normal users or even against subpopulations based on select demographic data provided by the baseline sample users (Table 1). Beyond individual users, the database also allows comparison for groups of users defined by, for example, some vision pathology. The component breakdown of VPI can enable researchers to explore specific performance decrements, or enhancements, correlated with a particular group of users.
In addition to providing a normative sample against which to compare data yet to be recorded, this baseline sample can by itself be used to explore various questions. Having made the case that we are spending increasing time engaged in digital behavior, we might ask what consequences that may have on vision performance. Note that users in the baseline sample indicated how many hours of “screen time” they typically have each day (Table 1, bottom of center column). Taking the middle of each time span, and 13 hours for the maximum category, we can characterize any existing (linear) trends with this variable. We find that there is a significant (P,0.001) positive correlation with the proportion of cor-rect responses (hitting targets and avoiding distractors) in the Balloon Pop and Match Pop games (Figure 5). This effect is very small (approximately 0.001–0.003 increase in the proportion of correct responses – 0.1%–0.3% – per hour increase in screen time); however, the base sample would allow for estimating VPI independently for novice vs expert users if so desired. There is a similarly small but significant (P,0.001) negative correlation with color-matching errors in the Picture Perfect game (matching hue as in Figure 5, saturation or brightness). In short, the baseline sample users who spend more time engaged in digital behavior perform
%DOORRQSRS
,, 0DWFKSRS ,, 3LFWXUHSHUIHFW ,,
,PDJH
2ULJLQDO &RORU
'RQH <RXUWDNH
Figure 5 example experiences used to gather baseline sample data.
Notes: Left: Users must click or tap target balloons (those with stripes) and ignore distractor balloons (those without stripes); balloons vary randomly in size, color, transparency
and speed (moving up). Middle: Users must click or tap target balloon containing the matching color and shape combination given at the top; one target is presented with varying number of distractors with random size, color and shape. Right: Users must use the slider to adjust the right image to match the left image; the parameter adjusted by the slider varies by trial among color (hue), saturation, brightness, (luminance) contrast, (Gaussian) blur and size. each experience lasts 45 seconds, with a countdown timer (upper left corner) and rightward moving progress bar (grey line below experience title). Users may pause using the pause button (upper right corner).
Clinical Ophthalmology downloaded from https://www.dovepress.com/ by 118.70.13.36 on 20-Aug-2020
Dovepress visual function, digital behavior and the vision performance index
Table 1 Number of users from the baseline study matching each category in a number of demographic groups
Gender
Female 1,902
Male 910
Other 10
Age group, years
10–19 74
20–29 557
30–39 642
40–49 480
50–59 577
60–69 480
70–79 10
80+ 2
Education
No formal education 21
Some high school 60
High school 474
vocational training 141
Some college/university 712
College/university 690
Graduate 358
Postgraduate 223
Vision prescription
None 4
Farsighted 527
Nearsighted 1,166
Only glasses to read 331
Eye condition
None 1,091
Arcus 10
Blepharitis 25
Cataract 388
Central vision loss 54
Diabetic retinopathy 79
Glaucoma 163
Light sensitivity 424
Macular degeneration 79
Peripheral vision loss 57
Retinitis pigmentosa 13
Stargardt’s disease 10
Usher syndrome 8
Average screen time per day (h)
0–2 684
2–5 1,025
5–9 853
12+ 116
(Continued)
Table 1 (Continued)
Personal health condition
None 1,271
Cancer 60
Diabetes 324
High cholesterol 538
Hypertension 541
Inflammatory disease 74
Metabolic syndrome 24
Migraine 483
Multiple sclerosis 34
Thyroid dysfunction 214
Family health condition
None 749
Alzheimer’s disease 339
Cancer 977
Diabetes 1,150
High cholesterol 891
Hypertension 881
Multiple sclerosis 54
Parkinson’s disease 135
Stroke 460
Average physical activity per week (h)
0–1 407
1–2 555
2–3 536
3–4 530
4+ 650
Note: in some cases, users were allowed inclusion into more than one category
(eye conditions, personal health condition and family health condition).
consistently, if slightly, better than users who spend relatively less time engaged in digital behavior.
Conclusion
Clinical tests of vision health have traditionally, and neces-sarily, been extensions of controlled experiments with little in the way of innovation. Physical and time constraints have produced acuity tests that are limited in range and spatial resolution and, consequently, in resolution of evaluation measures. Tests of coordination, attention, memory, contrast sensitivity, color discrimination, etc. are less common and often neglected.
The nature and ubiquity of interactive digital media provide a platform for visual stimulation and recording of responses that is available to a broader population than might be seen in the clinic. Evaluation, such as it is outside the con-trol of the clinic, can be done repeatedly and continuously. Digital behavior can be analyzed in the context of myriad
Clinical Ophthalmology downloaded from https://www.dovepress.com/ by 118.70.13.36 on 20-Aug-2020
Dovepress
Ahmed et al
tasks that challenge any and every aspect of vision perfor-mance. Indeed, digital behavior can be used to measure its own impact on vision.
The SDK provides a common language for developers to use for organizing data about users’ digital behavior. VPI provides a common framework for users to understand their vision in the context of their digital behavior and could be used by vision health providers to aid in educating patients about their vision health and even to monitor it outside the clinic.
In short, it is clear that our current means of measuring and understanding vision health are outdated and full of inaccuracies. Our interaction with digital media and tech-nology encompasses up to 50% of a 24-hour day. Utilizing this interaction as a foundation for measuring vision health, the Vizzario SDK provides a profound amount of data to set guidelines for technology use and monitor changes from baseline.
Acknowledgment
The authors would like to thank Jacob Mederos, Mohan Reddy and Adeel Tausif for their insights and technical aid in the preparation of this manuscript.
Disclosure
KC McDermott; WK Burge; and SKR Khaderi are employees of Vizzario Inc., and IIK Ahmed and DK Varma are advisors for Vizzario Inc., of which the VPI is the intellectual property. The other authors report no conflicts of interest in this work.
References
1. Frisén L. The neurology of visual acuity. Brain. 1980;103(3): 639–670.
2. Kaiser PK. Prospective evaluation of visual acuity assessment: a com-parison of snellen versus ETDRS charts in clinical practice (An AOS Thesis). Trans Am Ophthalmol Soc. 2009;107:311.
3. Snellen H. Letterproeven, tot bepaling der gezigtsscherpte. Vol. 1. [Letter tests , to determine the sharpness , Volume 1]. Greven J, Editor. 1862. Dutch.
4. Bailey IL, Lovie JE. New design principles for visual acuity letter charts.
Am J Optom Physiol Opt. 1976;53(11):740–745.
5. Ishihara S. Tests for colour-blindness. Handaya, Tokyo, Hongo Harukicho: 1917.
6. Farnsworth D. The Farnsworth-Munsell 100-Hue and Dichotomous Tests for Color Vision. J Opt Soc Am. 1943;33(10):568–578. 7. Reeves BC, Wood JM, Hill AR. Vistech VCTS 6500 charts-within- and
between-session reliability. Optom Vis Sci. 1991;68(9):728–737. 8. Pelli DG, Robson JG. The design of a new letter chart for measuring
contrast sensitivity. Clin Vision Sci. 1988;2(3):187–199.
9. Mcmonnies CW. Chart construction and letter legibility/readability.
Ophthalmic Physiol Opt. 1999;19(6):498–506.
10. Rosser DA, Murdoch IE, Cousens SN. The effect of optical defocus on the test-retest variability of visual acuity measurements. Invest Ophthalmol Vis Sci. 2004;45(4):1076–1079.
11. Laidlaw DA, Abbott A, Rosser DA. Development of a clinically feasible logMAR alternative to the Snellen chart: performance of the “compact reduced logMAR” visual acuity chart in amblyopic children. Br J Ophthalmol. 2003;87(10):1232–1234.
12. Early Treatment Diabetic Retinopathy Study Research Group. Early photocoagulation for diabetic retinopathy: ETDRS report number 9.
Ophthalmology. 1991;98(5):766–785.
13. Williams MA, Moutray TN, Jackson AJ. Uniformity of visual acuity measures in published studies. Invest Ophthalmol Vis Sci. 2008;49(10): 4321–4327.
14. Rosser DA, Murdoch IE, Fitzke FW, Laidlaw DA. Improving on ETDRS acuities: design and results for a computerised thresholding device. Eye. 2003;17(6):701–706.
15. Perera C, Chakrabarti R, Islam FM, Crowston J. The Eye Phone Study: reliability and accuracy of assessing Snellen visual acuity using smart-phone technology. Eye. 2015;29(7):888–894.
16. Phung L, Gregori NZ, Ortiz A, Shi W, Schiffman JC. Reproducibility and comparison of visual acuity obtained with sightbook mobile appli-cation to near card and snellen chart. Retina. 2016;36(5):1009–1020. 17. Bucksch J, Sigmundova D, Hamrik Z, et al. International trends in
adolescent screen-time behaviors from 2002 to 2010. J Adolesc Health. 2016;58(4):417–425.
18. Rideout VJ, Foehr UG, Roberts DF. Generation M 2: Media in the Lives of 8- to 18-Year-Olds. Henry J Kaiser Family Foundation. 2010. Avail-able from: https://files.eric.ed.gov/fulltext/ED527859.pdf. Accessed September 11, 2018.
19. Vanderloo LM. Screen-viewing among preschoolers in childcare: a systematic review. BMC Pediatr. 2014;14(1):205.
20. Rosenfield M. Computer vision syndrome (aka digital eye strain).
Optomet Pract. 2016;17(1):1–0.
21. Mussa A. Computer Vision Syndrom. Adv Ophthalmol Vis Syst. 2016;4(3): 00110.
22. Portello JK, Rosenfield M, Bababekova Y, Estrada JM, Leon A. Computer-related visual symptoms in office workers. Ophthalmic Physiol Opt. 2012;32(5):375–382.
23. Blehm C, Vishnu S, Khattak A, Mitra S, Yee RW. Computer vision syndrome: a review. Surv Ophthalmol. 2005;50(3):253–262. 24. Moon JH, Lee MY, Moon NJ. Association between video display
ter-minal use and dry eye disease in school children. J Pediatr Ophthalmol Strabismus. 2014;51(2):87–92.
25. Moon JH, Kim KW, Moon NJ. Smartphone use is a risk factor for pediatric dry eye disease according to region and age: a case control study. BMC Ophthalmol. 2016;16(1):188.
26. Laviola JJ. A discussion of cybersickness in virtual environments.
ACM SIGCHI Bulletin. 2000;32(1):47–56.
27. Lanum J. The damaging effects of light on the retina. Empirical findings, theoretical and practical implications. Surv Ophthalmol. 1978;22(4): 221–249.
28. Wu J, Seregard S, Algvere PV. Photochemical damage of the retina.
Surv Ophthalmol. 2006;51(5):461–481.
29. Youssef PN, Sheibani N, Albert DM, Toxicity Rlight. Retinal light toxicity. Eye. 2011;25(1):1–14.
30. Contín MA, Benedetto MM, Quinteros-Quintana ML, Guido ME. Light pollution: the possible consequences of excessive illumination on retina.
Eye. 2016;30(2):255–263.
31. Gopinath B, Baur LA, Wang JJ, et al. Influence of physical activity and screen time on the retinal microvasculature in young children.
Arterioscler Thromb Vasc Biol. 2011;31(5):1233–1239.
32. Anderson KV, Coyle FP, O’Steen WK. Retinal degeneration produced by low-intensity colored light. Exp Neurol. 1972;35(2):233–238. 33. Clark AJ, Yang P, Khaderi KR, Moshfeghi AA. Ocular Tolerance of
Contemporary Electronic Display Devices. Ophthalmic Surg Lasers Imaging Retina. 2018;49(5):346–354.
34. Ham WT, Mueller HA, Ruffolo JJ, Clarke AM. Sensitivity of the retina to radiation damage as a function of wavelength. Photochem Photobiol. 1979;29(4):735–743.
Clinical Ophthalmology downloaded from https://www.dovepress.com/ by 118.70.13.36 on 20-Aug-2020
Clinical Ophthalmology
Publish your work in this journal
Submit your manuscript here: http://www.dovepress.com/clinical-ophthalmology-journal
Clinical Ophthalmology is an international, peer-reviewed journal covering all subspecialties within ophthalmology. Key topics include: Optometry; Visual science; Pharmacology and drug therapy in eye diseases; Basic Sciences; Primary and Secondary eye care; Patient Safety and Quality of Care Improvements. This journal is indexed on
PubMed Central and CAS, and is the official journal of The Society of Clinical Ophthalmology (SCO). The manuscript management system is completely online and includes a very quick and fair peer-review system, which is all easy to use. Visit http://www.dovepress.com/ testimonials.php to read real quotes from published authors.
Dovepress
Dove
press
visual function, digital behavior and the vision performance index
35. Williams TP, Howell WL. Action spectrum of retinal light-damage in albino rats. Invest Ophthalmol Vis Sci. 1983;24(3):285–287. 36. Oh JH, Yoo H, Park HK, Do YR. Analysis of circadian properties
and healthy levels of blue light from smartphones at night. Sci Rep. 2015;5:11325.
37. Bailey IL, Lovie-Kitchin JE. Visual acuity testing. From the laboratory to the clinic. Vision Res. 2013;90:2–9.
38. Dahl J. Available from: https://commons.wikimedia.org/wiki/ File:Snellen_chart.svg. Accessed November 30, 2018.
39. Westhoff J. Tile arrangement for the 100 hues test. Available from: https://commons.wikimedia.org/wiki/File:100_hue_arrangement.jpg. Accessed November 30, 2018.
Clinical Ophthalmology downloaded from https://www.dovepress.com/ by 118.70.13.36 on 20-Aug-2020