Available online: http://edupediapublications.org/journals/index.php/IJR/ P a g e | 273
A Temporal Study of Human Resources
Development in the Akole Tahasil.
Gadekar Deepak Janardhan
*P. H. Mhaske
2*Research Students in Geography (Ph.D), Savitribai Phule Pune University, Maharashtra (Research centre - Prof. Ramkrishna More Arts, Commerce and Science College Akurdi, Pune), India.
2 Research Guide in Geography. (Research centre - Prof. Ramkrishna More Arts, Commerce and Science College Akurdi, Pune), India.
ABSTRACT:
Human resources are the greatest advantages of every nation. Man is producer, saver and consumer of resources thus he is not only the receiver of the total process development and utilization, but also the most strong and dynamic agent of production. Therefore, population is the essential element from which resources characteristic taking their significance and such human resources are playing very important role in its economic development. Human Resource Development is the process of growing, developing knowledge, the skills and the capabilities of the human. Human Resources Development is a structure for the development of human capital which is surrounded by a society during the development of together the society and the person to achieve presentation development. The main aim of these analyses is to focus on temporal variation and growth in the levels of Human Resource Development. In the first criteria is demographic, there are 04demographic variables, related to census 1991 and 2011 are selected, second variables related in occupation sectors there are 07elements selected and lastly HRD related variable agricultural sectors there are 04 elements selected to study the Human Resource Development.
KEY WORD: Human resources development,
Akloe Tahasil, quantity and qualities, Tribal area.
I. Introduction
Human resources are a term which is used in connection with the society. It is very important factor for the regional development. Quality of human resources development depends on such as literacy, education, health, population density, sex ratio and techniques, etc. Natural and Human resources plays a very important role in the development of the national economy. Human resource is one of the vital resources of a country. Its study falls under the preview of man in geography has for long been questioned by the geographers. Mainly because of the fact that
the former geographers had greater
Available online: http://edupediapublications.org/journals/index.php/IJR/ P a g e | 274 decade (1991-2011) years. The primary aim is to
study of temporal growth and pattern human resources development in study area and its positive and negative impact on balance of development.
II. Study Area
Geographically Ahmednagar district is the largest district in the state of Maharashtra. It is divided into 14 Tahsils. Is one of the Akole tahasil on western Hilly region western part of the Ahmednagar district, It is divided into 191 villages and 4 (Four) Revenue Circles namely Rajur, Akole, Samsherpur and Kotul. There are total population of this tahsil is 2, 71,719 [20011] one of which 1, 01,966 [ST] Tribal people and Population is 2, 91,950 Census 2011.literacy 1, 92,461 persons and one of which 1, 39,730 (ST) Tribal people in this area. Akole tahasil is located in 19015' 14'' N to 190 44' 59'' N latitude and 730 37' 00''to 740 07' 24'' E (Fig. No 01 Location Map) longitudes Total Geographical area is150508 hectors.
III. Objective
The major objective is to analysis and focus on temporal variation and growth of Human Resource Development in study area. The parameters are used in Human resources development Population density, growth, sex ratio, literacy, occupation structures,
Agricultural density, Nutritional and caloric density, marginal resources density these all parameters are calculated in 1991 to 2011 years.
IV. Date base and methodology
The researcher has been to use secondary data for related human resources development parameters in data based on 1991 to 2011 decade years in District censuses years of Ahmednagar. And agricultural related information collected in agricultural department. The used has been varies method and technique on the related works. The good quality and suitable method apply due to essay calculated the work and to good comes with the outputs. The analyzed human resources development and to match statistical and cartographic techniques have been used. The used statistical techniques are quantitative data to convert the qualitative data e.g. population density, growth rate, sex ratio, literacy, agricultural density, nutritional, caloric density and marginal resources density. V. Result and Discussion
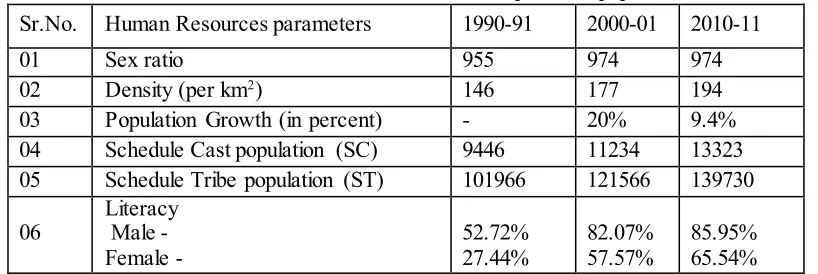
Available online: http://edupediapublications.org/journals/index.php/IJR/ P a g e | 275 Table 1 – Parameters in Human resources development of population
Sr.No. Human Resources parameters 1990-91 2000-01 2010-11
01 Sex ratio 955 974 974
02 Density (per km2) 146 177 194
03 Population Growth (in percent) - 20% 9.4%
04 Schedule Cast population (SC) 9446 11234 13323
05 Schedule Tribe population (ST) 101966 121566 139730
06 Literacy Male -
Female - 52.72% 27.44% 82.07% 57.57% 85.95% 65.54%
Sources: District censes of Ahmednagar.
1. Sex Ratio
The sex composition is also important human resources components for the human development. It’s considered an important indicator of inequality between males and females in a society.Sex ratio is defined as the number of females per thousand males. Sex ratio is one of the significant indices of social but also economic conditions of an area and important
parameter for regional analysis of all the demographic attributes of a population, the sex structure is most essential characteristic of demographic and resources study.The condition of sex ratio in the study area revels that from 1991 to 2011 that is 955, 974 and 974 females per 000’ males. The sex ratio in 2011 census is 974 for the study as a whole, 976 for rural areas and 917 for urban areas.
Figure 1: Literacy Figure 2: Sex Ratio
2. Density of Population:
Density of population has it’s upon the environment of the region and hence its quality of life. Therefore it is of special interest for geographers to analysis the changing pattern of density of population for understanding the processes of development affecting quality of life. The density of population is a measurement of population pressure on a given unit of land. The density of population shows the land man ratio. The sequential change in the density of population of tahasil 1990-91 to 2010-11 has been shown in table no.01. The density of rural
population in relation to cultivated area is moderate to high in the irrigated land. The population density is continues change in period wise that is 1991, 146 per sq. kms living the people with the 2001 year density is 177 persons per sq. kms in 1991 showing continuous increasing in the population density. Western part of akole very low density this area is hilly region and density increasing eastern part because of come out the plain area with
development of agricultural and well
Available online: http://edupediapublications.org/journals/index.php/IJR/ P a g e | 276
3. Population Growth: one of the
requirements of population growth analysis is that the data at two points in time should be comparable. It referred to the change in number of population of a region during a definite period of time. This change can be expressed any in terms of complete number or in terms of percentage. The growth of population in any area is an index of its economic development social conduction and a lot of other disposition. The growth of population in any area is resolute by three basic factors e.g human fertility, mortality and mobility. The period 1991 to 2011 was chiefly due to the increase speed developmental activities and upgrading in the health facilities. The standard of living and medical facilities reduced the death rate. The high birth rate and low death rate resulted into the rapid growth of population. In since 1990-91
to 01 population growth in 20%, and 2000-01 to 2010-11 growth rate is 9.4%.
4. Literacy:
The expression literacy is one of the very important qualitative indictors of social development related to the economic expansion. Level to day education is the mainly interesting tool for varying the socio-economic standing of a human being and society as a whole. Literacy level is one of the most important indicators of social development. Improvement in literacy is
an important index of socio-cultural
development and economic change of a society. However, literacy rate is the number of literate persons for each hundred people and is expressed in percentage. According to census 2011, a person aged seven and above, who can both read and write understanding in any language, is treated as literate. A person, who can only read but cannot write, is not literate. In the censuses prior to 1991, children below five years of age were necessarily treated as illiterates. The face literacy is one of the very significant qualitative indictors of social development connected to the economic development. Even today education is the most
amazing elements for changing the socio-economic position of a human being and society as an entire.
The level of education in a society is a good measure of its development towards modernization. The process of literacy and education is often liable for changing employment, occupational pattern and also increase speed mobility of population in the study area. Therefore, literacy and educational status of folks in a society serves as one of the best indicators indicates the quality of population. Literacy is one the great challenge in the tribal society. In the study area, as per population census 1991, the literacy rates of male and female be real 52.72 % and 27.44%, 2001, literacy rates is 82.07 % and 57.57 % and 2011, the literacy rates of male and female be real 85.95 % and 65.54 % correspondingly. The percentage of literacy in the study area was 40.11% in 1991, 69.95% in 2001, and 75.85 % in 2011.
5. Occupation structures:
Human resources development is based on economic opportunities for the available population meaning there by available workforce. The study of the economically dynamic population or labour force occupies an important position in the field of population
geography. The economic and social
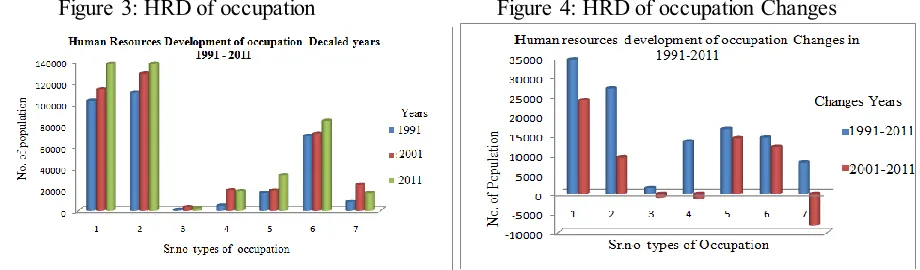
Available online: http://edupediapublications.org/journals/index.php/IJR/ P a g e | 277 Table 2: Parameters in Human resources development of occupation
sr. no Types of occupation No. of engaged Population in
Decaled years Change1
991-2011
Change 2001-2011
1991 2001 2011
01 Total main workers 103173 113704 137755 34582 24051
02 Non workers 10656 128424 137815 27159 9391
03 Household industry et,
workers 677 3224 2220 1543 -1004
04 Other workers 4564 19349 18001 13437 -1348
05 Agricultural labours 16576 19019 33307 16731 14288
06 Agricultural cultivators 69771 72112 84227 14456 12115
07 Marginal workers 8324 24510 16380 8056 -8130
Sources: District censes of Ahmednagar.
The Parameters in Human resources
development of occupation like total main,
Non-works, Household Workers, agricultural
cultivators and labours with marginal workers he studded 1991 to 2011 with the change detection. In since 1991 to 2001 changes in vary sectors are positive growth. But change between in since 2001 to 2011 a negative change in Household industry workers, other workers and marginal workers otherwise positive growth of remain sectors like total main workers, non workers, agricultural labours and cultivators. Other workers including in Trade and Transport
activities, this sectors negative change because of study area is tribal area no suitable topography for development in transport modes. And limitation of Households industry or industrial sectors because of well situation of forest area with tribal area and western part of akole declares of Hotspots in wildlife. Thus the reaming agricultural sectors only one sectors development, this sectors under the workers increasing years to years. This all related information and changes ratio to match table no 2 and figure no 3and 4.
Figure 3: HRD of occupation Figure 4: HRD of occupation Changes
6. Agricultural density:
Agricultural density means ratio between the numbers of agricultural population and actual net sown area in particular place or area. In the study area agricultural density is progressing in very decade years in 1991(243) 2001(291) 2011(319 person per 100 hectares). Means high
Available online: http://edupediapublications.org/journals/index.php/IJR/ P a g e | 278 decade years on the agriculture activities. This
means that the population pressure on the agricultural land in this area is high as more than 319 persons per 100 hectares. This all types change and related information show in table no 3 and figure no 5&6.
𝐀𝐠𝐫𝐢𝐜𝐮𝐥𝐭𝐮𝐫𝐚𝐥 𝐝𝐞𝐧𝐬𝐢𝐭𝐲
= 𝑃𝑜𝑝𝑢𝑙𝑎𝑡𝑖𝑜𝑛
𝑁𝑒𝑡 𝑆𝑜𝑤𝑛 𝐴𝑟𝑒𝑎𝑥100
7. Caloric Density:
Caloric density is a method of calculating man and land ratio in comparison to other density. It is ratio between total rural number of population and total food cropped area. It is expressed in terms of number of persons per kilometer of food cropped area12. In the akole thasil caloric density are changes in decaled years wise in 1991, 699. 2001, 814 and last decaled years 2011 caloric density was 569 person per 100 hectares. Caloric density decline in 2011 decaled year it’s may be first causes is population are increase but same ratelly not increasing food cropped area and second causes is decline the food cropped area and farmers agricultural thought changes, the maximum farmers view said in commercial crops and other crops. This all types change and related information show in table no 3 and figure no 5&6.
Caloric Density
= 𝑃𝑜𝑝𝑢𝑙𝑎𝑡𝑖𝑜𝑛
𝐴𝑟𝑒𝑎 under food crops𝑥100
8. Nutritional density:
Nutrition density is a more refined method of calculating ratio in comparison to other density. It is also a micro-fine shape of physiographic density to calculate the density of an area. It is ratio between total population and total food cropped area. It is expressed in terms of number of person per square kilometer of food cropped area. Therefore, it will be a true measure of ratio between man and land in the tahasil level where agriculture is a main resource of human beings12. In the period of 1991 224 person per 100 hectors, 2011 221 person per 100 hectors this ratio is negative change. The nutritional density is decline each year because of number change in agricultural sectors e.g increasing commercial crops, growth of Irrigation methods and
techniques, and changes a farmer view etc. this all elements effects on the nutritional density. Thus the study of nutritional density is an implement to understand population pressure on geographical cultivated area. This all types change and related information show in table no 3 and figure no 5&6.
Nutritional density
= 𝑇𝑜𝑡𝑎𝑙 𝑃𝑜𝑝𝑢𝑙𝑎𝑡𝑖𝑜𝑛
𝐺𝐶𝐴 𝑥100
9. Marginal resources Density:
Available online: http://edupediapublications.org/journals/index.php/IJR/ P a g e | 279
MRD = 𝑅𝑢𝑟𝑎𝑙 𝑃𝑜𝑝𝑢𝑙𝑎𝑡𝑖𝑜𝑛
𝐴𝑟𝑒𝑎𝑠 𝑛𝑜𝑡 𝑎𝑣𝑎𝑖𝑙𝑎𝑏𝑙𝑒 𝑓𝑜𝑟 𝑎𝑔𝑟𝑖𝑐𝑢𝑙𝑡𝑢𝑟𝑒 x100
Table 03 Parameters in human resources development of agricultural Sr.no Types of Parameters Index Value in decaled years wise (Density per 100
Hectare.) Change
1991-2011
1991 2001 2011
01 Agricultural density 243 291 319 76
02 Caloric density 699 814 569 -130
03 Nutrition density 224 218 201 -23
04 Marginal resources
density 483 457 380 -102
Sources: Compiled by theAuthor
Figure 5: HRD of agricultural development, Figure 6: Change: HRD of agricultural development
VI. Conclusion
1. The average literacy is 40.11% in 1991, 69.95% (2001) and last decaled year 2011 75.85%.
2. The average literacy of male is increasing more than female literacy rate each decaled years.
3. The average sex ratio in 1991 (955 female per 1000 male) but 2001 and 2011 decaled year sex ratio is consented 974.
4. Population growth rate is decline in 2001 to 2011, 20% to 9.4% come out the rate.
5. The agricultural is major economical activities because more than averagely 70% people engaged these sectors.
6. Non worker rate is increasing each decaled year with positive changes this situation is not good for human resources development elements. 7. Other and Household industry in related
workers is decaling rate each decaled year.
8. The agriculturally human resources parameters like agricultural, caloric, nutritional marginal resources density each decaled year positive and negative changes.
9. Caloric, nutrition and marginal
resources density is negative movement and agricultural density is positive movement.
Available online: http://edupediapublications.org/journals/index.php/IJR/ P a g e | 280 and human geography. The studies also
provide the scope for geographical planning. The present investigation has taken an over human resources development.
VII.
Significance of
research
This study will be useful for the understanding of population characteristics and human resources development helpful future palling in population, agricultural, social development, and parameters in human resources. It will be provide help for policy planning and programmed completion of the government.
Refere nces
[1] Ahmednagar District Censes Hand book (1991): ‘Series 14, Part xii A and B’, Govt. Central Press, Mumbai (MS), Pp 224-45,546-61.
[2] Amol M.W & Sadhan H.B(2010) .Application of GIS Techniques to evaluate intensity of population pressure at micro-level.
Uttar Pradesh Geographical Journal
Vol.15.Pp10-17.
[3] Bhoge T.O (2010).Human Resources Development in Janlgaon District. Shodh, Samiksha aur Mulyankan International Research Journal. Vol. II, Issue-13 Pp 51-53.
[4] Census of Ahemdnagr
District1991Hardcopy, 2001,
2011(online-Softcopy).
[5] Chandna R.C (2014) Geography of Population , Kalyani Publishers New Delhi.,pp 93,
[6] Deepika , et,al. (2010) Human Resources
development in Varanasi District: A
Geographical Analysis, Uttar Pradesh
Geographical Journal, Vol.15pp 32-41.
[7] Divya Shukla, et,al. (2015)” Spatio-Temporal Analysis of Human Resource Development in District Headquarters of Rajasthan” International Journal of Innovative
Research in Science, Engineering and
Technology. Vol. 4, Issue 1, pp 19087-19092.
[9] Gadekar Deepak J (2015) Human Resources Development in the Akole Tahsil, Ahemdnagr District, (M.S, India) Quest international Multidisciplinary Research Journal Vol- IV, Issue-IV Pp113-119.
[10] Gadekar Deepak J (2015) Level of Human Resources development-Concepts and Review, Acme international Journal of Multidisciplinary Research Journal, Vol-III Issue-VI Pp 48-61. [11] Gadekar Deepak J, et,al. (2016) A Hybrid Land Cover Classification of Landsat-7 & 8 (OLI) ETM+ Data for Resourceful Vegetation Mapping - Akole Thasil Dist- Ahmednagar, M.S, India American International Journal of Research in Humanities, Arts and Social Sciences Vol.3 Pp217-221.
[12]Gulab S.B (1995) Geography of Human Resources, Mohit Publication New Delhi . [13] Mahesh D. And Shivalingappa B.N (2011). Regional Disparities of human Resources Development in South India. E- International Scientific Research Journal Vol. III Issue.4, P/p 299-306
[14] Mushir Ali (2009): ‘Geography of Agriculture Marketing at Grass Roots Level’, Pacific Publication, Delhi, Pp 39-43
[15] Ramotra K.C, et,al. (2010) Occupation Structure of Tribal Population in Dhule and Nandurbar Districts of Maharashtra. The Goa Geographer Vol.VII No. 1 Pp, 31-41.
[16] Sarvjeet Singh , et,al. (2013): ‘A geographical analysis of literacy and sex ratio in Jammu and Kashmir’, The Deccan Geographer Vol-51, No. 1 and 2, Jun-Dec, International Geographical Journal, India, Pp 75-81.
[17] Tiwari, R. K. (2001): Human Resource Development in Jharkhand, Geographical Review of India, Vol. 63, No.4, Pp.367.
[18] Tripathi R. S. et,al.. (1995): ‘Occupational Characteristics of Urban Centers Chhattisgarh Region (Madhya Pradesh), The Deccan Geographer, Vol. 33, No. 1, Pp. 47-54.