A method for defect repair of MFI-type zeolite membranes by multivalent ion infiltration
Bo Zhu, Xiurong Hu, Jin-Wook Shin, Il-Shik Moon, Yoshito Muraki, Gayle Morris, Stephen Gray, Mikel Duke
PII: S1387-1811(16)30392-4
DOI: 10.1016/j.micromeso.2016.09.011 Reference: MICMAT 7896
To appear in: Microporous and Mesoporous Materials
Received Date: 12 May 2016 Revised Date: 7 September 2016 Accepted Date: 8 September 2016
Please cite this article as: B. Zhu, X. Hu, J.-W. Shin, I.-S. Moon, Y. Muraki, G. Morris, S. Gray, M. Duke, A method for defect repair of MFI-type zeolite membranes by multivalent ion infiltration, Microporous and Mesoporous Materials (2016), doi: 10.1016/j.micromeso.2016.09.011.
M
AN
US
CR
IP
T
AC
CE
PT
ED
M
AN
US
CR
IP
T
AC
CE
PT
ED
A method for defect repair of MFI-type zeolite membranes by
multivalent ion infiltration
Bo Zhu a, Xiurong Hu b, Jin-Wook Shin c, Il-Shik Moon d, Yoshito Muraki e, Gayle Morris f, Stephen Gray a and Mikel Duke a1
a
Institute for Sustainability and Innovation, College of Engineering and Science,
Victoria University, Werribee Campus, PO Box 14428, Melbourne, VIC 8001, Australia
b
Chemistry Department, Zhejiang University, Hangzhou, Zhejiang 310028, P. R. China
c
Chosun Refractories Co. Ltd., Taein Dong, Kwangyang-si, Jeonlanam-do 545-893,
Republic of Korea
d
Department of Chemical Engineering, Sunchon National University, Maegok Dong,
Suncheon 540-742, Republic of Korea
e
C.I. Ceramics (Aust.) Pty. Ltd., Rivulet Crescent, Albion Park Rail 2527, Australia
f
Research Services Office, Flinders University, Adelaide 5001, Australia
ABSTRACT
MFI-type zeolite membranes are effective for molecular separations, however suffer
from non-selective defects. Here we show a means of plugging defects by infiltrating
with rigidly bound multivalent ions, and demonstrate improvement to performance as
1
M
AN
US
CR
IP
T
AC
CE
PT
ED
salt rejecting (water selective) desalination membranes. Ion uptake into the MFI-type
zeolite powder during exposure to a pH 2 solutioncontaining Fe3+, Al3+, Ca2+ and Mg2+
showed a strong uptake of Fe3+ and Al3+. N2 gas porosimetry showed an increase in
micropore proportion, being evidence that adsorbed ions did not enter the intrinsic pores
of MFI-type zeolites, instead occupying the larger microporous (grain boundaries) and
mesopores. X-ray diffraction (XRD) showed shrinkage in the zeolite crystal, being
evidence of loss of monovalent cations within the intrinsic pores supported by the ion
uptake results. Zeolite membranes were infiltrated with the solution at 7MPa. Acid and
water leaching revealed Fe3+ was the most strongly incorporated. This was confirmed by energy-dispersive X-ray spectroscopy (EDS) mapping on the surface of the
membrane. The practical effect of the defect repair method was demonstrated on four
membranes, where salt rejections in a reverse osmosis experiment were consistently
improved (e.g. salt rejection increased from 24% to 84%). Further work should consider
benefits to other applications of zeolite membranes including gas separation and
pervaporation.
Keywords: MFI-type zeolite membrane; Ion infiltration; Structure refinement; Defect
repair; Desalination performance
1. Introduction
Desalination is now commonly performed using membrane technology in reverse
osmosis (RO) mode. The fundamental requirement of the membrane to carry out
M
AN
US
CR
IP
T
AC
CE
PT
ED
While conventional RO membranes made from polyamide are low cost and offer high
flux (12–17 Lm-2h-1 forseawater with a typical total dissolved solids of 35000 mgL-1 at
operating pressure of 5.5–6.5 MPa) [1] and excellent ion rejection (up to 99.8% salt
rejection) [2], they are not stable under more challenging environments such as heat
(>80 °C), oxidants such as chlorine and extremes of pH. Inorganic and
organic/inorganic hybrid materials can offer these properties, but the material must
possess the essential functional feature to pass water molecules and block ions (i.e.
desalination). SAPO-34 (a silicoaluminophosphate with chabazite (CHA) type
framework) and ZIF-8 (zeolitic imidazolate framework) have been explored for RO
desalination but did not possess the correct structure or integrity to permeate water and
reject salts [3]. However inorganic materials which possess these properties are silica [4,
5], hybrid organically bridged silica [6, 7] and zeolites [8-13].
Synthetic zeolite materials have been extensively studied for a variety of applications
including catalysis, adsorption, sensing and separation [14-23]. Significant progress in
the preparation and characterisation of zeolite membranes has stimulated research in
their application for various molecular level separations including gas phase and liquid
phase mixtures. Zeolite materials are also promising candidates for filtration of aqueous
solutions, where their small pores enable a functional property to diffuse water but
reject organics and/or ions [17, 22]. In these applications, their chemical robustness
makes them ideal candidates for more durable operation and simplified processes.
Several research groups have explored the possibility of using MFI-type zeolite
M
AN
US
CR
IP
T
AC
CE
PT
ED
desalination application [2, 12, 17-21, 24-26]. The MFI-type zeolite has orthorhombic
crystal symmetry with nearly cylindrical, 10-member ring channels. The aperture size of
the MFI-type zeolite is around 0.56 nm [19], which is smaller than the sizes of hydrated
ions but larger than the kinetic diameter of water as shown in Table 1 [27]. Recent
studies showed that MFI-type zeolites had dynamic behaviour when interacting with
different ion complexes (e.g. seawater), and thus caused a change in structure and
porosity that could impact on diffusion properties of this material when used as a
desalination membrane [28, 29]. For example, monovalent cations (e.g. K+, Na+) can
uniquely enter the zeolite lattice pores, while divalent cations (e.g. Ca2+, Mg2+) can be
absorbed into the grain boundaries of zeolites.
Table 1 Kinetic diameter of water and hydrated ions [27].
Ion Hydrated diameter (nm)
H2O 0.276
K+ 0.662
Cl- 0.664
Na+ SO4
2-0.716
0.758
Ca2+ 0.824
Mg2+ 0.856
Fe3+ 0.914
Al3+ 0.950
Performance testing has demonstrated that MFI-type zeolite membranes working in
M
AN
US
CR
IP
T
AC
CE
PT
ED
at 700 kPa [25], and Na+ rejection was measured at 99.4% at 2.76 MPa for 0.1 M NaCl
solution (5,840 mg L-1, or approximately 9,150 µS cm-1) [12]. Recently, researchers have also attempted to treat synthetic industrial solutions using MFI-type zeolite
membranes [11, 12]. These studies showed that MFI-type zeolite membranes had great
potential for separation of dissolved organics from aqueous solution, as an example an
organic rejection of 99.5% was achieved for 100 ppm toluene with a water flux of
0.03 Lm−2h−1 at an operation pressure of 2.76 MPa [12]. Recent work from our
laboratories [2] demonstrated the use of MFI-type zeolite membranes for desalination
of saline recycled wastewater, highlighting the possibility of avoiding the costly
pre-treatment needed for polymeric RO membranes. The zeolite membrane achieved a salt
rejection of 80% and an organic rejection of >90%. The zeolite membrane also
withstood 168,000 ppm.h of chlorine exposure demonstrating its high chemical
tolerance enabling simplified cleaning and biofouling control techniques. Despite these
promising outcomes,to reduce capital cost and increase desalination capacity, flux and
rejection of zeolite membranes need to be simultaneously improved. Fluxes have been
reported in the range of 0.5–1.4 Lm-2h-1 at a pressure of 2.76 MPa [30], which is lower
than polymer RO membranes. Zeolite membrane thickness is considered as a potential
reason for reduced flux. Zeolite membranes (a few µm thick) [2, 17, 18] are much
thicker than commercial RO membranes (0.2 µ m) [31, 32]. Membrane resistance to
water transport is proportional to the dense skin thickness and hydrophilic property.
Some studies have shown that the flux of zeolite membranes could be improved by
changing the hydrophobicity of the membrane [30] or by filtering through a thin single
crystal zeolite nano-membrane [33]. Improved membrane films must also have
M
AN
US
CR
IP
T
AC
CE
PT
ED
techniques to repair defects may be useful in improving membrane flux and separation
performance.
Making intact zeolite membranes reliably is another major issue. The prior studies
have identified that multivalent cations cannot enter the intrinsic zeolite pores, while
monovalent cations such as K+ and Na+ can but are hindered by the inability for the
counter ion Cl- to enter yielding a desalination effect [34]. Trace amounts of multivalent
cations such as Ca2+ in seawater can occupy the grain boundaries but are also blocked in
defect free membranes. Meanwhile larger cations such as Fe3+ and Al3+ will likely have
a strong association with the zeolite structure due to their higher valance and ability to
co-ordinate and form rigid networks. This supports the concept that these ions by virtue
of their exclusive occupation of large defect pores via multiple co-ordination sites could
potentially be utilised to inhibit non selective flux in defect pores but maintain water
permeation through the intrinsic pores. In order to infiltrate the cations into the defects,
their ability to co-ordinate first needs to be minimised by reducing their interaction with
the zeolite by reducing the surface charge which is normally strongly negative for the
silica rich zeolite. For silicalite (having no added aluminum) the surface isoelectric
point was observed at a pH of 5. Above this value, the zeolite surface was negative, and
below this value the surface became very slightly positive [35]. However, the Al2O3
-supported MFI membranes are generally not Al free in their frameworks despite the use
of Al-free synthesis solutions during the membrane preparation [18, 36]. Al can be
incorporated into the zeolite framework due to the dissolution of the Al2O3 surface in
the high concentration of NaOH synthesis solution and solid-state diffusion of Al3+
M
AN
US
CR
IP
T
AC
CE
PT
ED
however, there appeared to be a slight trend to continue towards a neutral surface as the
pH was reduced to less than 3 [35]. Therefore, ion infiltration should be performed at
low pH (e.g. <3) where charge value is lowest due to weak charges of the material
surface around this low pH value, and the strong charge attraction of the ions within the
grain boundaries can be established by returning pH to the membrane’s operational
value typically around pH 7 where very strong negative charges of the zeolite are
observed. The aim of this study is to undertake the first known investigation into the use
of infiltrated multivalent ions for the defect repair of zeolite membranes, and
demonstrate the effectiveness in membrane desalination reverse osmosis application.
The study was carried out by first exploring the uptake of common low cost
multivalent ions Fe3+, Al3+, Ca2+ and Mg2+ into MFI-type zeolite powders. The change
to crystal structure as a result of the ion uptake was analysed by X-ray powder
diffraction (XRD), and the porous property was analysed by N2 porosimetry. In order
to confirm the function of defect repair by infiltration of the ions, a MFI-type zeolite
membrane was fabricated on top of a tubular α-alumina substrate by seed rubbing [2,
24, 38, 39] and secondary hydrothermal growth [2, 24]. The prepared membrane was
infiltrated at high pressure using the ion solution. The strength of the ion association
into the zeolite was evaluated by acid solution and water leaching. The infiltrated
membrane was then evaluated by gas permeation (H2 and N2) and then the repair
M
AN
US
CR
IP
T
AC
CE
PT
ED
2. Experimental and methods
2.1 Materials
The multivalent ion-rich solution containing Fe3+, Al3+, Ca2+, Mg2+, SO42- and Cl- used
for ion infiltration experiments for both zeolite powders and membrane in this study
was prepared by adding 138 g Al2(SO4)3·18H2O (AJAX Chemicals, Australia), 205 g
MgSO4·7H2O (Merck, Australia), 58 g Fe2(SO4)3·9H2O (AJAX Chemicals, Australia)
and 1.7 g CaCl2·2H2O (Merck, Australia) into 2 L deionised water (DI water). The
solution prepared above was filtered using a 0.45 µm membrane filter to remove
undissolved solids prior to ion infiltration experiments. The pH of the pre-filtered
solution was measured at 2.03. The MFI-type zeolite powder used for ion infiltration
has a Zeta potential of 9.16 mV at pH 2 (measured by a Nano-ZS Zetasizer, Malvern
Instruments, UK), where at pH 7.5 it has been measured at -38 mV [20]. Exposure of
the zeolite to the ion solution at the measured pH (2.03) therefore provided a surface
charge that was ideally weak in order to minimalise the charge attractions and
repulsions between the ions and zeolite surface, which maximises the ability for
infiltration of the ions into the defects of the entire material.
1 M tetra-propyl ammonium hydroxide (TPAOH) solution and tetraethyl orthosilicate
(TEOS) (98%) used for membrane preparation were purchased from Aldrich. The
MFI-type zeolite seeds (ZSM-5, SiO2/Al2O3 = 360) used for seed-deposition were supplied
by ACS Material, USA. The particle size distribution of the MFI-type zeolite seeds was
M
AN
US
CR
IP
T
AC
CE
PT
ED
The porous α-Al2O3 tubular support (95.7% Al2O3, apparent porosity 34.9%, external
diameter 15 mm, internal diameter 10 mm, length 25 mm, mean pore size ~12.2 µm)
used for the current work was supplied by Chosun Refractories Co. Ltd, Korea.
2.2 Ion infiltration into zeolite powders
Ion infiltration into zeolite powders was carried out by mixing 1 g high silica
MFI-type zeolite powder with 5 mL ion solution in a 50 mL centrifuge tube, and shaking in a
water bath at room temperature (21 °C) for 48 h. Ion behaviour due to the zeolite was
also assessed by exposing them only to DI water. After powder infiltration experiments,
the mixture was centrifuged (4000 RPM, 10 min) and supernatant decanted from the
powder immediately to avoid any further interactions. The supernatant was analysed for
cations (including S) by ICP-OES (Shimadzu ICPE-9000). The ion infiltrated zeolite
powders were washed with DI water three times to remove any free solution and oven
dried at 80 ºC overnight for further characterisation. The adsorbed amount of cations
was estimated from ion concentrations measured by ICP-OES and presented as the
amount of ion i adsorbed per gram zeolite, Cz,i, (mmol g-1) according to:
Cz,i =(Cb,i,0 - Cb,i,t)·V/mz (1)
where Cb,i,0 is the concentration of ion i in the bulk supernatant solution initially, Cb,i,t is
M
AN
US
CR
IP
T
AC
CE
PT
ED
= 48 h), both in mmol L-1, mz is the mass of the zeolite added to the solution (g) and V is the volume of the solution added to the zeolite powder.
2.3 Structural characterisation of powder samples
The original and ion infiltrated zeolite powders (washed) were characterised by XRD
and N2 porosimetry. XRD was performed with D/Max-2550pc X-ray powder
diffractometer using CuKα radiation (tube operating at 40 kV and 250 mA) with
scintillation detector in the range of 3–90º 2θ with a 0.02º step and 1 second per step
counting time. Variable slits (DS and SS) were used and RS slit was 0.15 mm. To
investigate the structure changes in three dimensions, structural refinement using the
Rietveld method [40] was carried out on the XRD data obtained for the original and
multivalent ion solution exposed zeolite samples. All the structure refinements were
performed using MDI Jade 9.0 software (Materials Data Inc., USA). N2 adsorption
experiments were carried out using a TriStar 3000 porosity analyser (Micromeritics,
USA) at liquid N2 temperature on samples degassed under vacuum for 4 h at 150 °C. In
order to reduce instrumental error, the equipment was calibrated with the carbon black
standard sample (specific surface area: 30.6 m²g-1 for multi-points and 29.9 m²g-1 for single-point) supplied along with the instrument prior to testing on the zeolite samples.
The specific surface area of the carbon black standard was measured at 30.9 m²g-1 for
multi-points and 30.2 m²g-1 for single-point. The error range was around 1%.
M
AN
US
CR
IP
T
AC
CE
PT
ED
2.4 Preparation of MFI-type zeolite membrane
The MFI-type zeolite membrane was coated on the above-mentioned porous α-Al2O3
tubular support by a seeded secondary growth technique that has been published
elsewhere [2, 24]. In this technique, the seed-deposition was performed by directly
rubbing MFI-type zeolite seeds (ZSM-5, SiO2/Al2O3 = 360, ACS Material, USA) onto
the α-Al2O3 support [38, 39]. Following seed-deposition, hydrothermal secondary
growth was carried out in a growth solution of 2 mL of 1 M TPAOH, 2 mL of TEOS
and 36 mL DI water at 180 °C for 16 h. After growth, the membrane was washed in
deionised water to remove loose precipitate and was then calcined at 500 °C for 4 h.
2.5 Membrane ion infiltration procedure
Infiltration of ions was performed using pressurised filtration of the ion solution
through the zeolite membrane. The ion solution was fed to the membrane at an applied
pressure of 7 MPa and room temperature (21 °C) in a system similar to that used for
desalination test in our previous work [24]. The membrane was installed into the
stainless steel membrane housing, and the ion solution was fed at a flow rate of
5 mLmin−1 by a high pressure piston pump (Series 1, LabAlliance, USA). The ion
infiltration experiments were conducted in a cross-flow setup with the feed solution fed
under pressure on the outside and permeating to the inside of the membrane. The ionic
strength of the feed and permeated water was measured electrical conductivity (EC)
with a portable conductivity meter (Sension 156, HACH). EC has been used in this
M
AN
US
CR
IP
T
AC
CE
PT
ED
analysed by inductively coupled plasma-optical emission spectrometry (ICP-OES)
(Shimadzu ICPE-9000). Rejection (rj) of ion j was calculated by:
100 ) (
(%)
, ,
, − ×
=
f j
p j f j j
c c c
r (2)
where Cj,f and Cj,p are ICP-OES measured concentrations of ion j (j = Fe3+, Al3+, Ca2+, Mg2+ or SO42-) in the feed and permeate solutions, respectively.Flux J, (Lm−2h−1) was
calculated according to:
At v
J = (3)
2.6 Membrane characterisation
Gas permeation was used to evaluate intactness of the zeolite membrane. Permeation
of either He or N2 was carried out by feeding the gas at 100 kPa to the film-side of the
membrane using a simple membrane test system as described in a previous study [24].
Gas permeation testing was conducted at 100 ºC in order to remove adsorbed water
from the pores to enable gas probing of the zeolite micropores. Permeation was
calculated by normalising the data to the membrane area and pressure drop monitored
by a TPI 665 digital manometer (Test Products International, Inc. USA) during the
permeation test. Elemental analysis on the membrane surface was performed by
M
AN
US
CR
IP
T
AC
CE
PT
ED
Optics, Cambridge, UK). EDS data were collected using an EDAX detector and
analysed using EDAX Team software.
3. Results and discussion
3.1 Ion infiltration into zeolite powders
3.1.1 Ion behaviour during infiltration
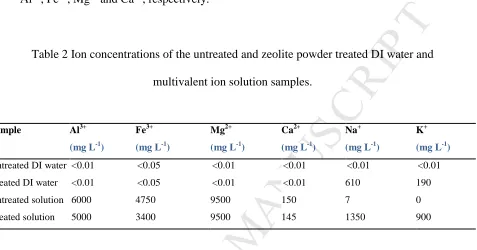
Table 2 shows the concentration of cations present in the supernatant after mixing the
ion solution with MFI-type zeolite powder. The concentrations after mixing the zeolite
with DI water are presented first in Table 2 for comparison. DI water picked up K+ and
Na+ from the zeolite, most likely due to the presence of residual K+ and Na+ from zeolite
powder sample preparation as NaOH and template TPAOH (which contains K+) were
used in the synthesis solution [28]. Upon exposure of the zeolite to the ion solution, the
‘Treated solution’ results show dynamic behaviour of the trivalent (Al3+ and Fe3+) and
monovalent (K+ and Na+) cations, while divalent cations (Mg2+ and Ca2+) showed little
change compared to the original ‘Untreated solution’. The results showed a large
increase in K+ and Na+ in the supernatants, while there was a significant reduction in Fe3+ and Al3+. The increase in K+ and Na+ from the zeolite powder may be due to
exchange with Fe3+ and Al3+. Release of K+ and Na+ and uptake of divalent ions Mg2+
and Ca2+ by MFI-type zeolites when exposed to seawater have been observed in
previous studies [28, 29]. In the present work, it was observed that K+ and Na+
M
AN
US
CR
IP
T
AC
CE
PT
ED
that K+ and Na+ in MFI-type zeolitesexchange in preference with trivalent ions when both trivalent and divalent cations are present in the solution. From Table 2, the
percentage of relative adsorbed cations was estimated to be 42%, 57%, 0% and 0.2% for
Al3+, Fe3+, Mg2+ and Ca2+, respectively.
Table 2 Ion concentrations of the untreated and zeolite powder treated DI water and
multivalent ion solution samples.
Sample Al3+
(mg L-1)
Fe3+
(mg L-1)
Mg2+
(mg L-1)
Ca2+
(mg L-1)
Na+
(mg L-1)
K+
(mg L-1)
Untreated DI water Treated DI water Untreated solution Treated solution <0.01 <0.01 6000 5000 <0.05 <0.05 4750 3400 <0.01 <0.01 9500 9500 <0.01 <0.01 150 145 <0.01 610 7 1350 <0.01 190 0 900
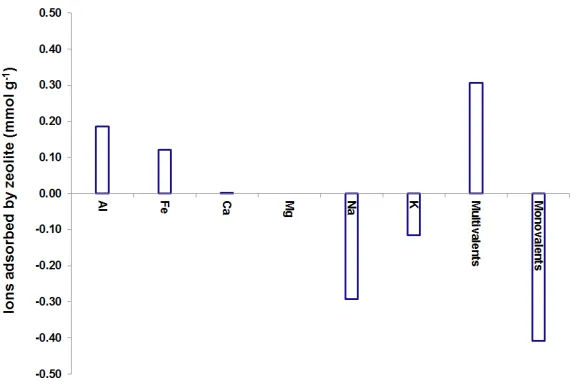
Figure 1 shows the adsorption of major cations from the ion solution when exposed to
the MFI-type zeolite powder in terms of their molar quantity normalised to the weight
of the zeolite according to Equation 1. The amount of K+ (0.11 mmolg-1) and Na+ (0.29 mmolg-1) released was close to that previous reported for MFI-type zeolite with high Si/Al ratios (up to 0.08 mmolg-1 for K+ and 0.26 mmolg-1 for Na+) after exposure to
seawater [29]. The results showed that the total released monovalent ions (K+ and Na+)
was slightly higher than the total adsorbed amount of multivalents (e.g. Al3+ and Fe3+)
(molar ratio of monovalents and multivalents ~1.3), suggesting a physical adsorption
M
AN
US
CR
IP
T
AC
CE
PT
ED
and forming strong surface complexes within the material. The next step in this
investigation was to confirm the location of the infiltrated ions.
Fig. 1 Moles of the major cations in multivalent ion solution adsorbed after 48 h
exposure to zeolites.
It is well known that MFI-type zeolites have an intrinsic pore size of 0.54–0.56 nm
[19, 41-43]; but smallerintrinsic pores (e.g. ~0.3 nm), micropores of 1.1–1.2 nm and
mesopores > 2.5 nm have also been measured by positron annihilation lifetime
spectroscopy (PALS)[28, 29]. Micropores of size between 1 nm and 2.5 nm have been
previously detected in silicalite-1 by n-hexane porosimetry [44].As mentioned earlier,
the kinetic diameter of water (0.276 nm, Table 1) is smaller than the intrinsic pore size
(e.g. 0.54–0.56 nm) of MFI-type zeolites, so water molecules should be able to
physically enter and exit the intrinsic pores. The size of hydrated ions (e.g. K+
0.662 nm, Na+ 0.716 nm, Fe3+ 0.914 nm, Al3+ 0.950 nm) as shown inTable 1 are larger
than the intrinsic pore size (e.g. 0.54–0.56 nm) but smaller than measured micropore
M
AN
US
CR
IP
T
AC
CE
PT
ED
adsorption and exchange observed due to exposure to multivalent ion solution (Table 2
and Fig. 1) is likely occurring in the 1–2.5 nm micropores and >2.5 nm mesopores.
Despite this, molecular dynamics simulation has shown that hydrated Na+ can enter the
intrinsic pores of MFI-type zeolite, but is hindered by the restricted diffusion of the
counter ion Cl- which is repelled by the negatively charged zeolite surface [34]. This is
supported by experimental data which shows Na+ and K+ diffusion through an MFI-type
zeolite membrane upon increase in temperature, explained by the potential widening of
the intrinsic pores and/or reduction in size of the hydrated ions enabling diffusion of
Na+, K+ and Cl- [25]. Regardless, Fe3+ and Al3+ are too large to enter the intrinsic pores, so their significant uptake into the zeolite must have occurred within the larger defect
pores.
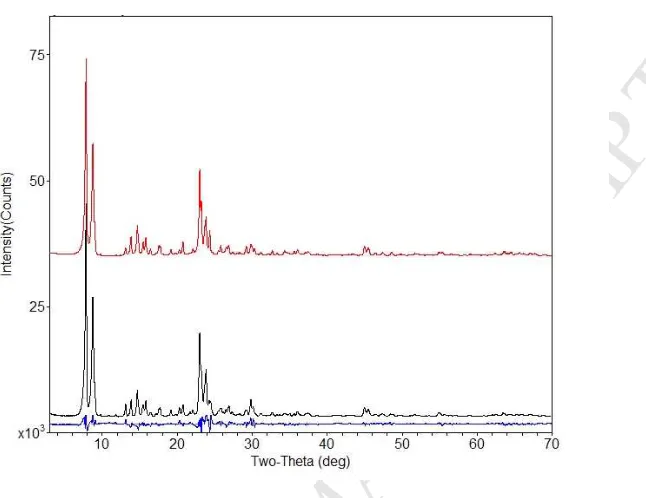
3.1.2 XRD and structure refinement
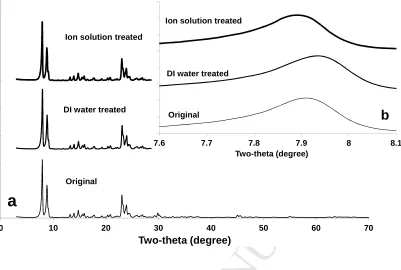
The XRD patterns (Fig. 2) taken at wavelength of 1.54 Å (CuKα radiation) for the
zeolite samples showed a typical MFI-type framework with 2θ around 7.9º, 8.8º, 14.7º,
23.0º, 23.9º and 29.8º for the major peaks ‘101’, ‘200’, ‘301’, ‘501’, ‘303’ and ‘503’,
respectively [20, 29, 43]. It was found thatthe powder samples treated by DI water and
multivalent ion solution had the same MFI pattern fingerprint to the original MFI-type
zeolite (Fig. 2a), but a slight shift in the most intense Bragg peak (101) was observed in
the zeolite samples exposed to DI water and ion solution (Fig. 2b inset). This implies a
M
AN
US
CR
IP
T
AC
CE
PT
ED
Fig. 2 XRD patterns taken at wavelength of 1.54 Å (CuKα radiation) (a) and differences in
the most intense Bragg peak (101) between the zeolite samples.
The fitting patterns of the original MFI-type zeolite powder sample from Rietveld
structural refinement are shown in Supplemental Material Figure S1, which confirmed
effectiveness of the Rietveld refinement. The unit-cell parameters and volume from
Rietveld structural refinement for the MFI-type zeolite powder samples are given in
Table 3 and the changes in unit-cell parameters are shown in Figure 3. The unit-cell
parameters (a = 2.0044 nm, b = 1.9826 nm, and c = 1.3358 nm) obtained in this study
for the original zeolite powder are close to those determined by Van Koningsveld et al
(a = 2.0022 nm, b = 1.9899 nm, and c = 1.3383 nm) [45] and Olsenet al (a = 2.007 nm,
b = 1.992 nm, and c = 1.342 nm) [46] using the same space group Pnma. The structure
determined by Van Koningsveld and co-workers [45] is believed to be more accurate
and has been used for a thermodynamic study of water intrusion in silicalite by Monte
Carlo simulations [47].
0 10 20 30 40 50 60 70
Two-theta (degree)
Original
Ion solution treated
DI water treated
a
7.6 7.7 7.8 7.9 8 8.1
Two-theta (degree) Original
Ion solution treated
DI water treated
M
AN
US
CR
IP
T
AC
CE
PT
ED
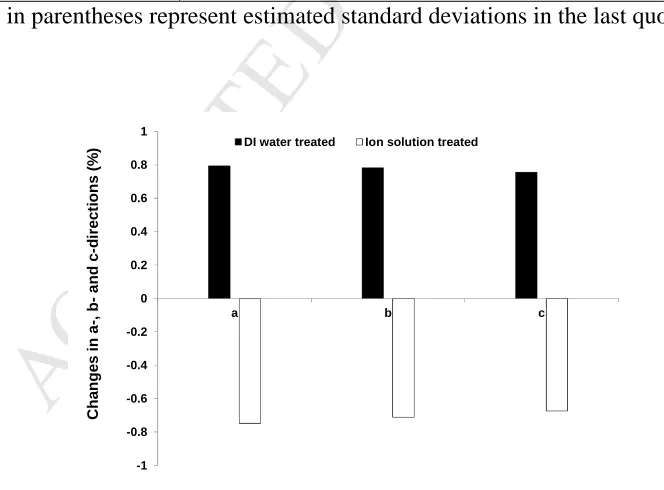
The unit-cell parameters and volume of the MFI-type zeolite sample increased after
48 h exposure to DI water compared to the original sample. Unit-cell dimension in a-, b-
and c-directions changed 0.79%, 0.78% and 0.76% respectively (Fig. 3) for the zeolite
sample exposed to DI water, indicating that expansion occurred in the lattice structure
of MFI-type zeolite. Lattice expansion has also been observed in MFI-type zeolites due
to exposure to pure water [48] or KCl solution (e.g. 0.05 M) [28]. While the unit-cell
dimensions became smaller (Table 3), with a change of -0.75%, -0.71% and -0.67% in
a-, b- and c-directions respectively (Fig. 3), after 48 h exposure of the MFI-type zeolite
sample to ion solution compared to the original sample. This result indicates that
shrinkage occurred in the lattice structure after infiltration of the trivalent ions (and
departure of the monovalent ions). Typically, crystals expand in the presence of ions
[49], which makes the observation of contraction for the multivalent ion solution
exposed zeolites an unusual finding. However, crystal contraction has been observed for
zeolites when undergoing dehydration and it was concluded that the presence of ions is
responsible for significant deformation of the native zeolite framework upon
dehydration [50]. Our material has undergone the opposite treatment. During synthesis,
zeolites with Na+ from NaOH used in synthesis and K+ from synthesis impurities (found
in TPAOH) contracted during calcination to remove the template. Upon ‘conditioning’
in DI water, the crystal relaxed and expanded upon rehydration with water despite the
departure of Na+ and K+ as observed in Table 3. Meanwhile with the exposure of the same zeolite material to the ion mixture, the crystals conformed to equilibrium and
contracted relative to their deformed state from synthesis to achieve this more relaxed
M
AN
US
CR
IP
T
AC
CE
PT
ED
[29]. While it is not possible to confirm with the present data, uniquely in this case the
infiltration of trivalent ions into the defects and enhanced removal of monovalent ions
compared to DI water exposure (likely from the intrinsic zeolite pores) led to this more
contracted crystal.
Table 3 Unit-cell parameters (nm) and volume (nm3) of the MFI-type zeolite powders
before and after exposure to DI water and multivalent ion solution
MFI-type zeolite a b c V
Original
DI Water treated
Multivalent ion solution
treated
2.0044(8) 1.9826(8) 1.3358(5) 5.3083
2.0203(8) 1.9981(8) 1.3459(6) 5.4330
1.9894(8) 1.9685(7) 1.3268(5) 5.1959
*Values in parentheses represent estimated standard deviations in the last quoted place.
Fig. 3 Unit-cell dimension changes in a-, b- and c-directions after exposure to DI water or
multivalent ion solution. -1 -0.8 -0.6 -0.4 -0.2 0 0.2 0.4 0.6 0.8 1
a b c
C h a n g e s i n a -, b -a n d c -d ir e c ti o n s ( %
M
AN
US
CR
IP
T
AC
CE
PT
ED
3.1.3 N2 porosimetry
The adsorption isotherms of N2 at 77 K for theMFI-type zeolite powders shown in
Figure 4 can be classified as type-IV [51] with jump in adsorption at a relative pressure
P/P0 of around 0.2 due to adsorption hysteresis observed in the desorption branch (not
shown). The hysteresis loop is due to capillary condensation within mesopores [52].
The uptake of nitrogen at low relative pressures (P/P0 < 0.2)is due to micropore filling
[41, 53]. The samples are, therefore, microporous in nature with a contribution from
mesopores consistent with the hierarchical structure of zeolites discussed earlier related
to intrinsic and defect pores.
Fig. 4 Adsorption isotherms of N2 for the original and DI water or multivalent ion solution
treated MFI-type zeolite powders at 77 K.
70 80 90 100 110 120 130 140 150 160 170
0 0.2 0.4 0.6 0.8 1
V o lu m e a d s o rb e d ( c m 3g -1 S T P )
Relative pressure (P/P0)
Original
DI water treated
M
AN
US
CR
IP
T
AC
CE
PT
ED
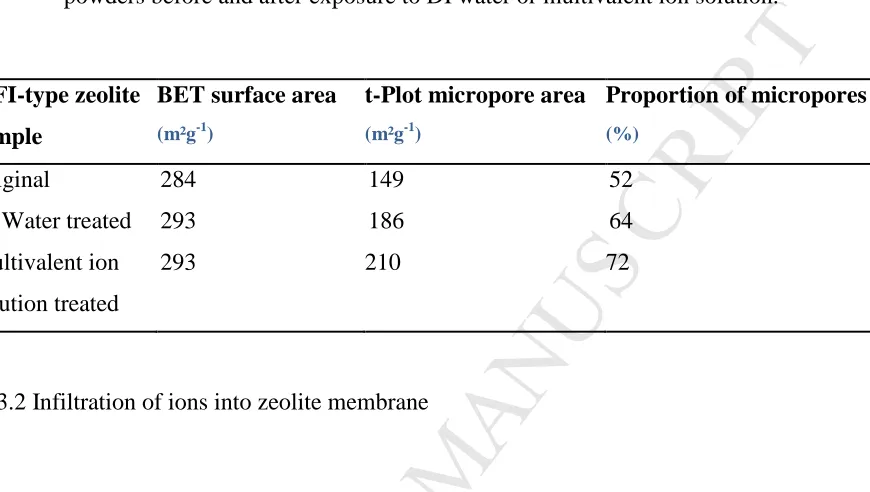
Table 4 compares the changes in BET surface area, t-Plot micropore area and
micropore fraction (as measured by N2 adsorption t-plot analysis relative to BET total
area) of the MFI-type zeolite powder samples before and after exposure to DI water or
multivalent ion solution. The BET surface area measured for the original MFI-type
zeolite (284 m²g-1) is slightly smaller than that previous reported (~300–330 m²g-1) [54,
55]. However, the difference between this measured and the reported is in a reasonable
range. This difference is likely to be due to the different synthesis conditions performed
within different laboratories. It can be seen that only a slight increase in BET surface
area was observed for the DI water and ion solution treated MFI-type zeolite powder
samples when compared to that of the original MFI-type zeolite. However, there was a
significant increase in proportion of micropores after exposure of the MFI-type zeolite
powder to DI water or ion solution. This may be due to effects observed above, where
both DI water and ion solution exposure led to the departure of monovalent cations
from the zeolite that opened up the smaller pore spaces giving the observed increase in
micropore proportion. The DI water isotherm appeared to shift uniformly upwards
indicating opening of the smallest micropores measured by the first adsorption data
point, which added uniformly to all other points on the isotherm. While this increase
also occurred for the ion solution exposed zeolite, there was a proportional decline at
P/P0 around 0.4 indicating closure of larger pores, which could be explained by the
release of monovalent ions which was in turn accompanied by adsorption of larger
multivalent ions that effectively ‘closed’ the larger micropores. It is possible that large
Al3+ and Fe3+ ions might physically occupy the mesoporous space, thus reducing the mesopore proportion while the departed monovalent ions led to increasing the relative
M
AN
US
CR
IP
T
AC
CE
PT
ED
Table 4 N2 adsorption measured BET surface area, t-Plot micropore area andproportion
of micropores (t-Plot micropore area×100/ BET surface area) of the MFI-type zeolite
powders before and after exposure to DI water or multivalent ion solution.
MFI-type zeolite
sample
BET surface area
(m²g-1)
t-Plot micropore area
(m²g-1)
Proportion of micropores
(%)
Original
DI Water treated
Multivalent ion
solution treated
284
293
293
149
186
210
52
64
72
3.2 Infiltration of ions into zeolite membrane
Prior to the ion infiltration test, the membrane was first confirmed as having a zeolite
coating by measuring rejection of NaCl solution (3,000 mgL-1 TDS). The membrane
showed an average salt rejection of 31% with a flux of 2 Lm-2h-1 measured at 7 MPa pressure drop. This is lower than that expected for zeolite desalination membranes,
where >90% salt rejections are expected [12, 25], but shows an intact zeolite coating
with some non-selective water flux through defects. This membrane is suitable for
investigating ion infiltration.
After testing with NaCl solution, the membrane was flushed with DI water and then
fed with the ion solution at 7 MPa and 21°C for 8 hours of similar composition to the
M
AN
US
CR
IP
T
AC
CE
PT
ED
rejections for the major ions at 99% for Fe3+, 83% for Al3+, 87% for Mg2+, 48% for Ca2+
and 80% for SO42-. These rejections are higher than NaCl as expected as they are all
larger ions in hydrated form as shown in Table 1. It is noted that every ion was
detectable in the permeate, including Fe3+, highlighting that all ions had infiltrated through the zeolite film.
3.2.1 Gas permeation testing of ion infiltrated zeolite membrane
Table 5 shows the permeation of single gas (He or N2) measured for the bare α-Al2O3
support, the prepared membrane and the ion infiltrated zeolite membrane. The
permeance of He or N2 for the prepared membrane was two orders of magnitude lower
than that of the bare tube, indicating a rate limiting zeolite layer was formed on the
surface of the support. The N2 permeance (3.3×10⁻⁷ mol m-2 s-1 Pa-1) measured for the
MFI-type zeolite membrane prepared in this work displayed a similar value to those
previously prepared in our laboratory by the same seeded secondary growth method
(~3.7×10⁻⁷ mol m-2 s-1 Pa-1) [2] and that reported in the literature (~3.0×10⁻⁷ mol m-2 s-1 Pa-1) [56], but was larger than that prepared by the in-situ method (~0.2×10⁻⁷ mol m-2 s-1 Pa-1) [25]. Interestingly the ion infiltrated membrane N2 permeance was closer to this
value, being an order of magnitude smaller than the as synthesised membrane. Clearly
infiltration of ions has blocked gas permeation channels in the membrane. While this is
a positive sign towards defect blocking, it did not lead to increased He/N2
permselectivity (permeance ratio between He and N2) where the value remained
unchanged compared to the original membrane, and was smaller than reported by
M
AN
US
CR
IP
T
AC
CE
PT
ED
N2 (kinetic diameter 0.36 nm) is not expected in the intrinsic pores (0.56 nm) of zeolite
since both gases are smaller than the zeolite pore channels, but Knudsen ideal selectivity
of at least 2.6 could be expected. While our application of single gas permeation gave us
the ability to rapidly assess the membrane film intactness, we are aware that the
permeation test of single gases (He or N2) can only provide information on the change
in gas flow resistance through the membrane, and does not assist in understanding
changes to the selective structure. Direct measurement of the pore morphology of the
membrane film using techniques such as evaporporometry and nano-permporometry
would give a better understanding of the pore size. If there is any benefit of infiltrating
the zeolite with the ions to gas or vapour separation, a dedicated study on these
applications would be required. However, this work will consider the practical benefits
to rejection of salts in saline solutions. For water separation the hydrated ions are larger
than the intrinsic zeolite pore channels, so their rejection can be affected by blocking of
larger mesoporous defects.
Table 5 Permeation of He and N2 for the bare α-Al2O3 support and prepared
zeolite membrane after drying at 100 °C in air for 1 h, and ion infiltrated
membrane dried overnight at 100 °C.
Sample He permeation
(10-7 mol m-2 s-1 Pa-1)
N2 permeation
(10-7mol m-2 s-1 Pa-1)
He/N2
permselectivity
Bare tube 1120 745 1.5
Membrane 4.1 3.3 1.2
M
AN
US
CR
IP
T
AC
CE
PT
ED
3.2.2 Binding strength of ions infiltrated in zeolite membrane
The strength of the association of the ions infiltrated into the zeolite membrane was
measured by attempting to remove them with acid solution and water. To do this, the
membrane was flushed with DI water and then fed with 1 M HCl solution at an applied
pressure of 7 MPa and 21 ºC followed by DI water flushing under the same conditions.
Figure 5 shows the initial DI water flux and the water flux measured for each DI water
permeate (total 3 times, 30 min for each permeation) after 1 M HCl cleaning. The
average DI water flux at an applied pressure of 7 MPa and 21 ºC after the HCl (1 M
solution) clean was 1.2 L m-2 h-1, which was much smaller than that from the initial DI
water testing of 5.6 L m-2 h-1. This indicates that the water flux was not fully recovered
after permeating the acid solution consistent with tight binding of cations in the zeolite
membrane.
Fig. 5 Comparison of DI water flux measured from each DI water permeate after 1 M HCl
cleaning and the initial DI water flux value, applied pressure = 7 MPa. 0.0
1.0 2.0 3.0 4.0 5.0 6.0
Initial 1st DI water
permeate
2nd DI water permeate
3rd DI water permeate
F
lu
x
(
L
m
M
AN
US
CR
IP
T
AC
CE
PT
ED
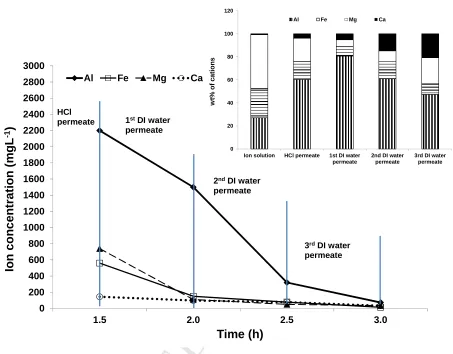
To further analyse the composition of the ions that may have been removed from the
acid treatment, the permeated liquids from 1 M HCl cleaning (HCl permeate) and DI
water flushing (1st, 2nd and 3rd DI water permeate) under 7 MPa and 21 ºC were analysed by ICP-OES. Figure 6 shows the ion concentrations measured for Fe3+, Al3+,
Ca2+and Mg2+ in each permeate sample over time. Table 6 compares the absolute
amount of the cations (Fe3+, Al3+, Ca2+and Mg2+) removed from the multivalent ion solution tested membrane by HCl (1 M solution) cleaning and DI water flushing with
those adsorbed by zeolite material in ion infiltration experiments. In order to highlight
the relative proportions removed with HCl cleaning and repeated DI water permeation,
the concentrations of Fe3+, Al3+, Ca2+ and Mg2+ were also expressed as weight percentage of the total amount of only these ions in one permeate (Fig. 6 inset). The
proportions of the cations in the pre-filtered multivalent ion-rich feed solution were also
included in Figure 6 (inset) for comparison. The results (Fig. 6 inset) showed a
relatively larger proportion of Al3+ present in the permeate samples from all the cleaning steps. Fe3+ and Mg2+ were consistently lower in proportion to what was
originally fed. Ca2+ measured for the permeate samples was proportionately high
M
AN
US
CR
IP
T
AC
CE
PT
ED
Fig. 6 Concentrations of cations (Fe3+, Al3+, Ca2+and Mg2+) measured for each permeate
sample over time, and calculated proportions of the cations for the pre-filtered
multivalent ion feed solution and the permeate samples (inset). 0 200 400 600 800 1000 1200 1400 1600 1800 2000 2200 2400 2600 2800 3000
1.5 2.0 2.5 3.0
Io n co n c e n tr a tio n ( m g L -1) Time (h)
Al Fe Mg Ca
1stDI water
permeate HCl
permeate
3rdDI water
permeate 2ndDI water
permeate 0 20 40 60 80 100 120
Ion solution HCl permeate 1st DI water permeate
2nd DI water permeate
3rd DI water permeate w t% o f c a ti o n s
M
AN
US
CR
IP
T
AC
CE
PT
ED
Table 6 Amount of the cations (Fe3+, Al3+, Ca2+and Mg2+) adsorbed by zeolite material in ion infiltration experiments, and removed from the multivalent ion solution tested
membrane by 1 M HCl cleaning (HCl permeate) and DI water flushing (1st, 2nd and 3rd
DI water permeate).
Sample Al3+ (mmol) Fe3+ (mmol) Mg2+ (mmol) Ca2+ (mmol) HCl permeate
1st DI waterpermeate
2nd DI waterpermeate
3rd DI waterpermeate
Total removed from membrane
Adsorbed by zeolite powder
0.0358 0.0422 0.0116 0.0024 0.0921 0.1852 0.0044 0.0021 0.0014 0.0002 0.0081 0.1214 0.0134 0.0034 0.0020 0.0013 0.0201 0.0001 0.0016 0.0019 0.0019 0.0007 0.0061 0.0006
It appears that Al3+ and Ca2+ were released more in proportion from the zeolite compared to all other cations, even when cleaning with HCl that would remove more
tightly bound ions (Fig. 6 inset). Ca2+ and Mg2+ can be regarded as not having a major
role in the structure compared to the other ions, as only a very small amount was taken
up by the zeolite according to powder infiltration study (Table 6). The interactions
appear to be mostly controlled by Al3+ and Fe3+ as far greater quantities (Table 6) were
taken up by the zeolite observed in the powder infiltration study. Fe3+ was
proportionately lower in the permeates than Al3+ (Fig. 6 inset) and removed 10 time less
from the membrane compared to Al3+ but showed the highest total amount (similar level
to Al3+)adsorbed in zeolite material in ion infiltration experiments (Table 6). Therefore,
we conclude that Fe3+has made the strongest association into the zeolite and cannot be
M
AN
US
CR
IP
T
AC
CE
PT
ED
multivalent and having higher charge density may bind more strongly into zeolite
material initially, but interestingly only Fe3+ is not easily removed during HCl cleaning
and DI water flushing, which implies it is the primary component responsible for rigid
ion blocking of the membrane pores. It may be able to infiltrate and associate into more
pores as it is smaller than Al3+ in hydrated form (Table 1). A trend of increasing proportion of Ca2+ present in the permeate samples (Fig. 6 inset) reveals another
interesting finding, where although little Ca2+ was taken up into the zeolite (Table 6) its
presence by proportion increases as the Al3+ is eventually washed out. Apart from the interactions between cations and zeolite material, SO42- as the most dominant anion in
our system might have also contributed the membrane pore blocking effect due to its
significant size of 0.758 nm (Table 1). It was measured in the permeate from the HCl
cleaning at 6,600 mg L-1 and the 1st DI water flushing at 3,120 mg L-1, logically being
the counter ion for the cations released.
Elemental analysis (Table 7) was also conducted by EDS on the zeolite membrane
surface before and after ion infiltration test. It should be noted that the membrane being
analysed by EDS was subjected to HCl solution and DI water permeation after the ion
infiltration test. Therefore, the detection of ions after the ion infiltration test and acid
and DI water cleaning indicates that the loosely bound ions were rinsed away, leaving
only ions that were tightly bound with the zeolite structure. As shown in Table 7, Fe, Al
and S were present in higher concentrations at the membrane surface after exposure to
the multivalent ion solution. This confirmed that zeolites strongly interacted with ions
present in ion solution during ion infiltration and the ions have penetrated into the
M
AN
US
CR
IP
T
AC
CE
PT
ED
also showed an overall reduction in Siproportion, indicating that the major ions from
the ion solution were making up a larger proportion of the material. The other major
ions (Mg2+ and Ca2+) present in the ion solution were not detected within the exposed zeolite membrane. These results support the conclusions of the ion infiltration/acid
solution and water leaching study, where Fe3+ was the most strongly incorporated and
responsible for the pore blocking, while Ca2+ and Mg2+ did not have a major role in the
zeolite structure. However, reasonably high amount of Al3+ was still present suggesting
it has not been completely removed by acid cleaning and DI water flushing.
Table 7 EDS measured element contents on the zeolite membrane surface before and
after exposure to the multivalent ion solution.
Element Weight percentage
before exposure
Weight percentage after
M
AN
US
CR
IP
T
AC
CE
PT
ED
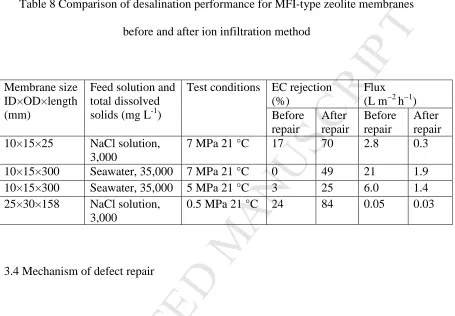
3.3 Evaluation of defect repair on zeolite membranes applied for desalination
To confirm the practical effect of the ion blocking treatment, improvement to
desalination performance by the novel infiltration method applied to four randomly
selected membranes produced in our labs was trialled. These membranes were taken
from a set that showed at least a two orders of magnitude gas permeation ensuring that a
zeolite layer had been formed and thus would be performance limited by defects within
the zeolite film. The results are shown in Table 8. Various sizes of substrates were
included in the trial, all coated with zeolite prepared by the same technique of seed
rubbing and secondary growth. Here we can see that the infiltration made substantial
improvements to the ability of the membrane to resist diffusion of salt in comparison to
water (EC rejection rise). This was particularly important for the longer membranes of
300 mm length which are more prone to defect formation over the longer substrate
length. In both of these cases, infiltration yielded a membrane with much higher EC
rejection (up to 49%) from a membrane which exhibited little or no EC rejection
initially. In all cases, however, a substantial loss in flux was observed which would be
expected if the defect flow was inhibited by the blocking ions. Regardless, it appears
that infiltration of the ion solution into the zeolite membrane using a setup that is
essentially identical to simple reverse osmosis (pressurised flow) has consistently
achieved improvement to the desalination performance compare to the as synthesised
membrane. Blocking of gases was also observed (Table 5) but benefits to the more
common application of zeolite membranes to gas separation (including organic
M
AN
US
CR
IP
T
AC
CE
PT
ED
further work to fully validate this proposed infiltration technique more widely for
zeolite membrane application.
Table 8 Comparison of desalination performance for MFI-type zeolite membranes
before and after ion infiltration method
Membrane size ID×OD×length (mm)
Feed solution and total dissolved solids (mg L-1)
Test conditions EC rejection (%)
Flux (L m−2 h−1) Before
repair
After repair
Before repair
After repair
10×15×25 NaCl solution,
3,000
7 MPa 21 °C 17 70 2.8 0.3
10×15×300 Seawater, 35,000 7 MPa 21 °C 0 49 21 1.9
10×15×300 Seawater, 35,000 5 MPa 21 °C 3 25 6.0 1.4
25×30×158 NaCl solution,
3,000
0.5 MPa 21 °C 24 84 0.05 0.03
3.4 Mechanism of defect repair
Figure 7 shows a concept schematic of MFI-type zeolite membrane defect repair
mechanism based on the findings from this investigation. The prepared zeolite
membrane shows a low ion rejection and a high flux due to the existence of defect
pores. When zeolite material is exposed to ion solution containing cations Al3+, Fe3+, Ca2+ and Mg2+,it shows dynamic ion infiltration behaviour when interacting with the ions. The strong release of monovalent ions (e.g. K+, Na+) from zeolite material to
accommodate multivalent ions (e.g. Fe3+, Al3+)from the ion solution yielded more open
intrinsic pores and blockage of defect pores. The blocking of zeolite membrane defect
M
AN
US
CR
IP
T
AC
CE
PT
ED
transport through the zeolite cage governs separation, and zeolite pores are opened
while grain boundaries are sealed. The strength of binding of Fe3+ into these grain boundaries appears to resist repetitive cleaning by acid and DI water suggesting a
method for robust defect repair.
Fig. 7 Schematic illustration of ion interactions during zeolite exposure to ion solution
containing cations Al3+, Fe3+, Ca2+ and Mg2+.
The means by which the ions firmly anchor within the structure relates to the
association of the ions with the zeolite surface. The ideal silicalite used in this work is
not regarded as having sites for ion exchange due to the absence of alumina [29, 57], so
ion co-ordination to the surface must be due to the silica surface physical and chemical
properties. It is known that silanol groups (geminal, vicinal and isolated silanols) can
M
AN
US
CR
IP
T
AC
CE
PT
ED
(OH) groups are the main adsorption centres when interacting with the adsorbates [58,
59]. Similar to silica, Si–OH groups can also form either on the external surface of
silicalite or within the zeolite lattice by adsorption of water molecules [60]. Ion
adsorption can modify the surface, and the competition for adsorption sites by hydrated
ion is governed by the relative degree of hydration, the size of the ion, the ion’s valency
and indeed the surface sites of attraction on the zeolite including the various
arrangements of silanol groups [59]. The mechanism of ion association with the silica
surface has been proposed according to [61]:
Si-OH + (H2O)xMy+ Si-OM(y-1)+(H2O)x-1 + H2O + H+ (4)
where x is the number of water molecules associated with the metal ion, M, and y is the
ion valency. This may be considered as the key association mechanism where no
organic molecules are present. Ions with higher valency can associate with more sites
enabling strong complexes to be formed, where adsorption of specific ions is dependent
on the geometry of the co-ordination bonds that can be formed. It was also pointed out
that adsorption of polybasic ions is essentially irreversible [61, 62], and chelation could
involve surface silanol groups replacing water molecules from the metal ion as follows:
M
AN
US
CR
IP
T
AC
CE
PT
ED
At pH of 2 and lower, certain polyvalent cations are strongly adsorbed on the silica
surface, including Al3+ and Fe3+. Further, it has been identified that these ions have a
greater tendency to form covalent bonds compared to the other ions in the solution Ca2+,
Mg2+, K+ and Na+ [63]. Therefore according to the research on ion interactions with silica surfaces, the procedure adopted to infiltrate the ions at pH 2 appears to have been
a key part in favouring strong chelating behaviour of Al3+ and Fe3+ to the silicalite surface [61, 64]. Impurities need also to be considered, where it is known that Na and K
impurities coming from zeolite synthesis (alkaline medium and template), or Al coming
from the zeolite growth on the membrane (from Al2O3 support) [18, 36, 37]. These can
be present also within the final zeolite. Na or K can take place of the silanol protons
according to Equation 4, but when zeolite material is exposed to ion solution containing
multivalent cations Al3+, Fe3+, Ca2+ and Mg2+, the K+ and Na+ impurities inside the zeolite material were replaced by the multivalent ions (e.g. Fe3+, Al3+) due to their strong chelating capacity. The contamination from Al in the substrate of membranes
can form isomorphic tetrahedral with an extra negative valence yielding a much
stronger cation exchange capacity for the zeolite [58] which is well known for
aluminosilicate zeolites including ZSM-5 [29, 65]. However this behaviour is not
considered significant as the presence of Al in the original zeolite membrane was minor
in comparison to Si according to EDS results (Table 7), and therefore the strong
M
AN
US
CR
IP
T
AC
CE
PT
ED
4. Conclusion
This work investigated the role of multivalent ions for repairing defects in zeolite
membrane films by first exploring the uptake of multivalent ions Fe3+, Al3+, Ca2+ and Mg2+ into MFI-type zeolite powders, followed by infiltrating the ions into a MFI-type zeolite membrane fabricated by the seeded secondary growth method. The change to
crystal structure (shrinkage in the lattice) and the porous property (increase in
proportion of micropores) as a result of the strong ion uptake was observed by XRD and
N2 porosimetry. This confirmed that the adsorbed trivalent ions exclusively occupied
the larger microporous (grain boundaries) while the intrinsic pores of MFI-type zeolites
become more open due to departed monovalent ions. The unique ion blocking effect,
particularly for the irreversibly adsorbed Fe3+ as observed from acid and water leaching
experiments, was verified on four membranes. These included scaled up membranes
which would be more prone to defects due to their larger surface area. The technique
could be utilised as a useful defect repair technique for zeolite membranes more widely.
Acknowledgment
This research was funded by the Australian Research Council through a Linkage
Project (LP100200242), Chosun Refractories Co. Ltd. (Republic of Korea) and C.I.
Ceramics (Aust.) Pty. Ltd.The authorswould like to thank Dr Yong-Han Na (Chosun
Refractories Co. Ltd.) and Mr Takanori Oishi (C.I. Ceramics (Aust.) Pty. Ltd.) for their
M
AN
US
CR
IP
T
AC
CE
PT
ED
References:
[1] T. Humplik, J. Lee, S.C. O’Hern, B.A. Fellman, M.A. Baig, S.F. Hassan, M.A.
Atieh, F. Rahman, T. Laoui, R. Karnik, E.N. Wang, Nanostructured materials for water
desalination, Nanotechnology, 22 (2011) 292001.
[2] B. Zhu, D.T. Myat, J.-W. Shin, Y.-H. Na, I.-S. Moon, G. Connor, S. Maeda, G.
Morris, S. Gray, M. Duke, Application of robust MFI-type zeolite membrane for
desalination of saline wastewater, J. Membr. Sci., 475 (2015) 167-174.
[3] M. Duke, B. Zhu, C.M. Doherty, M. Hill, A.J. Hill, M.A. Carreon, Structural effects
on SAPO-34 and ZIF-8 materials exposed to seawater solutions, and their potential as
desalination membranes, Desalination, 377 (2016) 128–137.
[4] W.B. Samuel de Lint, T. Zivkovic, N.E. Benes, H.J.M. Bouwmeester, D.H.A.
Blank, Electrolyte retention of supported bi-layered nanofiltration membranes, J.
Membr. Sci., 277 (2006) 18-27.
[5] M.C. Duke, S. Mee, J.C. Diniz da Costa, Performance of porous inorganic
membranes in non-osmotic desalination, Water Res., 41 (2007) 3998-4004.
[6] R. Xu, J. Wang, M. Kanezashi, T. Yoshioka, T. Tsuru, Development of robust
organosilica membranes for reverse osmosis, Langmuir, 27 (2011) 13996-13999.
[7] A. Ikeda, E. Matsuyama, M. Komatsuzaki, M. Sasaki, M. Nomura, Development of
inorganic silica reverse osmosis membranes by using a counter-diffusion chemical
vapor deposition method, J. Chem. Eng. Jpn., 47 (2014) 574-578.
[8] M.C. Duke, J. O'Brien-Abraham, N. Milne, B. Zhu, J.Y.S. Lin, J.C. Diniz da Costa,
Seawater desalination performance of MFI type membranes made by secondary growth,
M
AN
US
CR
IP
T
AC
CE
PT
ED
[9] L. Li, J. Dong, T.M. Nenoff, R. Lee, Reverse osmosis of ionic aqueous solutions on
aMFI zeolite membrane, Desalination, 170 (2004) 309-316.
[10] L. Li, J. Dong, T.M. Nenoff, R. Lee, Desalination by reverse osmosis using MFI
zeolite membranes, J. Membr. Sci., 243 (2004) 401-404.
[11] L. Li, N. Liu, B. McPherson, R. Lee, Influence of counter ions on the reverse
osmosis through MFI zeolite membranes: implications for produced water desalination,
Desalination, 228 (2008) 217-225.
[12] N. Liu, L. Li, B. McPherson, R. Lee, Removal of organics from produced water by
reverse osmosis using MFI-type zeolite membranes, J. Membr. Sci., 325 (2008)
357-361.
[13] L. Li, J. Dong, T.M. Nenoff, Transport of water and alkali metal ions through MFI
zeolite membranes during reverse osmosis, Sep. Purif. Technol., 53 (2007) 42-48.
[14] Y. Deng, C. Deng, D. Qi, C. Liu, J. Liu, X. Zhang, D. Zhao, Synthesis of
Core/Shell Colloidal Magnetic Zeolite Microspheres for the Immobilization of Trypsin,
Adv. Mater., 21 (2009) 1377-1382.
[15] D.J. Doocey, P.N. Sharratt, C.S. Cundy, R.J. Plaisted, Zeolite-Mediated Advanced
Oxidation of Model Chlorinated Phenolic Aqueous Waste: Part 2: Solid Phase
Catalysis, Process Saf. Environ. Prot., 82 (2004) 359-364.
[16] W. Wang, M. Zhou, Q. Mao, J. Yue, X. Wang, Novel NaY zeolite-supported
nanoscale zero-valent iron as an efficient heterogeneous Fenton catalyst, Catal.
Commun., 11 (2010) 937-941.
[17] L.X. Li, J.H. Dong, T.M. Nenoff, R. Lee, Desalination by reverse osmosis using
M
AN
US
CR
IP
T
AC
CE
PT
ED
[18] L.X. Li, J.H. Dong, T.M. Nenoff, R. Lee, Reverse osmosis of ionic aqueous
solutions on a MFI zeolite membrane, Desalination, 170 (2004) 309-316.
[19] L.X. Li, J.H. Dong, T.M. Nenoff, Transport of water and alkali metal ions through
MFI zeolite membranes during reverse osmosis, Sep. Purif. Technol., 53 (2007) 42-48.
[20] M. Duke, J. O'Brien-Abraham, N. Milne, B. Zhu, Y.S. Lin, J.C. Diniz da Costa,
Seawater desalination performance of MFI type membranes made by secondary growth,
Sep. Purif. Technol., 68 (2009) 343-350.
[21] M. Kazemimoghadam, T. Mohammadi, Synthesis of MFI zeolite membranes for
water desalination, Desalination, 206 (2007) 547-553.
[22] J. Lin, S. Murad, A computer simulation study of the separation of aqueous
solutions using thin zeolite membranes, Mol. Phys., 99 (2001) 1175-1181.
[23] C.H. Cho, K.Y. Oh, S.K. Kim, J.G. Yeo, P. Sharma, Pervaporative seawater
desalination using NaA zeolite membrane: Mechanisms of high water flux and high salt
rejection, J. Membr. Sci., 371 (2011) 226-238.
[24] B. Zhu, J.H. Kim, Y.-h. Na, I.-S. Moon, G. Connor, S. Maeda, G. Morris, S. Gray,
M. Duke, Temperature and pressure effects of desalination using a MFI-type zeolite
membrane, Membranes, 3 (2013) 155-168.
[25] B. Zhu, Z. Hong, N. Milne, C.M. Doherty, L. Zou, Y.S. Lin, A.J. Hill, X. Gu, M.
Duke, Desalination of seawater ion complexes by MFI-type zeolite membranes:
temperature and long term stability, J. Membr. Sci., 453 (2014) 126–135.
[26] M. Drobek, C. Yacou, J. Motuzas, A. Julbe, L. Ding, J.C. Diniz da Costa, Long
term pervaporation desalination of tubular MFI zeolite membranes, J. Membr. Sci.,
![Figure 4 can be classified as type-IV [51] with jump in adsorption at a relative pressure MFI-type zeolite powders shown in The uptake of nitrogen at low relative pressures (P/P[41, 53]](https://thumb-us.123doks.com/thumbv2/123dok_us/7929215.1316615/22.595.117.490.336.652/figure-classified-adsorption-relative-pressure-nitrogen-relative-pressures.webp)