1717 IJSTR©2019
Performance Analysis Of Brain Tumor Detection
Using Optimization Based Fcm Technique On Mri
Images
K. Rajesh Babu, Anishka Singal, Kandukuri Sahiti, Ch. V. S. Sai Jawahar, Syed Shameem
Abstract: Early diagnosis of brain tumour may enhance expected lifespan. When not diagnosed at the initial stages, the brain tumour shortens the life expectancy of the infected. Accompanied by several segmentation algorithms, Magnetic Resonance Imaging (MRI) has been typically used as a reliable evaluation protocol. In this paper include some of optimization-based segmentation techniques for brain tumour detection from a Magnetic Resonance (MR) image. This paper provides a comparative study about different optimization-based segmentation techniques. The comparison is done between different parameters that analyze the performance of the segmentation techniques include K-Means and FCM and some of the hybrid techniques for optimized segmentation such as clustering followed by Genetic Algorithm (GA), and clustering with Particle Swarm Optimization (PSO). For these segmentation processes to be done, first pre-process the MRI scan and then apply the further segmentation or optimization techniques to get a clearer and easily detectable tumour. We compare the results for each algorithm and find out the best and efficient method for detecting Brain Tumour from an MRI tumour. As per the performance metrics optimized based segmentation provide a very efficient output in an optimized time as compared with the without optimization of segmentation technique. This paper helps the surgeons to completely detect and diagnose the Brain Tumour without leaving any part of Tumour un-diagnosed.
Index Terms: Brain tumour; Magnetic Resonance Image; Segmentation; K-Means; Fuzzy C Means; Genetic Algorithm; Particle Swarm Optimization. —————————— ——————————
1.
INTRODUCTION
BRAIN tumour has been an abnormal brain cell proliferation. They are categorized into two levels: malignant or medium (pathogenic or cancerous) and benign or low (quasi-cancerous or non-cancerous). Researchers reported recently, about 1/3rd of brain tumors were cancerous and it had taken the rank of cancer-related deaths. Tentative diagnosis and treatment are therefore indispensable for sustainability [1]. Detailed brain tumour properties can be seen by modalities of imaging such as, magnetic resonance imaging (MRI), computed tomography (CT), ultrasonography and X-ray, allowing doctors to recognize the structure of brain tumors. MRI has been recognized as a reliable imaging modality among contemporary neuropathology techniques, being able to present good contrast and parameter variable to provide different grey rates for different tissues. MRI offers accurate brain scans and is one of the most commonly used brain tumour diagnostic methods. Treatment of patients with tumour depends on size and volume affected. It is therefore important to provide and effective therapy of infected lesions [2]. In this paper we provide a comparison between different brain tumour segmentation techniques with their hybrid optimized versions that are used for the easy and efficient identification of tumour in the
MRI scan of the brain containing tumour. Segmentation is the mechanism by which an object is partitioned into several segments in order to simplify its representation into something meaningful and easier to analyze. There are various ways in which image segmentation can be done.
2
RELATED
WORK
James Macqueen used the word ―K-Means‖ for the first time in 1967. Based on similarity criteria clustering methods can be used to segment any object into specific clusters. K-Means clustering algorithm splits the image into k- clusters on the basis of cluster similarity between pixels [3]. Fuzzy C Means (FCM) clustering was established in1973 by J.C. Dunn and improved in 1981 by J.C. Bezdek. FCM clustering algorithm is one of the most important and common clustering algorithms. At present, the FCM algorithm is being widely used in the analysis of features, pattern recognition, image processing, classifier layout, etc. Nevertheless, FCM algorithm is prone to the initialization problem and easily falls into the local minimum or saddle point on iteration. Several other techniques that are based on global optimization (e.g. genetic algorithms, simulated annealing) have been developed to solve this problem. [4] Optimizing the above techniques can give better results in an optimal time. Genetic Algorithm based FCM clustering is used in pattern recognition. This method not only optimizes the classification number, but also spot checks for the clustering center‘s global optimal solution. In GA, the possible problem field solution is considered as an individual or chromosome and each of them is encoded in the string form of character. Clustering is an effective tool for pattern recognition, but it has 2 inadequacies: One of them is the original identification number to be
determined by the individual; the other is that there is a regional limit for the clustering centre to be measured. These inadequacies can be overcome by the hybrid method of clustering and GA [5]. PSO based FCM clustering is a revolutionary extended clustering algorithm for image ______________________________
K. Rajesh Babu is currently pursuing Ph.D. program in electronics and communication engineering in KLEF deemed to be University, Country, PH-09885995375. E-mail: [email protected]
Anishka Singal is currently pursuing bachelor’s degree program in electronics and communication engineering in KLEF deemed to be University, Inidia, PH-09948620888. E-mail: [email protected]
Kandukuri Sahiti is currently pursuing bachelor’s degree program in electronics and communication engineering in KLEF deemed to be University, Inidia, PH-09100091151. E-mail: [email protected]
Ch. V. S. Sai Jawahar is currently pursuing bachelor’s degree program in electronics and communication engineering in KLEF deemed to be University, Inidia, PH-07995167789. E-mail: [email protected]
segmentation that is presented to improve external denial and increasing interference resistance of conventional clustering algorithm. In particular the cluster centers are optimally selected with the support of the PSO algorithm. This algorithm also takes spatial neighborhood information into consideration. This theistic worldview is used to optimize the cost function [6]. The main reason for using hybrid techniques like GA based FCM clustering and PSO based FCM clustering is to get an efficient segmented output of tumour and in an optimized time. All the above segmentation and optimization techniques are applied for skull stripped and de-noised magnetic resonance image of brain to detect and diagnose tumour. The paper is structured as follows: descriptions of the algorithms are provided in Section 3, some performance metrics given in section 4, finally conclusions and comments are presented in Section 5.
3 METHODOLOGY
The proposed methodology focusses on clustering of pre-processed MRI images containing brain tumour. This is done by firstly pre-processing the image by skull stripping and denoising it is using a median filter. Then K-Means and FCM techniques are applied and the obtained results are compared. Then optimization based FCM using two algorithms, namely, Genetic Algorithm and Particle Swarm Optimization are applied on the same images and then their results are compared with the unoptimized ones.
Fig. 1. Flow chart of proposed methodology.
3.1 Pre-processing
Before applying any clustering algorithm to segment the MRI images, we need to pre-process the image by extracting the brain through skull removal and de-noising it. The combination of skull stripping and de-noising is called as the
―Pre-Processing‖ of an image. This pre-processing of an MRI image is the first and important step of our algorithm. Without these steps being involved, we cannot determine and segment the tumour correctly from the MRI scan report.
3.1.1 Skull Stripping
This process separates the brain and strips the skull from the MRI input image by performing morphological operations on it. For this purpose, first, the input is converted to greyscale and then binarized. This binarized image is then eroded to compute the largest connected area and image dilation is performed and mapped to grey scale.
3.1.2 De-noising
We generally de-noise the image to remove the unnecessary data and information available in it. Here we have added salt and pepper noise and used median filter to remove it. By doing this, we ensure filtering of some other excess noises also [6].
3.2 Clustering
Clustering is the process of grouping data points in such a way that data points in the same groups are more similar to other data points in that group rather than those in other groups. Simply put, the goal is to separate groups with similar traits and assign them to clusters.
3.2.1 K-Means
It is a segmentation algorithm where groups are formed on the basis of some kind of similarity in the data. It mainly tries to reduce the sum of the squared distances between all points (Euclidean Distance) and the cluster center. Initially, the number of clusters K is chosen. Then K centroids are selected at random points and each data point is allocated to the closest centroid based on its Euclidean distance [8]. This way clusters are formed. After the formation of clusters, their actual centroids are calculated, and the new values of centroids are updated. Again assign data points to the new closest centroids. If any assignment is other than the already performed one, again compute the new centroid and repeat. Otherwise, the segmentation of the model is done [9]. For an image of m x n as resolution, the K-Means technique partitions the image k sets (Clusters) with Ck as the cluster centroids. Let
p(m,n) be input pixels to be formed into cluster. After initialization of the number of clusters to be generated, the Euclidean distance Ed between the centroid and each pixel for
each pixel of the image is calculated using the relationship as follows:
|| ( , )
||
d k
E
p m n
c
(1)Based on this calculated distance Ed , each pixel is assigned to its nearest centroid. Once all pixels are assigned the new position of centroids is calculated using the relation:
k k
k
n c m c
1
c
p m, n
k
(2)in the resulting clusters reduces drastically to a point of no error (if selected k value = number of data points n) where each data point is allotted to its own cluster to ensure maximum accuracy [8]. Computational complexity is another criterion which is to be considered during K-Means clustering. Since the technique relies on a number of data elements, number of clusters and number of iterations, for any of them being a large number (say 100,150), K-Means takes an enormous amount of computational time [9].
3.2.2 Fuzzy C Means
FCM is closely related to K-Means except for the fact that this technique allows the data points are a part of more than one cluster group instead of forcing them to be a part of a single cluster [4]. The resulting division is a fuzzy partition. Each cluster has a membership function giving the degree to which each data point belongs to a cluster. The points on the extremity of the cluster may be a part of the cluster to a much lower degree than the points closer to the centre of the cluster [10]. Here iterative search for a set of fuzzy clusters and associated cluster centers that describe the data structure. Given a fixed number of clusters, FCM divides data into fuzzy clusters by reducing the squared sum of distance (Euclidean distance) between classes[11]. Firstly, an initial fuzzy partition matrix is generated and initial cluster centers are calculated. After each iteration, the membership function‘s value and cluster centers are updated by minimizing the objective function that finds the best place for the clusters and their centers. The objective function of FCM is given by:
n c
q 2 2
ik k i
k 1 i 1
J
u
d
x , v
(3)Compute membership matrix:
2 m 1 ij
c i j
k 1
i k
1
U
x
c
x
c
,where m>1,c cluster‘s No.
(4)
Calculate the clusters centers:
n m i i 1
n m
i 1
U ij*x
C
U ij
(5)The process aborts if the maximum number of iterations are completed or the objective function has been optimized as per specifications. In this two parameters, membership degree and cluster centers are changed iteratively at a time. As the number of clusters is not specified, (like in K-Means) the number of clusters is displayed at the end which is generally approximated to the number of iterations [12]. FCM is advantageous in the sense that it can retain much more information from the original image. Thanks to this versatility, FCM is considered to be stronger than K-Means. However, it has its own share of drawbacks namely, computational complexity and also the fact that the performance of the
algorithm is dramatically degraded due to increased noise. Also computational time for K-Means and FCM cannot be used as a factor for comparison, because depending on that parameter depends on the input image [4].
3.3 Optimization
3.3.1 Genetic Algorithm based FCM Clustering
Genetic algorithm is commonly used to generate performance rich and highly optimized solutions to search problems using bio-inspired operators such as mutations, crossovers and selections. Genetic algorithm is an inherently motivated meta-heuristic algorithm. Every solution is represented as a chromosome in GA and each chromosome is composed of genes. The best solution applied will be applied to the next iteration while rejecting the wrong solutions. We recommend a classification algorithm to avoid the local minimum and then to lead the object towards a more neutral solution [5].
Initial-Population:
Here, the population growth and procedure of identifying individuals are of primary importance. From several empirical points of view, the population size was considered, but the underlying idea is always that reliability and effectiveness are binding [13].
Fitness function:
The purpose of fitness considered is:
n c m 2m ik ik
k 1 i 1
J
U, V
(U ) (d )
(6)Selection:
We can now select from our population compatible chromosomes and can matt and create their off springs. General idea is that the appropriate chromosomes should be chosen and allowed to produce off-spring. But that would lead to chromosomes in a m=number of next generations that are similar to each other, and therefore less diversity.
Crossover:
So we've picked parent chromosomes in this previous step tha t will generate offsprings.Crossover, thus, is nothing but repro duction in biological terms.
Let Rc be the rate of crossover,
Build a Nc random number,
If (Rc>Nc) then randomly select 2 Z1 and Z2 crossover points with Zi module C=0.(C is the number of the cluster) to ensure that certain membership rates of a pixel are distributed and therefore comply with the Constraint
c
ik j 1
U
1
(7) Apply crossover
Mutation:
Limitations of Genetic algorithm:
The genetic algorithm needs less data on the problem, but it can be challenging to eliminate the objective function and get the representation and the operators correct.
Genetic algorithms are expensive in computation, i.e. time consuming. Genetic algorithms are approaches which are non-deterministic. Therefore, each time you run the algorithm on the same example, the solutions they provide can differ.
The reliability of the tests is highly dependent on: The initial population
The genetic operators (Crossover, distribution, mutation) and whether they are appropriate for the problem that you solve.
The probabilities of crossover and mutation.
Some of the latest genetic algorithm implementations are quite successful, even for large scale problems. As I said, it depends on how the various parameters of your system can be turned.
A genetic algorithm an provide an optimal solution, the only difficulty here is that you cannot prove the latter‘s optimality unless you have a good lower limit that suits the solution you have [14].
The conventional FCM has two shortcomings: The initial classification is based on the 3-matrix method,
that depends on the expert's knowledge. Various circumstances result in different classification outcomes, therefore the subjective variable will severely affect it. Furthermore, by the process of hill climbing, that is a local search approach and quickly hits the minimum local level, FCM finds the best solution to the study question. As an approximation for global optimization, GA can very well solve FCM's exited problems. This research applies Genetic algorithm to FCM to improve the performance of FCM. The enhanced technique involves two steps: first, GA automatically selects the initial classification number c; second, GA explicitly calculates the clustering core V.
3.3.2 PSO based FCM Clustering
The FCM algorithm is among the most regularly used data analysis techniques. This difficulty generates fuzzy boundaries and models for any numerical data collection. Let Y= (y1, y2,
y3,…,yN). In image segmentation, an image with N pixel is
represented to divide into c clusters where Yi represents multidimensional information. The FCM algorithms objective function can be summarized as follows:
2 2
1 1 1 1
,
N c m N c m ij ij ij j i j i j i
J
d
y
a
(8)1, 1,2,3, .., . 1 j c ij N i
(9)In which μij [ 0, 1 ] in the ith cluster represents Yj membership; Ai is the centroid of cluster I; m>1 is the fuzziness of the resulting partition; the Euclidean distance〖
d_ij〗^2=‖x_j-a_i ‖^2 is from the centroid ai pixel yj; as shown in Equation (10) and equation (11),center cluster and membership functions update:
1 2 1 1 m c j i ij
k j k
y
a
y
a
,1<=j<=N, 1<=i<=c (10)1
1
N m ij j j
i N m ij j
x
a
, 1<=i<=c (11)Segmentation by Particle Swarm Optimization (PSO)
Particle swarm optimization is a latest lookup technique whose
concept is inspired by the swarming or participatory behaviour of biological populations. Evolutionary heuristics are methods of searching for population. Using a combination of predetermined and qualitative laws, PSO moves a collection of points in a single iteration to different set of points. The PSO algorithm contains of three stages, i.e. generating particles, positions, and velocities, (10) updating the velocity, and updating the position. Particle swarm optimization is a stochastic optimization algorithm focused on population-based simulations of bird flock‘s social behaviour and follows similar steps as developmental algorithms to find near-optimal solutions [7].
Equation (8,) can be modified by placing the membership functions in the objective function as follows:
2 1 2 1
( ,
)
m m c j i j j k j kJ
J
y
a
y
a
y
a
a X
(12)Constraining the objective work with the most distant point as equation (8) is a non-insignificant non-linear upgrade work with consistent parameters ai, and µij, and a shut structure
game plan isn't available. PSO computation, in any case, is prepared for dealing with this issue as its swarm particles check each and every believable plan. [17]. The task of constraining the objective work with the use of the PSO figuring transforms into a technique for searching for the base estimation of J in the perfect gathering centroid a = (a1, a2, ..., cooling) in Equation (12) [20].
4 PERFORMANCE METRICS
(i) Peak Signal to Noise Ratio (PSNR):Peak signal-to-noise ratio (PSNR) is an approximation of the ratio between the maximum potential quality power of a signal and the distorting noise frequency affecting its efficiency of representation. Due to the high dynamic range of many signals, the PSNR is typically expressed in terms of the logarithmic decibel scale (ratio between the largest and smallest possible values of a configurable quantity).
PSNR
20 log
10MAX f
( )
MSE
(13)' MAX(f) ' is the peak signal quality of our original image (pixel size).
‗MSE‘ is the mean square error. (ii) Mean Square Error (MSE):
is, the average square discrepancy between the expected values and the actual value.
1 1 2
0 0
1
,
,
m n
MSE
f i j
g i j
mn
(14)In the two equations above mentioned, the following are the parameters.
'f ' symbolizes the matrix data of the original image (pixel data).
'g ' reflects the degraded image matrix information.
'm ' is the no. of the picture pixel rows and 'i' is the column number.
'n' represents the no row, and ' j ' represents the column list.. 'MAX(f)' is the peak signal quality of our original image (pixel size).
(iii) Normalized Cross Correlation (NCC):
Cross-correlation in signal processing is a two-series similarity measure as a function of transferring one relative to the other. This is also referred to as a shifting dot or inner component.
,
1
1
,
,
x y
NCC
f x y t x y
n
f t
(15)Where σf and σt are the respective standard deviations
(iv)Structural Similarity Index (SSIM):
The Structural Similarity Index (SSIM) is a perceptual metric that evaluates picture quality corruption brought about by preparing, for example, information pressure or by misfortunes in transmission of information. It is a full reference metric containing two pictures from same picture catch—a reference picture and a prepared picture.
SSIM really measures the perceptual contrast between two comparable pictures.
5
RESULTS
AND
DISCUSSIONS
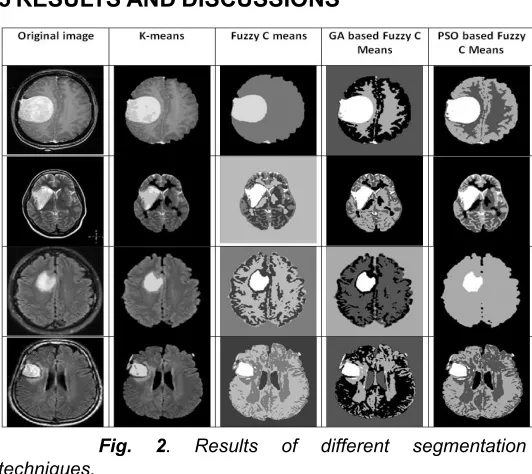
Fig. 2. Results of different segmentation techniques.
5.1 K-means vs. FCM:
As per our study, FCM performance is far better than K-Means results. One reason for this can be the minute details in the MRI images which are not perceivable to the human eye, where the tumour region actually gets separated from the other part. While K-Means divides the image into clusters,
each pixel is allocated to a specific group. In FCM each pixel has a tendency to belong to more than one cluster based on the membership function which helps FCM to give more accuracy in this case where the tumour overlaps with the remaining part of the brain (overlapping clusters). This can be seen from the table-2 in the form of PSNR value being higher for every case in FCM when compared to that of K-Means. The parameter PSNR gives the amount of original signal over noise, hence more the PSNR lesser must be the error. This can also be seen from the results obtained in the form of MSE, where the MSE values for FCM are lower when compared to the MSE values for K-Means.
TABLE1
PERFORMANCEMETRICSOFK-MEANSANDFCM
K-Means tends to be always extremely faster than FCM, since it assigns pixels to different clusters whereas FCM requires huge multiplication based computation to calculate the membership value. The K-Means‘ time complexity is O(n) and the FCM time complexity is O(n2).On the basis of
experimental results of computational time, the K-Means algorithm appears to be better with multiple starts because of its lower computational time than that of FCM algorithm. As it is also known from many researches and studies that FCM gives better results for noisy datasets while K-Means is chosen for large sets of data because of its computational time. Table 1 depicts the performance metrics values of both the clustering techniques applied on 4 different MRI images.
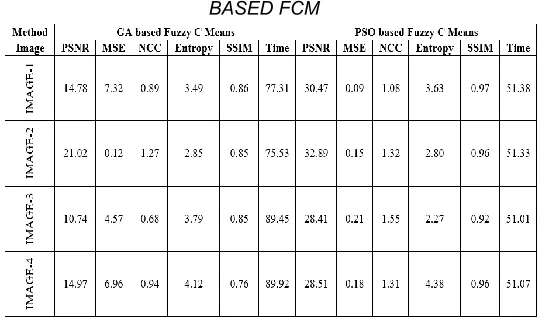
5.2 GA vs. PSO:
TABLE2
PERFORMANCE METRICS OF GA BASED FCM AND PSO BASED FCM
From comparative analysis of both the tables, the hybridization of FCM can be observed with GA and PSO reduces the computational time which was its major drawback earlier. But hybridization degrades performance of the algorithm slightly because when the optimization technique is used, the main focus is on reducing the time taken to search for the solution and improving the speed.
6
CONCLUSIONS
As per our observation, FCM is more efficient than K-means in terms of performance. In K-Means, the image is split into clusters and a specific cluster is assigned to each pixel whereas in Fuzzy C means, the pixels may belong to more than one cluster based on membership function and this property makes it more efficient on detecting brain tumors. From table 2, it can be clearly noticed that the performance values are more for fuzzy C means when compared to Means. When computational time is to be compared, then K-means takes less time to detect brain tumor Furthermore, we conclude that we can get an efficient output in FCM, by adding optimization techniques such as GA and PSO. As observed in table 3, PSO based FCM has greater performance and the computational time is optimum in PSO based FCM compared to GA based FCM. Finally, FCM gives better output than K-Means and it can give a better optimized output when it is optimized using PSO.
7
ACKNOWLEDGEMENT
We thankfully acknowledge management of KL University to provide each and every source and required facilities for completion of this work.
RFERENCES
[1] Sanghamitra T. Kamble, M. R. Rathod, ―BRAIN TUMOUR SEGMENTATION USING K-MEANS CLUSTERING ALGORITHM‖ International Journal of Current Engineering and Technology, Department of Electronics and Communication, E-ISSN 2277 – 4106, , Vol.5, No.3 (June 2015).
[2] ‖ C. Hemasundara Rao, Dr. P. V. Naganjaneyulu and Dr. K. Satya Prasad ―BRAIN TUMOUR DETECTION AND SEGMENTATION USING CONDITIONAL RANDOM FIELD‖, Department of ECE, DOI 10.1109/IACC.2017.157
[3] SaheliMajumder1, Shekhar Anandit Anand, Khatib Aqsa Javid, Vandana Katarwar, ―BRAIN TUMOUR SEGMENTATION MECHANISM BY USING K MEAN AND FCM‖ , International Journal of Innovative Research in Computer and Communication Engineering , Dept. of Electronics and Telecommunication Engineering, Vol. 4, Issue 4,( April 2016).
[4] Adam Chehouri , Rafic Younes, JihanKhoder, Jean Perron and Adrian Ilinca , ―A SELECTION PROCESS FOR GENETIC ALGORITHM USING CLUSTERING ANALYSIS‖ Algorithms, doi:10.3390/a10040123 (2017).
[5] Joungeun Baeand Hoo Yoo , ―FAST MEDIAN FILTERING BY USE OF FAST LOCALIZATION OF MEDIAN VALUE‖ , International Journal of Applied Engineering Research Department of Computer Science, Volume 13 (2018).
[6] Nuri Gómez Blas, Octavio López Tolic , ―CLUSTERING USING PARTICLE SWARM OPTIMIZATION‖, International Journal Information Theories and Applications, Vol. 23, Number 1, (c) ( 2016).
[7] Unnati, R. Raval, Chaita Jani, ―IMPLEMENTING & IMPROVISATION OF K-MEANS CLUSTERING ALGORITHM‖, International Journal of Computer Science and Mobile Computing, Department of Computer Science, Vol.5 Issue.5, May- 2016, pg. 191-203
[8] Sina Khan Mohammadi, Naiier Adibeig, Samaneh Shanehbandy, ―AN IMPROVED OVERLAPPING K-MEANS CLUSTERING METHOD FOR MEDICAL APPLICATIONS‖ Elsevier journals, Department of Systems Science and Industrial Engineering and Department of Computer Engineering, DOI: 0957-4174 (2016).
[9] Jin Zhou, Long Chen, C.L. Philip Chen, Yuan Zhang, Han-Xiong Li , ―FUZZY CLUSTERING WITH THE ENTROPY OF ATTRIBUTE WEIGHTS‖, Elsevier journals, Department of Systems Engineering and Engineering Management, DOI:0925-2312,(2016) [10]S. Bharathi, Dr. P. Venkatesan, ―A SURVEY ON
IMAGE SEGMENTATION BY FCM CLUSTERING TECHNIQUES‖, IEEE international conference, Department of EEE and Department of ECE, IEEE (2016).
[11]Li Guo, Long Chen, Yingwen Wu, C. L. Philip Chen, ―IMAGE GUIDED FUZZY C-MEANS FOR IMAGE SEGMENTATION‖, Department of Computer and Information ScienceDOI: 10.1109 (2016).
[12]Luxit Kapoor, Sanjeev Thakur , ―A SURVEY ON BRAIN TUMOR DETECTION USING IMAGE PROCESSING TECHNIQUES‖, IEEE,2017.
[13]Nilesh Bhaskar rao Bahadure, Arun Kumar Ray, and Har Pal Thethi , ―IMAGE ANALYSIS FOR MRI BASED BRAIN TUMOR DETECTION AND FEATURE EXTRACTION USING BIOLOGICALLY INSPIRED BWT AND SVM‖, International Journal of Biomedical Imaging, ‖, Department of Electronics & Telecommunication Engineering, Volume 2017. [14]Haldurai Lingaraj, T. Madhubala, R. Rajalakshmi ―A
and engineering, Department of Computer Science, Volume-4, Issue-10, 2016.
[15]S. Saharan, R. Baragona, M E Nor, R M Salleh, N MAsrah, ―CLUSTERING FOR BINARY DATA SETS BY USING GENETIC ALGORITHM INCREMENTAL K-MEANS‖, , Journal of Physics, Department of
Communication and Social
Research,doi:10.1088/1742-6596/995/1/012038, 2017.
[16]DiyarQaderZeebaree,HabibollahHaron,AdnanMohsin Abdulazeez and Subhi R. M. Zeebaree, ―COMBINATION OF K-MEANS CLUSTERING WITH GENETIC ALGORITHM: A REVIEW‖, International Journal of Applied Engineering Research, Computer and Communications Eng. Dept, Volume 12, Number 24 (2017).
[17]AdamChehouri, RaficYounes, JihanKhoder, JeanPerron, AdrianIlinca ―A SELECTION PROCESS FOR GENETIC ALGORITHM USING CLUSTERING ANALYSIS‖, Algorithms 2017, DOI: 10.3390/a10040123.
[18]Rejina Parvin ,Assistant Professor, Vasanthanayaki C ―PARTICLE SWARM OPTIMIZATION BASED CLUSTERING BY PREVENTING RESIDUAL NODES IN WIRELESS SENSOR NETWORKS‖,IEEE sensors journal. Doi: 10.1109/JSEN.2015.2416208 2015. [19]C. Vimalarani, R. Subramanian, and S. N.
Sivanandam, ―AN ENHANCED PSO-BASED CLUSTERING ENERGY OPTIMIZATION ALGORITHM FOR WIRELESS SENSOR NETWORK‖Scientific World Journal, Department of Electrical and Electronics Engineering Volume 2016, Article ID 8658760 2015.
[20]Garvishkumar K. Patel, Vipul K. Dabhi and Harshadkumar B. Prajapati, ―CLUSTERING USING A COMBINATION OF PARTICLE SWARM OPTIMIZATION AND K-MEANS‖, DOI 10.1515/jisys-2015-0099, 2015.
[21]Anita Tandan, Rohit Raja, Yamini Chouhan, ―IMAGE SEGMENTATION BASED ON PARTICLE SWARM OPTIMIZATION TECHNIQUE‖, International Journal of Science, Engineering and Technology Research (IJSETR), Volume 3, Issue 2, 2014
[22]Abdenour Mekhmoukh, Karim Mokrani ―IMPROVED FUZZY C-MEANS BASED PARTICLE SWARM OPTIMIZATION (PSO) INITIALIZATION AND OUTLIER REJECTION WITH LEVEL SET METHODS FOR MR BRAIN IMAGE SEGMENTATION‖, Elsevier journals, DOI: 0169-2607, 2015
[23]Ms. M. Manju ,P. Abarna ,U. Akila, S. Yamini ―PEAK SIGNAL TO NOISE RATIO &MEAN SQUARE ERROR CALCULATION FOR VARIOUS IMAGES USING THE LOSSLESS IMAGE COMPRESSION IN CCSDS ALGORITHM‖, ECE, International Journal of Pure and Applied Mathematics, ISSN: 1314-3395 Volume 119 No. 12 2018.