1425 IJSTR©2019
An Enhanced Preprocessing Algorithms And
Accuracy Prediction Of Machine Learning
Algortihms
S. Banumathi, Dr. A. AloysiusAbstract --Big Data is complicated to store, deal with, and analyze using conventional database and software techniques. Big Data includes high volume and velocity, and also variety of data that desires for innovative techniques to deal with it. Machine learning is a method of building data analytical models by analyzing data to identify hidden insights using algorithms that iteratively learn from the historical or stream data which helps in predicting unseen patterns. This pattern helps to make better decisions and predictions. The machine learning classification algorithm performances can be evaluated through training and testing representation of an efficient data pre-processing. This research work proposed enhanced pre-processing algorithms with feature selection and machine learning algorithms had been evaluated using performance evaluatory measures. The proposed pre-processing and feature selection algorithms have high impact on performance of ML algorithms.
Index Terms-- Big data, Data analytics, predictive analytics, machine learning algorithms, preprocessing, Enhanced Relief algorithm, Prediction model.
—————————— ——————————
1 I
NTRODUCTION Machine learning (ML), a sub-field of artificial intelligence (AI), focuses on the task of enabling computational systems to learn from data about how to perform a desired task automatically. The ultimate aim of machine learning is to build up methods that can automatically detect patterns in data, and then to use. The machine learning task involves with statistical and probabilistic methods [2]. It process training data and produce a predictive model. Once the predictive model is created, the models provide the outcomes. The data adaptive machine learning methods can be identified throughout the science world [1]. Machine learning has numerous applications which comprise decision making, predicting and it is a key enabling technology in the deployment of data mining and big data techniques in the different fields of healthcare, business, finance, science and engineering [10]. The tasks can be categorized into the following major types of supervised and unsupervised machine learning [8]. In Supervised Learning the learning task is to generalize from a training set, labeled by a supervisor to be full of information about the class. Those predictions can be made about novel and nevertheless hidden. Supervised algorithm used for Classification and Regression (binary and multi-class problem) anomalies detection (one class problem). In supervised learning, the input and its corresponding output is already known. This is called supervised learningbecause it learns from training data set and creates model from it and when this model applies on new data set it gives predicted results [9]. Classification is a process of discovery model (functions) that describe and distinguish classes of data or concept that aims to be used to predict the class of the object which label class is unknown.
The classification process is based on four components, which are class, predictor, training data set, test dataset. Class is the Categorical dependent variable in the form that represents the label contained in the object. Predictor is the independent variables are represented by characteristic (attribute) data. The predictions belong to a constant set of values then such a problem is called regression, while if the output assumes discrete values then the problem is called classification. The remaining parts of this paper are structured as follows. The section 2 illustrates literature support which motivates to propose this research work. Section 3 explains proposed model with four phases and it also includes the psuedocode for the proposed enhanced algorithms. In section 4 the experimental results are discussed in detail manner. The final section concludes this research proposal with future work.
2 Literature Review
Saravankumar et al., proposed predictive analysis system by analyzing the large diabetic disease data. The hadoop environment used to distribute the data among various server and the data replicated to several map reduce nodes. In mapping phase the master nodes splits large data into smaller tasks to all work nodes. The predictive analysis system act as a pattern matching system. The pattern matching is the process of comparing the analyzed threshold value to the actual obtained value. The author ————————————————
S. Banumathi, Assistant Professor, Department of Computer
Science, Holy Cross College, Tiruchirappalli, Tamilnadu, India.
Dr. A. Aloysius, Assistant Professor, Department of Computer
predictive system for rural are needed to provide treatment at low cost [9].
The new decision support system was introduced to predict kidney chronic disease by Parul etal. The data set from the patients collected and the proposed system used two machine learning algorithms such as SVM and KNN. The classifier used to predict the disease and the performance of the classifier is evaluated. The proposed system used classification algorithms accuracy shown in confusion matrix. The proposed system implemented in MATLAB and finally the result accuracy is high in KNN and KNN is considered as best prediction model for this constraint scenario [14].
A deep learning based approach used to identify the risk relates with Electronic Health Record. The author YuChang et al. mentioned that data driven health care aim at the effective promising utilization of big medical data which represents the collective learning in training millions of patients to provide best and most personalized care in the right direction. The author stressed the issues and challenges exist in health care data. The few are high dimensionality, temporality, sparsity, irregularity, bias [15] [17].
Lakshmi et al. proposed decision support system uses decision tree and KNN as classification model for disease prediction which reduces the time and cost of diagnosing the disease. The proposed model proved KNN has to highest accuracy than decision tree of 95% [16].
Yakab et al. offer a new approach to disease prediction which is well suited to big data requirements. Bruiman’s categorize two approaches for statistical modeling namely data modeling and machine learning approach. The data model assumes that data is generated by stochastic data model where the output is predicted by estimating the parameters of the input data. The machine learning approach views data output as arising from unknown input-output mapping process and overarching the goal of statistical modeling to learn function an algorithm that best approximates mapping process [18].
R.Thayammal et al. used disease data set from machine learning repository and do the experiment using different machine learning algorithms. Specifically they made comparison between classification accuracy and they found SVM provide higher accuracy than other specially Naïve Bayes [19].
GangLuo proposed an approach and tool to predictive modeling. He studies various machine learning algorithms that improve automatically through experience such as decision tree, random forest, neural network, and SVM [20]. In spite of the recent achievement in machine learning is great, but with the emergence of big data much needs to be addressed with significant challenges.
A machine learning algorithm finds natural patterns in data that generate insight and helps to make better decisions and predictions [4]. They are used to make critical decisions in medical diagnosis, stock trading, energy load forecasting, and more. The major contributions of this research work are as follows:
a) An enhanced preprocessing with Enhanced Relief feature selection algorithm proposed.
b) The ML supervised algorithms performances have been checked with selected features with cross validation.
c) The experimental study suggests that enhanced feature selection with supervised learning for data set that accurately predicts the target value.
Figure.1 illustrates the proposed hybrid model which consists of four different phases namely data collection and pre-processing phase, learning algorithm phase and accuracy evaluation phase. The medical data is collected from UCI machine learning repository. After preprocessing the data instances are reduced. Enhanced Preprocessing algorithm proposed and used to reduce the dimensionality of dataset. By applying this algorithm on all the attributes, returned six attributes to be used for training the classifiers. Then applying resample filter with no replacement that disables the data to be replicated.
Figure: 1 Proposed Hybrid Model 3.1 Preprocessing Phase:
1427
Figure: 2 Preprocessing Phase
The missing values have been removed then the z-score value calculated. The score calculation method considers mean standard deviation as an enhanced method. Hence it is more robust to find outliers than the standard deviation from the mean which was not squared value. The outcome of the preprocessing phase has no outliers which reduced effectively using enhanced normalization algorithm. The enhanced normalization score will be calculated as follows:
/ ,
Where A* is the mean, is standard deviation for attribute A
A* = 1/n (ϑ1+…. + ϑn), (A*)'= sqrt (variance)
SA= 1/n (|ϑi-A'| + |ϑ2-A'|+ ………. + |ϑn-A'|)
ϑi'=ϑi- A'/ SA
The feature selection algorithm is Relief which is most frequently used for sparse and high dimensional data [13]. This algorithm reduces the data set with relevant features. This algorithm assigns weights to all the features of the data set. This research work proposed Enhanced Relief algorithm by changing the distance value randomly using Manhattan distance function and final weights of the features are sorted as novel method. The conditional threshold for weight age assigning is features nearer to the target class have great weight value and the remaining has smaller weights. The output of the algorithm is a weight from between -1 and 1 to selected subset features that means positive weights indicating more predicative features. The attribute weight calculated using probabilistic interpretations and thus it is directly proportional to conditional probabilities of two namely nearest miss and nearest hit respectively. The pseudo code of E-Relief algorithm (Algorithm: 1) iterated through n random training instances (Rk) selected where n is the attribute
parameter. For each k the Rk is the target instance and
feature score vector W is changed and updated.
3.2 Learning Phase
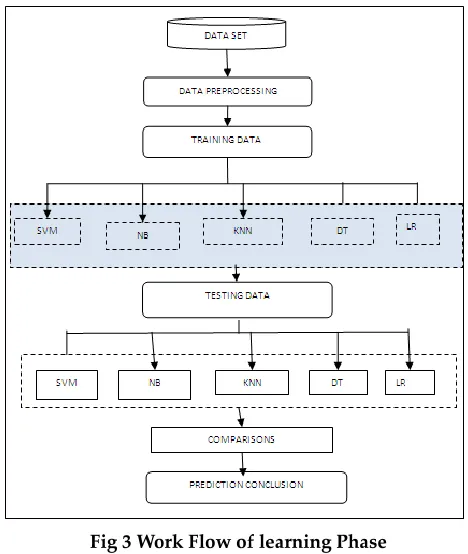
In order to classify the classes and predict the target value machine learning supervised algorithms are used. Some most frequently used popular algorithms concept of learning principles and formula calculations are discussed briefly in the following sections. The working flow this proposed learning phase illustrated in figure.3.
3.2.1 Regression Analysis
Regression is a technique of modeling primarily focuses on discovering relationship and identifying prediction of target variable value based on one or more independent predictor’s variable. Predict the value of dependent variable based on multivariate independent variable. The regression model basically alienated as univariate and multivariate and that are additional divides into linear, nonlinear [6]. Linear regression performs the assignment to predict a dependent variable value y base on a known independent variable x. This technique finds out a linear relationship between x and y. The regression line is the best fit line for model. The hypothesis function of linear regression is . In the model training the x is the input training data, y the labels of data. The model gets the best regression fit line by finding the best of intercept θ1 and
coefficient θ2. Then the prediction of logistic regression
under the condition is following: 0≤h θ(x) ≤1. The logistic regression sigmoid function is written as follows: hθ(x) = g(θTx) where g(z) = 1/(1+x-z) and hθ(x) = 1/(1+x-z). The cost
functions of logistic
regression .
3.2.2 Naive Bayes Classifiers
Naive Bayes Classifiers are based on Bayes Theorem which is a supervised learning algorithm that assumes independence among features specified in a class. All the attributes are analyzed individually giving all of them equal importance of weight age [7]. It is based on Data set
Removing missing values
Normalization scalar
Z-score calculation
Normalized data
Enhanced-RELIEF ALGORITHM:
Input: training instance set S, a vector of features, class value
m ---- Number of training instances f--- Number of features
Parameter:
n---- Number of random training instances out of m to update weight
Algo:
Initialize all feature weights W [A] = 0.0 For each k= 1 to n do
Randomly select a target instance Rk
Find the nearest hit “MH” and nearest miss (instance)
For A= 1 to f do
W [A] = W [A] - diff (A, Rk, MH)/n+ diff (A, Rk, MI)/n
End For End For
Selected weight= sort (W [A])
The very staggered feature of Naive bayes is exceptionally rapid to scuttle huge sparse data set [3].
Bayes classification difficulty is learning the joint probability. The following classification rules identified for the assumption of whole input features are conditionally independent. The following equation illustrates the rules for prediction of target class.
The rule generated is
P(X1,X2,X3,…..XN|C)=P(X1|X2,X3,…XN, C)P(X2,X3…XN)|C and
P(X1,X2,X3,…..XN|C)= P(X1|C)P(X2|C)P(X3|C)…..P(XN|C).
In the learning phase for a given training set s, for each target value of (c1, c2, c3...ci) the p^(C=ci) estimated. For every
feature the nested looping constructs calculated as the condition as xjk , Xj(j=1,2….n) and k=(1,2,3,….jk) and finally
the conditional probability tables will be generated for Xj and Nj x L elements.
3.2.3 Decision Trees
Decision Trees define as popularly used intuitive method that can be used for learning and predicting about target features both for quantitative target attributes as well as nominal target attributes. It is directed tree with root node which has no incoming edges, and all other nodes with exactly one incoming edges, known as decision nodes. In the training stage each internal node split the instance space into two or more parts with optimizing the performance. Then each and every path from the parent or root node to the leaf node forms a decision rule. The main advantage of DT is their intuitive interpretation which is crucial even network operators have to analyze and interpret the classification method and results [4]. In decision tree algorithm the node n will be created, then if all the instances of same classes C then label N with C will added, otherwise check the A is empty where select a€A with highest information gain and label N with A, similarly for each value of a change the value of the node with the condition a=v. In Sv is the subset of A then add the leaf node
with S of a=v.
3.2.4 Support Vector Machines
The Support Vector Machines (SVM) is an extensively used supervised learning technique. The approach of SVM is maximum margin that converted into a quadratic programming sum. It based on the field of statistical learning theory, and is systematic; hence many applications had used SVM. In a binary classification the instances are separated by a hyper plane wt.x+b=0, where w is
dimensional coefficient vectors, which are place to the hyper plane, and b is the offset value from the origin and x is the data set values. The vector machine gets results of w and b where w can be solved by lagrangian multiplier which is only for linear case. The data points on border are called as hyper points in svm. The w is equal to
here n is the number of support vectors and y is the target
written as following:
g(x) = sgn (( ))
In nonlinear instances the kernel trick is also included and it can be written as:
g(x) = sgn (( ))
The two key in features of support vector machines are generalization theory, which leads to a righteous way to choose hypothesis and, kernel functions, which introduce non-linearity in the hypothesis space devoid of unambiguously requiring a non-linear algorithm [5].
Fig 3 Work Flow of learning Phase 3.2.5 K-Nearest neighbor
KNN is the supervised machine learning algorithm which attempts to predict the class label of the new input. It manipulates the similarity of the new instance to the training instances then it attempts to classify the instances. The learning function is h: C D, where c, d is the training observations, hence h(c) can determine d value.
4
Experimental Results and Discussion:
1429 4.1 Result of the preprocessing algorithms
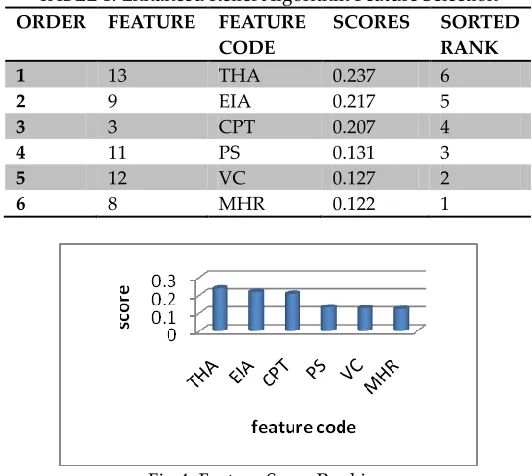
The z-score was calculated then the data set normalized using score values. Enhanced Relief algorithm assigns weight age and ranked them, then based on this weight score the features was selected. The data set consist of 13 features; among them 6 features has high positively predicated weight age. Those features alone are selected for next learning phase. Table 1 depicts the score value of each features selected. Figure 4 illustrates the ranking of features. Figure 4 shows the features ranking after sorted.
TABLE 1: Enhanced Relief Algorithm Feature Selection ORDER FEATURE FEATURE
CODE
SCORES SORTED RANK
1 13 THA 0.237 6
2 9 EIA 0.217 5
3 3 CPT 0.207 4
4 11 PS 0.131 3
5 12 VC 0.127 2
6 8 MHR 0.122 1
Fig 4: Feature Score Ranking
In the present study, the features selected from weight age score are alone considered for learning phase with various machines learning predictive models such as logistic regression, k-nearest neighbor, ANN, SVM, decision tree, Naive Bayes, have been used for classification of people with disease and healthy people.
4.2 Classifier Evaluation Measures:
Supervised machine learning is to build a model that makes predictions based on evidence in the presence of uncertainty. Training dataset is data set that contains the value of both components above are used to determine a suitable class based on predictor [11]. Testing dataset containing new data which will be classified by the model that has been developed. In this experiment the selected features were checked with five machine learning algorithms with 10-fold cross validation. In ten 10 fold cross validation, the 90 percentage of data considered as training set and 10 percentage considered as test set To evaluate the performance of supervised machine learning algorithms, confusion matrix is used. The four classification performance indices are present in confusion matrix are given in table 2. 2x2 confusion matrix is used
state Predicted patient
result
Healthy person
Actual patient TP FN
Healthy person FP TN
TABLE: 2 CONFUSION MATRIX.
In the confusion matrix TP denotes the predicted output is true positive, that the classified has disease. TN denotes that classified subject is healthy. FP denotes the predicted output is incorrectly classified. FN denotes disease is incorrectly classified. The evaluation measurements used are: Sensitivity, Specificity, Positively Predicted and Negatively Predicted value [12]. Sensitivity and Specificity is the proportion of actual positives and negatives which are correctly identified as such. The Positive and Negative predictive values are the equivalent of positive and negative results, which are predicted. The performance evaluation calculated as follows, Sensitivity must have high percentage. Specificity must have low percentage, Accuracy must have high percentage. Classification accuracy presents whole performance of the classification model. It can be calculated as following: Accuracy = (TP+TN) / (TP+TN+FP+FN) * 100%.The incorrect classifications calculated as following: Classification error= (FP+FN) / (TP+TN+FP+FN) * 100%. The Learning phase analyse various supervised learning algorithms such as Decision Tree, Support Vector Machine, Naïve Bayes, Random Forest, KNN. The prediction measurement and accuracy calculations have been mentioned in Table. 3 figure 5 and 6.
Model Accu
racy (in Perce ntag e)
Speci ficity (in Perce ntage)
Sensitivity (in
Percentage )
AUC (in Percentage )
Proce ssing time (seco nds)
Logistic regression
83 84 82 82 19.20
SVM 85 87 77 84 15.23
Naive Bayes 83 87 77 82 34.10
Decision Tree
74 75 67 75 21.95
KNN 76 73 72 72 29.30
TABLE: 3 EVALUATION MESUREMENT OF PREDICTION MODELS
FIG: 6 PROCESSING TIME COMPARISION OF PREDICTION MODELS
As shown in figure: 3 the machine learning algorithms has to comply with certain evaluation measurements to prove its accuracy. Logistic regression has 83% of accuracy and sensitivity and specificity 84%, 82% respectively. Support vector machines have 85% of accuracy and sensitivity and specificity 87%, 77% respectively. A naive Bayes algorithm has reached 83% of accuracy. Decision tress has 74% of accuracy and 75%, 67% of sensitivity and specificity respectively. KNN has 74 % of accuracy and 73%, 72% of sensitivity, specificity respectively. The measurements highly denotes that each algorithms has attains nominal level of accuracy but SVM specifically reached high accuracy in percentage.
The figure: 5 mention the processing time of machine learning algorithms in seconds. The figure: 6 show that naive bayes algorithm has long processing time than others. And SVM has short processing time than other algorithms. From the experimental results for the disease diagnosis data, SVM has reached higher accuracy with minimal processing time in the combination of enhanced proposed normalization technique and feature selection algorithm.
5
Conclusion
The quantity of data has been rising and data set analyzing become more competitive. Machine learning analytics is the combination of analytics techniques and decision optimizations. This revision would provide a support for the researchers in this area as it provides a wide Collection of previous research. Focusing on modelling the metrics for performance that were extracted from the abstracted data with big data and machine learning. From this research work the undertaken problem is a good fit for machine learning using SVM. High prediction accuracy has been found for SVM based models. The future work will concentrate on use of standard deviation to replace missing values, box plot for outlier detection, to experiment classifiers from statistical, neural, fuzzy, genetic algorithms and tree families to enhance the resulting accuracy.
REFERENCES:
[1] M. I. Jordan, T. M. Mitchell, “Machine learning: Trends, perspectives, and prospects”, sciencemag.org, vol316, Issue 3212, 2012.
Based Approach to Enhance the Accuracy of Sentiment Analysis on Tweets”, International Journal of Advanced Research in Computer Science and Management Studies, volume1, issue 2, 2013.
[3] Enric Junque, De Fortuny, David Martens, Foster Provost, “Modeling With Big Data: Is Bigger Really Better”, Doi: 10.1056/Big.2013.0034, Vol 1, No 1, December 2013. [4] Wei Dai , Wei Ji, “ A Map reduce implementation of c1.2 Decision Tree algorithm”, International Journal of Data base theory and Applications, Vol.4, No.1, 2017.
[5] P.Sheela Rani, S.Shalini, J.Rukmani, keerthika, A.Shanthini, “Energy efficient scheduling of map reduce for evolving big data applications”, International journal of advanced research in computer and communication engineering, vol.2, issue.2, 2013.
[6] Ramya MG, Chetan Balaji, Girish L, “ Environment change prediction to adapt climate smart agriculture using big data analytics”, IJARCT.ORG, 2012.
[7] Se-Hoon Jung, Jong-Chan Kim, Chun-Bo Sim,” Prediction Data Processing Scheme using an Artificial Neural Network and Data Clustering for Big Data”, IEEE Explorer, 2012.
[8] Krithika Verma, Pradeep Kumar Singh, “An insight to soft computing based prediction techniques in software”, I.J.Modern education and computer science, 2012.
[9] Saravanakumar, Eswari, Sampath, Lavanya, “Predictive Methodology for Diabetic Data Analysis in Big data”, Elsevier, 2015, pp.203-208.
[10] Chonolee, Zhaojing Luo, Kee Yuan Ngiam, Meihui Zhang, Kaiping Zheng, Gang Chen, Beng Chin Ooi, Wei Luen James Yip, “ Big Health care Data Analytics: Challenges and Applications”, Springer, 2017, DOI: 10.1007/978-3-319-58280-1_2, pg.11-41.
[11] S. Banumathi, A. Aloysius,” Big Data Prediction Using Evolutionary Techniques: A Survey”, Journal of Emerging Technologies and Innovative Research, September 2016, Volume 3, Issue 9, Pg. 89-91.
[12] S. Banumathi, A. Aloysius,” Prediction Model with Selection of Best Prediction Algorithm for Big Data”, Saudi Journal of Engineering and Technology (SJEAT), March, 2018, ISSN 2415-6264.
[13] S. Francisca Rosario, Dr. K. Thangadurai, “Feature selection approach”, International journal of innovative research and development, Oct, 2015, ISSN: 2278-0211. [14] Parul Sinha, Poonam Sinha, “Comparative Study of Chronic kidney disease prediction using KNN and SVM”, International Journal of Engineering Research and Technology (IJERT), Dec, 2015, vol 4, Issue. 12.
1431 [16] K. Lakshmi, D.Iyarajz Ahmed, G. Sivakumar, “A smart
clinical decision support system to predict diabetes disease using classification techniques”, IJSRSET, 2018, Vol4, Issue.1.
[17] Javier Andrew-perez, Carmen c.y.poon, Robert D. Meurifield, Stephen T.C.Wang and Guang-Zhong Yang, “ Big data For heatlh”, IEEE, 2015, Vol 19, Issue:4.
[18] Yakub Sebastian, Xun Ting Tiong, Valliappan Ram , Alan Yean Yip Iong, Patrick Hung Hui Theo, “ Advancces in Diabetic Analytics from clinical and machine learning Perspecctive”, International journal of design, analysis and tools for intergrated circuits and systems, 2016, vol.6, no,1.
[19] R. Thayammal, S.Kamalakannan, P. Kavitha, “Big Data Analytics in Disease data prognosis using Naïve Bayes Classification algorithm”, International journal of pure and applied mathematics, 2018, vol.19, no.10.
[20] Gang Luo, “Predict-ML : a tool for automating machine learning model building with big clinical data”, Health information science society, 2016, DOI: 10.1186/s/13755-016-0018-1.
AUTHORS PROFILE
S. Banumathi doing her Doctoral Degree in Computer Science at Bharathidasan University, Tiruchirappalli, Tamilnadu, India. She has more than Seven years of teaching and research experience. She is currently working as Assistant Professor, Department of Computer Science, Holy Cross College, Tiruchirappalli, Tamilnadu, India. She had published several papers in international journal. She had presented various papers in national and international conferences. Presently she is doing her research on Big data analytics, Machine learning, Cloud computing, Wireless Adhoc Networks, IoT domains.
Dr. A. Aloysius is working as Assistant Professor in Department of Computer Science, St. Joseph’s College, Trichy, Tamil Nadu, India. He has 19 years of experience in teaching and research. He has published many research articles in the National/ International conferences and journals. He has also presented research articles in the International Conferences on Computational Intelligence and Cognitive Informatics in Indonesia. He has