Cyber Space Shopping Behavior: A Factor Analysis Approach
Dr.Shiney Chib, Director & Research Head, Datta Meghe Institute of Management Studies,Nagpur,
Aniket Potphode, MBA Final Semester Student, Datta Meghe Institute of Management Studies,Nagpur,
ABSTRACT
The rapid growth of Internet has brought many changes in the shopping perception. It has brought promised change, challenges and even bright future, not only to consumers but also to companies, suppliers and middlemen. But still there are still many “ifs” and “buts”, that we find people whispering relating to its potentiality, impact and implications on business and social lives. This paper is an empirical study to know the factors that influence the cyber space purchase behavior. A sample of 189 respondents was drawn from Nagpur city. The major objective of the study was to find out respondents’ preferences and overall opinion on cyber space Buying. The research tool used was a structured questionnaire. The results of the study revealed that online shopping experience, its features and benefits significantly affect online shopping and at the same time the perceived risk in terms of quality of products, privacy, security, money and product guarantee/warrantee discourages the people to shop online.
Keywords: Internet, E-commerce, Online Shopping, Consumer Behaviour INTRODUCTION
Today the rapid growth of Internet and E-commerce has triggered off many changes in our life. This has brought promised change, challenges and even bright future, not only to consumers but also to companies, suppliers and middlemen. There are still many “ifs” and “buts” that we find people are whispering relating to its potentiality, impact and implications on business and social lives of all. That online buying behavior is affected by various factors like, economic factors, demographic factors, technical factors, social factors, cultural factors, psychological factors, marketing factors and legislative factors. Customers choose an online-shop mainly based on references, clarity and menu navigation, terms of delivery, graphic design and additional services.
LITERATURE REVIEW
e-commerce as a way of doing business has created an environment in which the needs and expectations of business customers and consumers are rapidly changing and evolving. (Clarke, Flaherty, 2005). In the last decade, the growth and generalization of Internet use has made it possible to increase sales through e-commerce websites. (Corbitt, B. J., (2003) .All marketers try to identify consumers’ buying behaviour. But they are in opposite to sophisticated customers who are able to use and analyze more information sources than before and to make the best buying decision. They are more comfortable than in previous years because they are used to having better services now. The effectiveness of advertising is decreasing and it is more difficult to persuade customers to buy company’s products. The combination of these factors can influence the final price. The analysis of consumer behaviour is a key aspect for the success of an e-business. However, the behaviour of consumers in the Internet market, changes as they acquire e-purchasing experience.(Hernándes et al., 2010) Customer behaviour does not necessarily remain stable over time since the experience acquired from past purchases means that perceptions change. Consumer decision process is so generic that it can be applied to consumer behaviour in any channel, including the Internet. (Roberts, 2008)
OBJECTIVES
1. To identify the impact of Demographic factors impacting on-line shopping behavior of consumers
2. To study the factors affecting online shopping behavior of customers.
3. To identify the effects of perceived risk on buyer attitude towards on online shopping.
HYPOTHESIS
1. Demographic factors influences on online cyberspace consumer behavior. 2. Perceived risk has an influence on online cyberspace consumer behavior.
UNIVERSE OF STUDY
The Universe of study is Nagpur Region. Nagpur is the second capital of Maharashtra and is very popular for oranges. It is fast developing with connectivity and rich infrastructural faculties. It has already achieved the status of upcoming Metro.
SAMPLE SIZE: 189. Random sampling was carried out.
METHOD OF DATA COLLECTION
Primary Source : Questionnaire
The questionnaire was having 44 questions, and was classified into two parts.
Part 1:Demographic Questions :Part 1 was having 11 demographic questions namely, Name, Age , Gender, Education, occupation, Monthly family income, online shopping awareness , online shopping experience, online shopping willingness, product preferences and area of residence.
Part 2:Research Questions: Part 2 had 33 questions related to online shopping. The data was collected with the help of 5 point Likert Scale.
Secondary Source : Websites, Business magazines & journals.
DEVELOPMENT OF INSTRUMENT
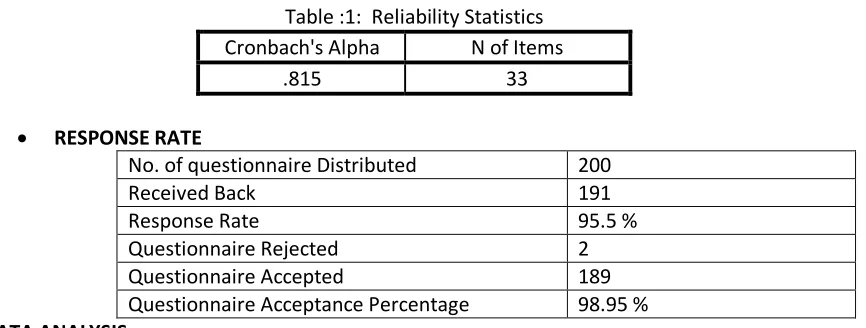
Table :1: Reliability Statistics
Cronbach's Alpha N of Items
.815 33
RESPONSE RATE
No. of questionnaire Distributed 200
Received Back 191
Response Rate 95.5 %
Questionnaire Rejected 2
Questionnaire Accepted 189
Questionnaire Acceptance Percentage 98.95 %
DATA ANALYSIS
Data Analysis was carried out with SPSS PACKAGE. The survey results are organized as follows. In the first section, the demographic profile of the respondent was presented. The second part concluded with the data analysis of the responses with respect to the perception of the respondents.
RESULT AND ANALYSIS
A Demographic Characteristics:
Table :2: Demographic characteristics of the Respondents
Variables and categories N=189 %
Age
Less than 25 104 55
26-30 42 22.2
31-35 13 6.9
36-40 14 7.4
41-45 6 3.2
46-50 8 4.2
Above 50 2 1.1
Gender
Male 116 61.4
female 73 38.6
Education
PhD 5 2.6
Post Graduate 65 34.4
Graduate 86 45.5
Under Graduate 33 17.5
Occupation
Business 23 12.2
Professional 15 7.9
Service 47 24.9
Unemployed 15 79
student 89 47.1
Below 50000 97 51.3
50000-1 lakh 47 24.9
Above 1 lakh 45 23.8
Awareness
Yes 183 96.8
No 6 3.2
Experience
Yes 171 90.5
No 18 9.5
Willingness
Yes 183 96.8
No 6 3.2
Locality
Rural 5 2.6
Semi-urban 41 21.7
Urban 143 75.7
Source: Primary Data
Above Table exhibits the demographic traits associated with the respondents considered for the purpose of the study. It was observed that 61.4% were male and 38.6% were female. Maximum respondents were from below 25 years category and the percentage was 55 % and least from above 50 years, and the percentage was 1.1 %. 45.5 % were PhD and least was under graduate and the percentage Maximum respondents were students category and the percentage was 47.1 %. Maximum monthly family income was below 50000 category and the percentage was 51.3 %. 17.5 %. were from the age category of 20-22, 64.6% from 22-24 category and 2.8 % were from 24-26 category. There were no respondents from above 26 yrs category. 92 % respondents belonged to urban area, 5% from semi urban area and 3% from rural locality. Maximum respondents were aware of online shopping and the percentage was 90.5 %. Maximum were having experience and the percentage was 90.5%. Maximum showed the willingness for online shopping and the percentage was 96.8%. Maximum people belonged to urban area and the percentage was 75.7 %.
The product preference analysis showed that the most preferred product is electronic goods and out of 189 respondents,113 purchased electronic goods through online shopping. 71 preferred apparels, 57 preferred accessories, and 23 preferred cosmetics. 65 preferred other items which does not come under this category. Respondents were having the combo combinations of product preference, viz. set 1: cosmetics, apparels, set 2: cosmetics, apparels, electronic goods, set 3 : cosmetics, apparels, electronic goods, set 4 : cosmetics, apparels, electronic goods, Accessories , set 5 : cosmetics, apparels, electronic goods, Accessories, set 6 : cosmetics, apparels, electronic goods, Accessories, others, and other combinations.
HYPOTHESIS TESTING
Hypothesis 1 :Demographic factors influences on online cyberspace consumer behavior.
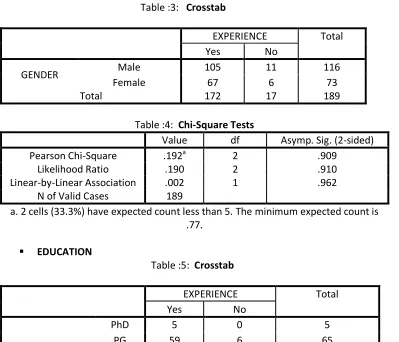
GENDER
Table :3: Crosstab
EXPERIENCE Total
Yes No
GENDER Male 105 11 116
Female 67 6 73
Total 172 17 189
Table :4: Chi-Square Tests
Value df Asymp. Sig. (2-sided)
Pearson Chi-Square .192a 2 .909
Likelihood Ratio .190 2 .910
Linear-by-Linear Association .002 1 .962
N of Valid Cases 189
a. 2 cells (33.3%) have expected count less than 5. The minimum expected count is .77.
EDUCATION
Table :5: Crosstab
EXPERIENCE Total
Yes No
EDUCATION
PhD 5 0 5
PG 59 6 65
G 82 4 86
UG 26 7 33
Total 172 17 189
Table :6: Chi-Square Tests
Value df Asymp. Sig. (2-sided)
Pearson Chi-Square 8.498a 3 .037
Likelihood Ratio 7.832 3 .050
Linear-by-Linear
Association 2.553 1 .110
N of Valid Cases 189
OCCUPATION
Table :7: Crosstab
EXPERIENCE Total
Yes No
OCCUPATION
Business 22 1 23
Professional 14 1 15
Service 42 5 47
Unemployed 13 2 15
Student 81 8 89
Total 172 17 189
Table :8: Chi-Square Tests
Value df Asymp. Sig. (2-sided)
Pearson Chi-Square 1.206a 4 .877
Likelihood Ratio 1.297 4 .862
Linear-by-Linear
Association .308 1 .579
N of Valid Cases 189
a. 4 cells (40.0%) have expected count less than 5. The minimum expected count is 1.35.
INCOME
Table :9: Crosstab
EXPERIENCE Total
Yes No
INCOME
Below 50000 84 13 97
50000-1 lakh 46 2 48
Above 1 lakh 42 2 44
Total 172 17 189
Table :10: Chi-Square Tests
Value df Asymp. Sig.
(2-sided)
Pearson Chi-Square 4.733a 2 .094
Likelihood Ratio 4.985 2 .083
Linear-by-Linear
Association 3.743 1 .053
N of Valid Cases 189
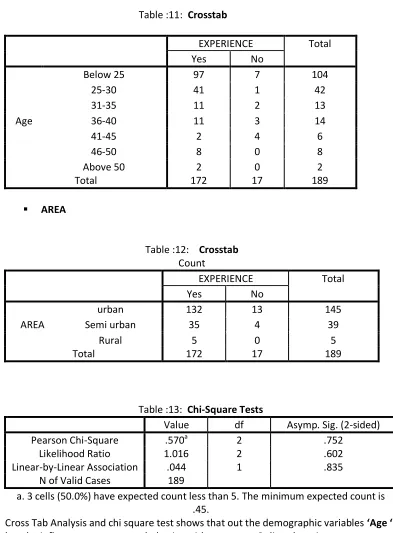
AGE
Table :11: Crosstab
EXPERIENCE Total
Yes No
Age
Below 25 97 7 104
25-30 41 1 42
31-35 11 2 13
36-40 11 3 14
41-45 2 4 6
46-50 8 0 8
Above 50 2 0 2
Total 172 17 189
AREA
Table :12: Crosstab
Count
EXPERIENCE Total
Yes No
AREA
urban 132 13 145
Semi urban 35 4 39
Rural 5 0 5
Total 172 17 189
Table :13: Chi-Square Tests
Value df Asymp. Sig. (2-sided)
Pearson Chi-Square .570a 2 .752
Likelihood Ratio 1.016 2 .602
Linear-by-Linear Association .044 1 .835
N of Valid Cases 189
a. 3 cells (50.0%) have expected count less than 5. The minimum expected count is .45.
Cross Tab Analysis and chi square test shows that out the demographic variables ‘Age ‘ and ‘Education’
Hypothesis 2 :Perceived risk has an influence on online cyberspace consumer behavior.
Table :14: t- Test
Test Value = 0
t df Sig. (2-tailed) Mean
Difference
95% Confidence Interval of the Difference
Lower Upper
53.67
6 188 .000 2.92910 2.8215 3.0367
The table shows the t –test results. It shows that there was no sufficient evidence to accept null hypothesis, hence null hypothesis was rejected and alternate hypothesis was accepted. Perceived risk has an influence on online cyberspace consumer behavior.
Factor Analysis for identifying the factors influencing Online Shopping.
Table :15: KMO and Bartlett's Test
Kaiser-Meyer-Olkin Measure of Sampling Adequacy. .786
Bartlett's Test of Sphericity
Approx. Chi-Square 4061.983
df 351
Sig. .000
Source: Primary Data
KMO score is 0.786. It is above the recommended value of 0.5. Further Bartlett’s Test of Sphericity exhibits significance value of less than 0.05 (.000). Thereby ensuring the appropriateness of factor analysis.
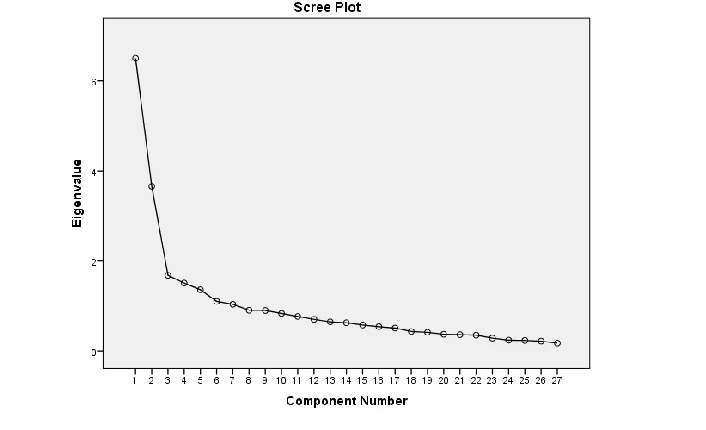
Table :16: Total Variance Explained
Compon ent
Initial Eigen values Extraction Sums of Squared Loadings
Rotation Sums of Squared Loadings
Total % of
Varianc e
Cumulati ve %
Total % of
Varianc e
Cumulati ve %
Total % of
Varian ce
Cumulativ e %
1 6.502 24.082 24.082 6.502 24.082 24.082 4.164 17.422 17.422
2 3.658 13.547 37.628 3.658 13.547 37.628 2.950 15.927 33.349
3 1.683 6.233 43.861 1.683 6.233 43.861 2.847 13.543 46.892
4 1.511 5.596 49.458 1.511 5.596 49.458 2.226 10.243 57.135
5 1.363 5.048 54.505 1.363 5.048 54.505 2.107 8.805 65.941
6 1.105 4.092 58.598 1.105 4.092 58.598 1.527 7.657 73.597
7 1.040 3.851 62.449
8 .907 3.358 65.807
9 .902 3.341 69.148
10 .836 3.095 72.243
11 .770 2.851 75.094
12 .705 2.613 77.707
13 .649 2.405 80.111
14 .629 2.331 82.442
15 .579 2.145 84.587
16 .541 2.005 86.592
17 .511 1.893 88.485
18 .435 1.610 90.096
19 .417 1.544 91.639
20 .373 1.382 93.022
21 .364 1.350 94.371
22 .353 1.308 95.679
23 .288 1.065 96.744
24 .243 .900 97.645
25 .237 .879 98.523
26 .221 .818 99.341
27 .178 .659 100.000
Extraction Method: Principal Component Analysis.
Model strength is 73.597. The proposed model is accepted.
Table :17: Component Transformation Matrix
Component 1 2 3 4 5 6
1 .705 -.367 .502 -.180 .151 .248
2 .268 .604 .095 .510 .542 -.023
3 -.551 -.144 .743 .336 -.010 .098
4 .113 -.639 -.305 .655 .083 -.224
5 .226 .214 -.050 .404 -.701 .496
Table :18: Factors Influencing Online Shopping
Sr.No. Statements Factors
1 2 3 4 5 6
1. Product exchange involves
cumbersome process .769
2. I am very keen to adopt new things .714 3. I feel internet has made life easy .698 4. Internet facility is blessing in case of
emergencies .684
5. I does surfing conveniently .675
6. I enjoy surfing net in order to
explore new things .613
7. Internet act as a very common communication media among youngsters
.576
8. The company may charge more than
, what is the actual price .689
9. Online shopping facilitates product
comparison .679
10. Online buying information is clear,
precise and easy to understand .678
11. Online buying provides more reliable and varied information easily
-.648
12. Prices offered through online shopping is less than the traditional shops
.621
13. I prefer cash payment instead plastic
money .565
14. There may be difference in the
quality ordered and received .767
15. Possibilities of getting cheated is
more in case of online shopping .705
16. It is very difficult to exchange the
product in case of defects .662
17. Online shopping includes risk factors .592
18. Goods may get damaged, during
transportation .531
19. Online shopping showcases variety
of products and brands .768
20. Online shopping is very easy .697
21. Online shopping saves time .651
22. It is very convenient to depend on
online shopping .527
discounts and gifts than the traditional shopping
24. Online ordering layout is easy and
convenient .682
25. Internet is very convenient in
providing the information .570
26. Cash on delivery is not available in
maximum occasions .603
27. Possibilities of receiving the product late is a common problem in case of online shopping
.598
Extraction Method: Principal Axis Factoring ,Rotation Method: Varimax with Kaiser Normalization. Source: Primary Data
In total 33 items were considered for the study in the initial stage. After iteration 6 items were dropped due to their redundancy nature. The 27 items considered converged into 6 factors. These can be called as 6 variables which analysis the consumer behavior with respect to cyberspace shopping. Factor 1 was loaded with 7 items. These items were related to the attitude of consumer with respect to internet usage. So the Factor 1 is labeled as ‘Internet Perceptions‘. Factor 2 loaded on 6 items, related to attitude of consumer in using online shopping. ‘E-shopping perception’. Hence factor 2 is labeled as
‘E-shopping perception’. Factor 3 was loaded with 5 items and it was related to the questions with respect to the perceived risk factors , and it was labeled as ‘Perceived Risk’ . Factor 4 was questions related to online shopping benefits, and the variable is named as ‘Convenience’. Factor 5 was questions related to cyber space benefits in online shopping and the variable is named as ‘Benefits’ and was loaded with 3 items. Factor 6 got loaded with 3 items and the questions were related to payment and the variable is named as ‘Payment Issues’.
Internet Perceptions (7 items) C o n su m e r B e h av io u r w ith re sp e ct to C yb e r Sp ac e S h o p p in g E-shopping perception (6 items) Perceived Risk (5 items) Convenience (4 items) Benefits (3 items) Payment Issues (2 items)
Consumer Behaviour-Online Shopping Demographic
Variables
Internet Perception
E-shopping perception
Perceived Risk
Convenience
Benefits
Payment Issues
CONCLUSION
Study showed that the consumer behavior with respect to online shopping is dependent of 6 main factors , namely ‘Perceived Risk’, ‘Internet Perception, ‘E-Shopping Perception’, ‘Convenience’ ,’Benefits’ and ‘Payment Issues’. Under the demographic variables, age and education level influences the online shopping perception. Maximum respondents were under the age category of less than 25. It shows that maximum were youngsters. Youngsters are very keen to experiment and embrace new technologies and techniques. So marketers should focus on how to reduce risk in online shopping. Providing an information navigation facility based on such risk-reduction strategies , such as money-back guarantee, cash on delivery option, timely delivery of goods, desirable purchasing experience etc. decreases consumers perceived risk and increase their purchase on the cyberspace.
LIMITATION OF THE STUDY
Study was limited to Nagpur only. Sample Size was small. FUTURE RESEARCH
The same topic can be studied by taking more sample size and more variables. You can study which factor is the more influencing one, in online shopping decision. Can be carried out as a national study, and also as International study , by having a comparison with respondents of other countries also.
REFERENCES:
Aioa ,O,Cass,Tino, Feneeh(2005), Literaturederived reference models for the adoption on online
shopping information & Management,No.42,P543-559
Bellman, Lohase,G & Johnson,E.(1999),Predictors of online shoppingbehaviour,Communication
of the ACMNo.42(12).P32-38
Corbitt, B. J., Thanasankit, T. & Yi, H. (2003). Trust and e-commerce: a study of consumer perceptions. Electronic Commerce Research and Applications. 2(3), 203-315. http://dx.doi. org/10.1016/S1567-4223(03)00024-3
Hernández, B., Jiménez, J. & Martín, M. J. (2010). Customer behavior in electronic commerce:
The moderating effect of e-purchasing experience. Journal of Business Research, 63 (9-10), 964– 971. http://dx.doi.org/10.1016/j.jbusres.2009.01.019
Chaffey, D., Johnston, K., Ellis-Chadwick, F. & Mayer, R. (2006). Internet Marketing.Strateg
y,Implementatiton and Practice. New York: Pearson Education.
InternetWorldStats. (2012) World Internet Users and Population Stats. Retrieved September
20, 2012 from http://www.Internetworldstats.com/stats.htm
Porter, M. E. (2001) Strategy and the Internet. Harvard Business Review, 79(3), 62-78.
Ramanathan, R., Ramanathan, U. & Hsiao, H.-L. (2012). The impact of e-commerce on
Taiwanese SMEs: Marketing and operations effects. International Journal of Production Economics. 140(2), 934–943. http://dx.doi.org/10.1016/j.ijpe.2012.07.017
Ranchhod, A. (2004). Marketing Strategies: A Twenty-first Century Approach. Harlow:
PrenticeHall.
Roberts, M. L. (2008). Internet marketing: integrating online and offline strategies. Mason:
Thomson.Sung, T. K. (2006). E-Commerce critical success factors: East vs. West. Technological Forecasting and Social Change, 73(9), 1161-1177.
http://dx.doi.org/10.1016/j.techfore.2004.09.002
Tao, Z., Li, Z. & Dingjun, Ch. (2011). The Predicting Model of E-commerce Site Based on the Ideas
of Curve Fitting. 2011 International Conference on Physics Science and Technology (ICPST 2011), 22, 641-645. http://dx.doi.org/10.1016/j.phpro.2011.11.099
The Nielsen Company. (2008) Over 875 Million Consumers have Shopped Online - the Number of
Internet Shoppers up 40% in Two Years. Retrieved September 15, 2012 from http://nz.nielsen.com/news/OnlineShopping.shtml
Zott, Ch., Amit, R. & Donley, J. (2000). Strategies for Value Creation in E-Commerce: Best Practice
in Europe. European Management Journal, 18(5), 463-475. http://dx.doi.org/10.1016/S0263-2373(00)00036-0
Source.www.eMarketer.com