DOI: 10.1534/genetics.107.076422
Integrating Phylogenetic and Population Genetic Analyses of Multiple Loci
to Test Species Divergence Hypotheses in Passerina Buntings
Matt D. Carling*
,†,1and Robb T. Brumfield*
,†*Museum of Natural Science and†Department of Biological Sciences, Louisiana State University, Baton Rouge, Louisiana 70803 Manuscript received May 23, 2007
Accepted for publication October 20, 2007
ABSTRACT
Phylogenetic and population genetic analyses of DNA sequence data from 10 nuclear loci were used to test species divergence hypotheses within Passerina buntings, with special focus on a strongly supported, but controversial, sister relationship betweenPasserina amoena and P. caeruleainferred from a previous mitochondrial study. Here, a maximum-likelihood analysis of a concatenated 10-locus data set, as well as minimize-deep-coalescences and maximum-likelihood analyses of the locus-specific gene trees, recovered the traditional sister relationship betweenP. amoenaandP. cyanea. In addition, a more recent divergence time estimate betweenP. amoenaandP. cyaneathan betweenP. amoenaandP. caeruleaprovided evidence for the traditional sister relationship. These results provide a compelling example of how lineage sorting stochasticity can lead to incongruence between gene trees and species trees, and illustrate how phylo-genetic and population phylo-genetic analyses can be integrated to investigate evolutionary relationships between recently diverged taxa.
I
NFERRING the species tree of recently diverged taxa can be a challenging exercise (Maddison 1997; Felsenstein 2004; Maddison and Knowles 2006). The difficulty arises in part because the stochastic sort-ing of ancestral polymorphisms after speciation can re-sult in gene trees that are discordant with species trees (Pamilo and Nei 1988; Takahata 1989; Maddison 1997; Rosenberg2002, 2003; Maddisonand Knowles 2006). For recently diverged taxa that have not yet at-tained complete reproductive isolation, gene flow intro-duces another source of discordance between the gene trees and the species tree (Takahataand Slatkin1990; Takahata1995; Wakeley1996; Wakeleyand Hey1998). The impact of these processes on species tree reconstruc-tion has long been recognized (Gillespieand Langley 1979; Neiand Li1979), but it is only recently that a model-based phylogenetic framework has integrated one of them (ancestral sorting) into the species tree inference. Because postspeciation, interspecific gene flow has yet to be incor-porated into a phylogenetic framework, nonphylogenetic methods must be used to infer species relationships in-directly. Here, phylogenetic and divergence population genetic analyses of a multilocus nuclear data set are used to examine a controversial sister species relationship in Passerina buntings.Over most of its taxonomic history, the genus Passerina (Aves: Cardinalidae) has been composed of six species of small (13–20 g), sexually dichromatic songbirds. The
collective breeding ranges of these species encompass most of Mexico, the United States, and southern Canada (Figure 1 and supplemental Figure 1 at http://www. genetics.org/supplemental/). Within the genus,Passerina cyaneaandP. amoenahave typically been considered sis-ter species because they are morphologically similar and form a well-known hybrid zone where their breeding dis-tributions overlap in the western Great Plains and east-ern foothills of the Rocky Mountains in North America (Sibleyand Short1959; Emlenet al.1975; Kroodsma 1975; Bakerand Baker1990; Bakerand Boylan1999). While the monophyly of Passerina has never been ques-tioned (Hellackand Schnell1977; Tamplinet al.1993), there have been attempts to subsumeGuiraca caeruleaand some species of the genus Cyanocompsa into the genus (Phillipset al.1964; Blake1969; Mayrand Short1970; Paynter1970).
Klickaet al.(2001) addressed the evolutionary rela-tionships of the traditional six-member genus and closely related species, includingG. caeruleaand three Cyano-compsa species, using 1143 bp of sequence data from the mitochondrial cytochrome b gene. An unexpected re-sult of the study was thatP. amoenaandP. cyanea, the two morphologically similar species that form a hybrid zone in the Great Plains, were not sister species. Instead G. caerulea(hereafter,P. caerulea) was sister toP. amoena, a relationship that had never before been hypothesized.P. cyaneawas placed as the most basal member of the now seven-member genus. As expected, the three Cyano-compsa species fell outside of Passerina.
The branching structure of the mitochondrial tree and the demography of Passerina buntings suggest that the unexpectedP. amoena/P. caeruleasister relationship Sequence data from this article have been deposited with the EMBL/
GenBank Data Libraries under accession nos. EU191758–EU191837.
1Corresponding author: Museum of Natural Science, 119 Foster Hall,
Baton Rouge, LA 70803. E-mail: [email protected]
could reflect discordance between the mitochondrial gene tree and the species tree. The internodes in the mitochondrial phylogeny are short, possibly indicating rapid divergences, and the population sizes for some of the species, includingP. cyanea,P. amoena, andP. caerulea, are large—on the order of tens of millions of individuals (Payne1992; Greeneet al.1996). This combination of short internodes and large population sizes is among the most difficult scenarios for inferring phylogenies from single locus data sets given the elevated risk of dis-cordance between a species tree and its underlying gene trees (Figure 2). Using the calculation of Heinet al.(2005) for the probability of species tree/gene tree discordance and realistic parameter estimates for Passerina buntings, the probability of discordance is estimated to be as high as 55% (seeComparing mtDNA and nuclear DNA signalsin discussion).
Here, phylogenetic and divergence population ge-netics methods are used to test speciational hypotheses in Passerina buntings, with special focus on the contro-versial sister relationship uncovered by the mitochon-drial study. Using the Passerina data set, the utility of combining phylogenetic and population genetics meth-ods to uncover the evolutionary history of closely related species where hybridization may complicate evolution-ary history is examined. Specifically, support for the following two alternative hypotheses was assessed:
Hypothesis 1:P. cyanea andP. amoenaare more closely related to each other than either is toP. caerulea. This is the traditional sister relationship.
Hypothesis 2:P. amoenaandP. caeruleaare more closely related to each other than either is toP. cyanea. This is the sister relationship found in the mitochondrial tree.
MATERIALS AND METHODS
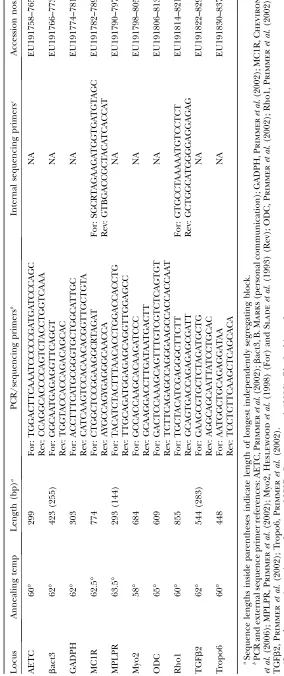
Sampling, amplification, and sequencing: From museum collections we obtained vouchered frozen tissue samples from
two individuals of each focal species,P. cyanea,P. amoena, and P. caerulea(seeappendixfor sampling localities). We also in-cluded one individual from two additional species:P. rositae andCyanocompsa cyanoides. C. cyanoidesis a member of a genus closely related to Passerina (Klickaet al.2001) and was included here as an outgroup. We extracted total DNA from25 mg of pectoral muscle using a DNeasy tissue kit (QIAGEN, Valencia, CA), following the manufacturer’s recommended protocol. Each individual was amplified at 10 nuclear loci (Table 1) using the following PCR conditions in a 25ml amplification reaction:50 ng template DNA (2.5ml of QIAGEN DNA ex-tracts), 1ml of 10 mmdNTPs (2.5 mmeach dATP, dTTP, dCTP, and dGTP), 1ml of each primer (10 mm, Table 1), 2.5ml 103 buffer with MgCl2(15 mm), 0.1ml Taq (5 units/ml AmpliTaq
DNA polymerase, Applied Biosystems, Foster City, CA), and 16.9ml sterile dH2O. The thermocycling profile was as follows:
an initial 95° denaturation for 2 min followed by 35 cycles consisting of a 30-sec, 95°-denaturation step, a 30-sec, locus-specific temperature primer annealing step (Table 1), and a 2-min, 72°-extension step, and a final extension of 5 min at 72°. We checked for amplification by electrophoresing 2.5ml of each PCR amplicon on a 1% agarose gel and then used 20% polyethylene glycol (PEG) to purify the remaining 22.5ml of the PCR product from successful amplifications.
Both strands of the PEG-purified PCR amplicons were cycle-sequenced using 1.5ml of 53sequencing buffer (Applied Bio-systems), 1ml of 10 mmprimer, 2–3ml template (depending on the intensity of the PCR bands on the agarose gels), 0.5ml Big Dye Terminator cycle-sequencing kit v 3.1 (Applied Biosystems), and 1–2ml sterile dH2O (depending on amount of template
added), for a total volume of 7ml. The longer loci were also cycle-sequenced with internal sequencing primers using the same protocol (Table 1). We cleaned cycle-sequencing prod-ucts on Sephadex (G-50 fine) columns and electrophoresed the cleaned products on a 3100 Genetic Analyzer (Applied Biosystems). In those cases where direct sequencing of puri-fied PCR amplicons revealed more than one heterozygous site within a sequence, we phased the haplotypes by cloning the PCR products using the TA Topo cloning kit according to the manufacturer’s instructions (Invitrogen, Carlsbad, CA) and se-quencing five clones. All sequences were edited and assembled using Sequencher v 4.1 and 4.6 (GeneCodes, Ann Arbor, MI).
Phylogenetic analyses: Sequence alignments of all 10 nu-clear loci were unambiguous and checked visually. In all phy-logenetic analyses, gaps were alternately classified as a fifth state or as missing data. Phylogenetic analyses were conducted on a concatenated data set since partition homogeneity tests revealed
Figure1.—Breeding distributions ofPasserina
amoena, P. cyanea, and P. caerulea. Digital maps
(Ridgelyet al.2003) for each species were
no significant conflicts between the data from each of the in-dividual loci. Tests for recombination (seePopulation genetic analysesbelow) indicated that three loci (bact3, MPLPR, and TGFb2) had undergone recombination. Therefore, phylogenetic analyses were conducted on both the entire concatenated data set (5232 bp) and on a reduced concatenated data set contain-ing only the largest independently segregatcontain-ing block of se-quence forbact3, MPLPR, and TGFb2 (4668 bp). Using PAUP* v 4.0b10 (Swofford1998) we estimated a neighbor-joining tree from thep-distance matrix and calculated likelihood scores on a series of nested substitution models. These were then eva-luated using ModelTest v 3.8 (Posadaand Crandall1998). Due to its advantages over hierarchical likelihood-ratio tests
(Posadaand Buckley2004), we used the Bayesian Information
Criterion (BIC) to determine the best-fit model of sequence evolution for the concatenated data set as well as for each locus independently (Table 2).
To investigate species-level relationships between these taxa we conducted a variety of phylogenetic analyses on the concat-enated data set using the model of sequence evolution iden-tified by ModelTest v 3.8. First, we analyzed an 8-terminal-taxa data set composed of sequence data from either one (P. rositae andC. cyanoides) or two individual(s) per species (P. cyanea, P. amoena, andP. caerulea) where double peaks in chromatograms were inferred to be heterozygous sites and coded as polymor-phisms using the standard IUPAC degeneracy codes. Second, we analyzed a 16-terminal-taxa data set that consisted of two phased haplotypes, determined by sequencing cloned PCR products from each individual for a total of four sequences per species ofP. cyanea,P. amoena, andP. caeruleaand two sequences per species forP. rositaeandC. cyanoides. These data sets of concatenated sequences will be referred to hereafter as the 8-terminal-tip data set and the 16-terminal-tip data set.
Using parameters estimated on a neighbor-joining tree
(Saitouand Nei1987), we used PAUP* v 4.0b10 (Swofford
1998) to perform heuristic searches½tree bisection–reconnection (TBR) branch swapping; 10 random-addition replicatesunder the maximum-likelihood (ML) optimality criterion for both the 8- and 16-terminal-tip concatenated data sets. We assessed nodal support using 100 ML heuristic bootstrap replicates with
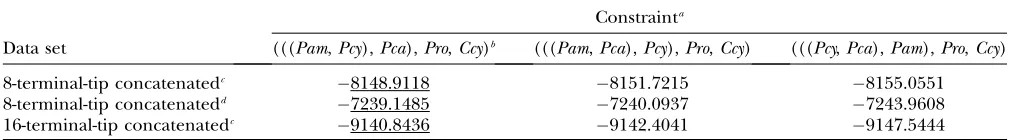
the search parameters described above. We also performed a variety of constrained ML searches (Table 3) on the 8- and 16-terminal-tip data sets using the sequence evolution model and search parameters, except without bootstrap replicates, as described above. Using a Shimodaira–Hasegawa test (SH)
(Shimodairaand Hasegawa1999) with full optimization and
1000 bootstrap replicates, we assessed whether the likelihoods of the unconstrained and constrained trees were significantly different.
We also assessed nodal support for the 8- and 16-terminal-tip topologies using posterior probabilities generated using MrBayes v 3.1.2 (Huelsenbeckand Ronquist2001; Ronquist and Huelsenbeck2003). We used the same general model (GTR1I) as in the ML searches and uninformative priors and ran two replicate analyses of four Markov chains for 1,000,000 generations. Additionally, we ran a mixed-model analysis using MrBayes in which the 8-terminal-tip concatenated data set was partitioned into the 10 individual loci, each partition with the appropriate model of sequence evolution (Table 2). In both the one-model and mixed-model searches, we sampled trees every 100 generations and calculated final posterior probabil-ities after excluding the first 250,000 generations as burn-in. Plots of likelihood scores during the run were examined visu-ally to insure stationarity had been reached. In all searches, the average standard deviation of split frequencies was,0.005, fur-ther evidence stationarity had been reached.
Minimize-deep-coalescences analyses:Because well-supported species trees inferred from concatenated data sets can be dis-cordant with the true species tree, especially if the species diver-gence was recent (Degnanand Rosenberg2006; Edwardset al. 2007; Kubatkoand Degnan2007), we inferred a species tree us-ing a method that considers the individual gene histories. Spe-cifically, we assessed the fit of the gene trees onto three possible rooted species trees forP. cyanea,P. amoena, andP. caerulea, using the minimize-deep-coalescences method as implemented in the program Mesquite (Maddison1997; Maddisonand Knowles 2006). This method attempts to reconcile gene trees contained within species trees by minimizing the number of deep coales-cences, those cases where the coalescence of two gene copies pre-dates the speciation event. Using a parsimony optimality criterion,
Figure2.—The
the ‘‘best’’ species tree is the one that requires the fewest deep-coalescent events in contained gene genealogies. The number of deep-coalescent events, or costs, can be summed across multiple markers to accommodate multilocus data sets. Using Mesquite
(Maddisonand Maddison2004), we compared the fit of the
genealogies from each locus into the possible species trees using methods slightly modified from the recently described method
of Maddisonand Knowles(2006).
We used MrBayes v 3.1.2 (Huelsenbeckand Ronquist2001;
Ronquistand Huelsenbeck2003) to sample the tree space
of the gene trees for each locus independently, using com-pletely phased haplotypes and the same model parameters with uninformative priors as in the ML tree searches and the same MrBayes run parameters as described above. After discard-ing the first 250,000 generations as burn-in, we used PAUP* to calculate a majority-rule consensus gene tree from each locus-specific search. We then overlaid each unrooted locus-locus-specific gene tree onto the three possible species trees (Table 3) and tallied the number of deep- coalescent events required to rec-oncile the gene trees with the species trees. The total cost of each species tree was determined by summing the locus-specific tallies (Table 4), with the species tree having the lowest cost being inferred as the correct species tree.
Calculating probabilities of gene trees given possible species trees:Recent software developments give researchers increased ability to evaluate the variation in lineage sorting among loci and how it influences phylogenetic inferences. The program COAL (Degnanand Salter2005), which extends earlier work (Takahataand Nei1985; Rosenberg2002), can calculate the probability of a gene tree given a species tree for any number of taxa. This represents a significant step toward developing a method capable of estimating the likelihood of sequence data given a species tree, which can be estimated as follows:
Y
loci X
gene trees
½Pðsequencesjgene treeÞ
3Pðgene treejspecies treeÞ
(Maddison1997). The first probability statement is analogous
to the log-likelihood scores generated by phylogenetic infer-ence software packages such as PAUP* (Swofford1998). The program COAL can calculate the second probability statement. Unfortunately, complete evaluation of the above equation is
TABLE 2
Summary of model parameters used in all phylogenetic analyses as determined by the Bayesian information criterion (BIC) as implemented in ModelTest 3.8 (POSADAand CRANDALL1998)
Data set Model Base frequenciesa ti/tv ratio Rate matrixb Pinv
AETC K80 Equal 5.831036 — —
bact3 K80 Equal 6.131036 — —
GADPH JC Equal — — —
MC1R F81 0.1533, 0.3795, 0.2348, 0.2304 — — —
MPLPR F81 0.2097, 0.2600, 0.3476, 0.1827 — — —
Myo2 JC Equal — — —
ODC F81 0.2790, 0.1677, 0.2127, 0.3406 — — —
Rho1 JC Equal — — —
TGFb2 JC Equal — — —
Tropo6 F81 0.1959, 0.2227, 0.1714, 0.4057 — — —
8-terminal-taxac K81uf1I 0.2231, 0.2429, 0.2462, 0.2876 — 1.0, 4.424, 1.8284, 1.8284, 4,424, 1.0 0.9295
16-terminal-taxac K81uf1I 0.2364, 0.2287, 0.2616, 0.2633 — 1.0, 7.150, 2.243, 2.243, 7.150, 1.0 0.9307
aOrder of base frequencies is A, C, G, T.
bOrder of rate matrix is A to C, A to G, A to T, C to G, C to T, and G to T. cThese data sets contain the concatenated sequences from all 10 loci.
TABLE 3
Likelihood scores for various topological constraints
Constrainta
Data set (((Pam,Pcy),Pca),Pro,Ccy)b (((Pam,Pca),Pcy),Pro,Ccy) (((Pcy,Pca),Pam),Pro,Ccy)
8-terminal-tip concatenatedc 8148.9118 8151.7215 8155.0551
8-terminal-tip concatenatedd 7239.1485 7240.0937 7243.9608
16-terminal-tip concatenatedc 9140.8436 9142.4041 9147.5444
Likelihood scores (lnL) were estimated using a heuristic search (TBR branch swapping, 10 random addition replicates). Under-lining indicates topology with greatest likelihood. The constraint trees are also the species toplogies used in the minimize-deep-coalescences (Maddisonand Knowles2006) and COAL analyses (Degnanand Salter2005).
a
Species name abbreviations:Pam,P. amoena;Pcy,P. cyanea;Pca,P. caerulea;Pro,P. rositae;Ccy,Cyanocompsa cyanoides.
b
This was also the topology recovered in all the unconstrained searches, which also gave identical lnLscores.
c
These data sets included all sequence data from all loci.
d
hampered because the summation step requires summing over all possible gene trees, which includes both topology and branch lengths (Maddison1997). Currently, no method is capa-ble of performing that summation because of the near infinite number of possible gene trees. It will likely require a method that employs some type of importance sampling of the gene tree space to effectively evaluate that step of the overall equa-tion ( J. Degnan, personal communication).
In light of the current methodological limitations, we focused on calculating the conditional probability of a gene tree given a species tree. Locus-specific gene trees were inferred in three ways. First, we randomly chose a single individual to represent P. amoena,P. cyanea, andP. caerulea, which along with one in-dividual from each outgroup taxon (P. rositaeandC. cyanoides), resulted in a data set with five terminal tips. For each locus, we estimated a gene tree under the maximum-likelihood search criterion as described above and then used COAL to calculate the probability of each ML gene tree given three possible spe-cies trees (Table 3) using COAL. ML inferences for Tropo6 produced.100 equally likely gene trees and so we eliminated Tropo6 from the COAL analysis.
We also inferred locus-specific gene trees from the 8-terminal-tip data set. Since COAL requires fully resolved bifurcating gene trees and since locus-specific ML searches of this 8-terminal-tip data set produced numerous equally likely topologies with un-resolved polytomies, we inferred locus-specific neighbor-joining gene trees, using uncorrectedp-distances. In the Tropo6 data set, some of the sequences were identical across individuals. Accordingly, neighbor-joining analyses failed to produce a fully resolved tree for Tropo6 and we excluded it from COAL calculations.
In an attempt to incorporate a larger sample of the possible gene topologies and branch lengths, we sampled a collection of gene trees from the locus-specific Bayesian tree searches described above (seeMinimize-deep-coalescences analyses). Our approach was to calculate the probability of each of the three possible species trees (Table 3) given each of the last 1000 gene trees from the Bayesian searches, using COAL, and average the probabilities of those gene trees to generate a more robust estimate of the likelihoods of the three species trees. Unfor-tunately, in each locus-specific Bayesian tree search some gene trees contained unresolved polytomies, which COAL cannot
handle; therefore, we abandoned this method of inferring gene trees.
We replicated the COAL calculations, for both the five- and eight-terminal tip data sets, using three different internal: terminal branch-length ratios (1:1, 1:2, and 1:10). All internal: terminal branch-length ratios, with the exception of 1:1, cor-respond to topologies with internode lengths that are short, relative to the terminal branches, which appears to be the general pattern observed in Passerina buntings. To assess the difference in probabilities of the gene trees if the species tree unitedP. cyaneaandP. amoenaas sisters (hypothesis 1) with one in whichP. caeruleaandP. amoenawere sisters (hypothesis 2), we conducted a test of proportions (Sokaland Rohlf1995) whereby we tallied the number of gene trees that were more probable under hypothesis 1 and compared that with a tally of the number of gene trees that were more probable under hy-pothesis 2.
Population genetic analyses: Both phylogenetic methods described above assume that discordance between gene trees and the species tree is due to genetic drift (i.e., lineage sorting stochasticity). Because of the well-documented hybrid zone betweenP. amoenaandP. cyanea, it would be ideal if a gene flow parameter could be incorporated into the phylogenetic anal-ysis. This is not currently possible. We thus examined the utility of divergence population genetics for inferring species rela-tionships indirectly. The Isolation with Migration (IM) soft-ware package (Heyand Nielsen2004; Hey2005) can estimate pairwise divergence times betweenP. cyanea, P. amoena, and P. caerulea, while jointly estimating pairwise migration rates. A sister relationship is inferred to be between the species with the most recent divergence estimate.
IM combines coalescent theory with Bayesian methodologies to simultaneously estimate multiple population genetic param-eters for two diverging populations. Briefly, using a Markov chain Monte Carlo (MCMC) approach, IM generates posterior probability distributions of six parameters (upopulation1,upopulation2, uancestral,m1,m2,t). These parameters can then be used to
cal-culate population demographic estimates,i.e., effective popula-tion sizes of the two populapopula-tions (Ne1andNe2), the ancestral
population size (i.e., the population size prior to initial di-vergence¼NeA), migration rates between the two populations
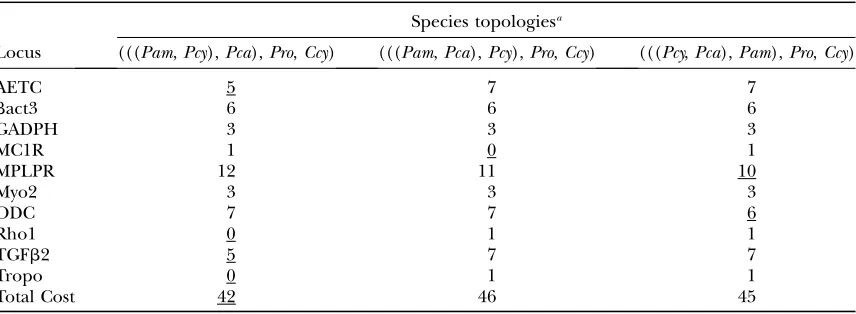
(m1andm2, which allows for asymmetrical migration rates), TABLE 4
Deep coalescent events required to reconcile unrooted locus-specific gene trees, inferred using Bayesian tree searches, with three possible species topologies
Species topologiesa
Locus (((Pam,Pcy),Pca),Pro,Ccy) (((Pam,Pca),Pcy),Pro,Ccy) (((Pcy,Pca),Pam),Pro,Ccy)
AETC 5 7 7
bact3 6 6 6
GADPH 3 3 3
MC1R 1 0 1
MPLPR 12 11 10
Myo2 3 3 3
ODC 7 7 6
Rho1 0 1 1
TGFb2 5 7 7
Tropo 0 1 1
Total Cost 42 46 45
Underlining indicates species topology with fewest deep coalescent events for each locus as well as for the lowest total summed over all locus-specific gene trees.
a
and the time since divergence of the two populations (t). A more recent version of IM (Hey2005) also allows for the in-clusion of a population splitting parameter,s, which allows for exponential population growth or decline in each descendant population.
IM assumes selective neutrality of each marker and no in-tralocus recombination. We tested for neutrality by calculating Tajima’sD(Tajima1983) for each locus using Arlequin v 3.0
(Excoffieret al.2005). None of the 10 loci showed a
signif-icant departure from neutrality (eachP.0.25). To investigate intralocus recombination, we used TOPALi v 2 (McGuireand
Wright1998, 2000), which uses a sliding-window approach to
search for putative recombination breakpoints along an align-ment of DNA sequences. Using the difference in sum-of-squares (DSS) method, with a 100-bp window and a 10-bp increment, we looked for signals of recombination, manifested by a signif-icant DSS peak along the sequence alignment. The statistical significance of DSS peaks was assessed using 100 parametric bootstraps. Significant DSS peaks were detected in 3 loci,bact3, MPLPR, and TGFb2 (Table 1). For each of those 3 loci, we only included the longest independently segregating block of se-quence from the phased haplotype data in the IM runs along with the total available phased haplotype sequences from each of the other seven markers.
Using IM, we estimated three pairwise divergence times, one betweenP. cyaneaandP. amoena, one betweenP. caeruleaand P. amoena, and one betweenP. cyaneaandP. caerulea. Initial IM runs, conducted using the infinite sites (IS) model (Kimura 1969) and employing unrealistically large maximum priors (t¼20,q1¼q2¼qa¼500,m1¼m2¼50, orm1¼m2¼0 for
parameter estimation without gene flow) were used to estab-lish appropriate parameter priors for all subsequent analyses (Wonand Hey2005). Once appropriate priors were identi-fied, we ran IM three times with identical starting conditions, with the exception of the random number seed, to assess con-vergence. All runs began with a burn-in period of 100,000 steps and were allowed to continue until the minimum effective sample size (ESS) was.100 (Hey2005). Because runs with the same starting conditions produced qualitatively similar results, we only present data from the longest run (.33109steps). For each pairwise estimate of divergence time, we performed a variety of IM analyses with varying numbers of parameters. The simplest model included four parameters (u1,u2,uA, andt);
other models included five (u1, u2, uA, t, and m—equal
mi-gration between populations oru1,u2,uA,t, ands—allowing for
population growth) or six parameters (u1, u2,uA,t, m1, and m2—allowing for different, directional migration between
pop-ulations). All model parameter estimates in IM are scaled to the mutation rate,m. To translate scaled divergence time esti-mates to real time, we included mutation rates for each locus calculated as the sequence length multiplied by 3.6 3109 substitutions/site/year (Axelssonet al.2004).
RESULTS
Phylogenetic analyses:Maximum-likelihood analysis of the entire concatenated 8-terminal-tip data set, based on 5232 bp of sequence data from each individual, pro-duced one strongly supported tree (Figure 3A). In it, the traditional sister relationship betweenP. amoenaand P. cyanea(hypothesis 1) was recovered. This unconstrained tree was more likely than either of the constrained topolo-gies, regardless of the data set, although the differences in likelihood scores were not significant (SH test,P.0.05, Table 3). Support values from ML bootstrap analyses and
Bayesian posterior probabilities, calculated under a sin-gle model of sequence evolution for the entire data set, indicated the topology recovered in the unconstrained searches was relatively well supported (Figure 3). The Bayesian analysis of the 8-terminal-tip data set using a mixed model, in which a sequence evolution model was specified for each locus, uncovered the same topology as the Bayesian analysis of the 16-terminal-tip data set (Figure 3, B and C). All of the above phylogenetic ana-lyses were rooted usingC. cyanoidesas an outgroup. Rep-licate analyses with the reduced concatenated data set (4668 bp) produced the same topologies as the entire con-catenated data set (Figure 3A).
Phylogenies inferred from the 16-terminal-tip data set were also similar to the ML and Bayesian phylogenies
Figure3.—Species trees inferred from the entire
concate-nated data set (5332 bp), except where noted. In all phyloge-nies, multiple sequences from each species were collapsed into a single ‘‘representative.’’ Only bootstrap support values
inferred from the 8-terminal-tip data set (Figure 3). Both, ML and Bayesian, 16-terminal-tip phylogenies con-tained a well-supported sister clade between P. cyanea andP. amoena.The placement ofP. caeruleawith respect toP. rositaeand theP. cyanea/P. amoenaclade varied de-pending on the data set, 8- or 16-terminal tip, used to infer the phylogeny. Both ML and Bayesian inferences uncovered a weakly supported clade containingP. cyanea, P. amoena, andP. caerulea, when tree searches were con-ducted on the 8-terminal-tip data set. When based on the 16-terminal-tip data set, both analyses recovered a sister relationship betweenP. rositaeandP. caerulea, and that clade was sister to theP. cyanea/P. amoenaclade (Fig-ure 3C).
The topologies inferred from the tree searches of the concatenated data sets did not differ when gaps were coded as missing data or as a fifth state (topologies not shown).
Minimize-deep-coalescences analyses:Overlaying the majority-rule consensus gene trees from the Bayesian tree searches on the three possible species trees resulted in three different deep coalescent costs for each gene— one cost for each species tree (Table 4). For four locus-specific gene trees (AETC, Rho1, TGFb2, and Tropo6) the fewest number of deep coalescent events were ob-served when the species topology unitedP. amoenaand P. cyanea as sister species. The fewest deep coalescent events for one locus (MC1R) occurred whenP. amoena and P. caeruleawere sister species, and the P. cyanea/ P. caeruleasister species tree contained the fewest deep coalescences when overlaid with the ODC and MPLPR gene trees.
Summing the number of deep coalescent events needed to fit the gene trees into the species tree across loci produced a total cost of 42 for theP. amoena/P. cyanea sister species tree (Table 4). Fitting the gene trees into the other two species trees required more deep coales-cences: 46 for theP. amoena/P. caeruleatree and 45 for the P. cyanea/P. caeruleatree.
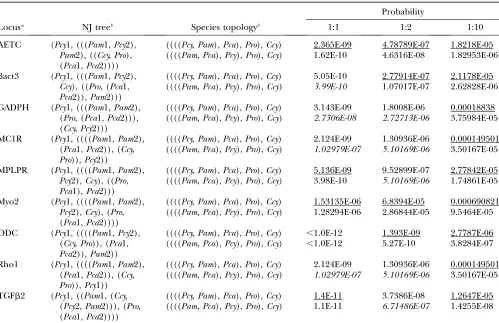
Calculating probabilities of gene trees given possible species trees: After randomly choosing one individual to representP. amoena,P. cyanea, andP. caerulea, and elim-inating Tropo6 from further analyses, 14 ML gene to-pologies were inferred from phylogenetic tree searches conducted on each locus separately (Table 5). Multiple gene trees with equal likelihoods were inferred from three loci (AETC—three gene trees,bact3—two, and MPLPR— three). Replicate COAL calculations that differed only in the ratio of internal to terminal branch lengths (1:1, 1:2, and 1:10) all gave qualitatively similar results. When terminal branch lengths were longer than internal branch lengths (1:2 and 1:10), 3 of the 14 gene topologies were equally probable whether the given species tree had P. cyaneaandP. amoenaas sister species or a sister species relationship betweenP. amoenaandP. cyanea(Table 5). Those 3 gene topologies (one of twobact3 gene trees and two of three MPLPR gene trees) were excluded from
further analyses, because with respect to these relation-ships, these topologies are uninformative. Of the remain-ing 9 ML gene topologies (one of the three equally likely AETC gene trees was chosen at random), 8 were more probable given a species tree uniting P. cyanea and P. amoenaas sisters, and 1 was more probable given a P. amoena–P. caeruleaspecies tree (Table 5, test of propor-tions,nobs¼9,P ¼0.05). When the internal:terminal branch length ratio was 1:1, 4 of the 14 gene topologies were equally probable given either species tree and were subsequently eliminated. Seven of the remaining 8 (1 AETC gene tree chosen at random) ML gene topologies were more probable with P. cyanea/P. amoena as sister species (Table 4, test of proportions,nobs¼8,P¼0.1). Nine gene topologies, one for each locus with the ex-ception of Tropo6, were inferred from the eight-terminal tip data set using neighbor-joining analyses (Table 6). In the COAL calculations with internal:terminal branch lengths of 1:1 and 1:2, there was no difference in the number of locus-specific gene topologies that were more probable withP. cyanea andP. amoenaas sisters in the species tree and the number of gene topologies that were more probable with aP. amoena/P. caeruleasister relation-ship (Table 6, test of proportions,nobs¼9,P .0.05). When the internal:terminal branch length ratio of the species trees was 1:10, all nine gene topologies were more probable when the species tree placed P. cyanea andP. amoenaas sisters (Table 6, test of proportions,nobs¼ 9,P¼0.02).
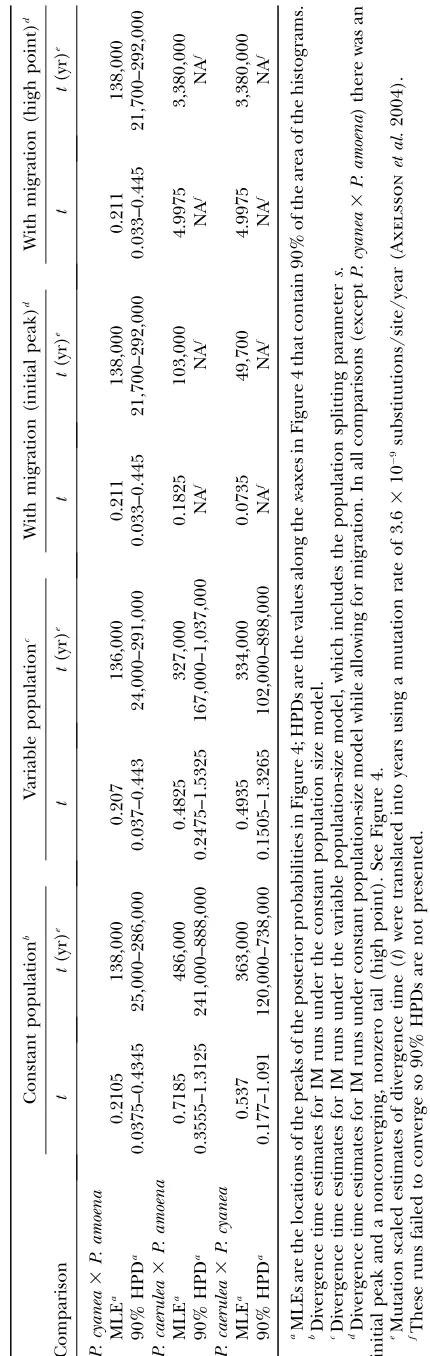
Population genetic analyses:After excluding all gaps in the sequence data and retaining only the largest independently segregating block of sequence for those loci that showed evidence of recombination, 4721 bp of sequence data were included in the IM analyses. When divergence times were estimated in the absence of mi-gration, analyses uncovered a more recent splitting be-tween P. cyanea and P. amoena than between either of those two species andP. caerulea(Figure 4A, Table 7). Estimates foru1,u2anduAwere inconclusive; the distri-butions of the posterior probabilities were nearly flat in all comparisons (data not shown). Allowing for growth or decline in the descendant populations did not quali-tatively alter the divergence time estimates for any of the pairwise comparisons; the most recent divergence was betweenP. amoenaandP. cyanea, with divergence times later for both theP. caerulea/P. amoenaandP. caerulea/ P. cyaneacomparisons (Table 7).
divergence time estimates using a model without migra-tion (0.2105; Table 7). For both theP. amoena/P. caerulea and P. cyanea/P. caerulea comparisons, the divergence time estimate with the highest posterior probability was 4.9975, much greater than the estimates in the absence of migration (0.7185 and 0.537, respectively; Table 7). However, each of the posterior probability distributions of divergence time estimates for theP. amoena/P. caerulea andP. cyanea/P. caeruleacomparisons, which never con-verged to zero, also had peaks much closer to the peak of theP. amoena/P. cyaneadistribution (Figure 4B, Table 7). Estimates of migration rates between the species varied. The posterior probability distributions ofm1andm2 be-tweenP. cyaneaandP. amoenawere flat, but nonzero (Fig-ure 4, C and D). In contrast, migration intoP. caerulea from bothP. cyaneaandP. amoenawas effectively zero (m2 in both comparisons, Figure 4D). However, the param-eter distributions for migration into P. cyanea and P. amoenafromP. caeruleaboth show evidence for nonzero
gene flow (Figure 4C). The posterior probability dis-tributions form1were also similar for both comparisons involvingP. caerulea, one peak at zero and a secondary, nonzero peak indicating gene flow into eitherP. cyanea orP. amoenafromP. caerulea(Figure 4C).
While the divergence time parameter estimates did change with the inclusion of the gene flow parameter (Figure 4 and Table 7), the data were not significantly more likely under the more complex model in any of the pairwise comparisons. In all three comparisons twice the difference between the likelihoods of the data under the complex model (allowing for directional migration) and the simple model (no migration) were less than the critical value (x¼5.991, d.f.¼2,P¼0.05)
DISCUSSION
Both phylogenetic and population genetic analyses of the 10-locus data set supported the traditional sister
TABLE 5
Probabilities of ML gene trees given two alternative species topologies with differing internal:terminal branch length ratios (1:1, 1:2, and 1:10)
Probability
Locusa ML gene treeb Species topologyb 1:1 1:2 1:10
AETC ((Pam,Pcy),((Ccy,Pca),Pro)) ((((Pcy,Pam),Pca),Pro),Ccy) 0.00082 0.00495 0.01511 ((((Pam,Pca),Pcy),Pro),Ccy) 0.00018 0.00199 0.01157 ((Pam,Pcy),((Pro,Ccy),Pca)) ((((Pcy,Pam),Pca),Pro),Ccy) 0.00082 0.00495 0.01511 ((((Pam,Pca),Pcy),Pro),Ccy) 0.00018 0.00199 0.01157 ((Pam,Pcy),(Ccy,(Pro,Pca))) ((((Pcy,Pam),Pca),Pro),Ccy) 0.01663 0.03091 0.02587 ((((Pam,Pca),Pcy),Pro),Ccy) 0.00366 0.01270 0.01997 bact3 ((((Pam,Ccy),Pcy),Pro),Pca) ((((Pcy,Pam),Pca),Pro),Ccy) 0.00000 0.00487 0.01103 ((((Pam,Pca),Pcy),Pro),Ccy) 0.00000 0.00191 0.00748 (((Pam,Ccy),(Pcy,Pro)),Pca) ((((Pcy,Pam),Pca),Pro),Ccy) 0.00002 0.00051 0.00647 ((((Pam,Pca),Pcy),Pro),Ccy) 0.00002 0.00051 0.00647 GADPH ((((Pam,Pcy),Ccy),Pca),Pro) ((((Pcy,Pam),Pca),Pro),Ccy) 0.00082 0.00487 0.01103 ((((Pam,Pca),Pcy),Pro),Ccy) 0.00018 0.00191 0.00748 MC1R (((Pam,Pca),Pcy),(Ccy,Pro)) ((((Pcy,Pam),Pca),Pro),Ccy) 0.01075 0.02075 0.02104 ((((Pam,Pca),Pcy),Pro),Ccy) 0.07336 0.07322 0.03321 MPLPR ((Pam,((Pro,Pca),Pcy)),Ccy) ((((Pcy,Pam),Pca),Pro),Ccy) 0.00059 0.00259 0.00532 ((((Pam,Pca),Pcy),Pro),Ccy) 0.00059 0.00259 0.00532 (((Pam,(Pro,Pca)),Pcy),Ccy) ((((Pcy,Pam),Pca),Pro),Ccy) 0.00059 0.00259 0.00532 ((((Pam,Pca),Pcy),Pro),Ccy) 0.00059 0.00259 0.00532 (((Pam,Pcy),(Pro,Pca)),Ccy) ((((Pcy,Pam),Pca),Pro),Ccy) 0.06330 0.05614 0.02232 ((((Pam,Pca),Pcy),Pro),Ccy) 0.01366 0.02188 0.01605 Myo2 (((Pam,Pcy),(Pro,Pca)),Ccy) ((((Pcy,Pam),Pca),Pro),Ccy) 0.06330 0.05614 0.02232 ((((Pam,Pca),Pcy),Pro),Ccy) 0.01366 0.02188 0.01605 ODC ((((Pam,Pcy),Pca),Pro),Ccy) ((((Pcy,Pam),Pca),Pro),Ccy) 0.40808 0.17006 0.02217 ((((Pam,Pca),Pcy),Pro),Ccy) 0.05686 0.04358 0.01230 Rho1 ((((Pam,Pcy),Pca),Pro),Ccy) ((((Pcy,Pam),Pca),Pro),Ccy) 0.40808 0.17006 0.02217 ((((Pam,Pca),Pcy),Pro),Ccy) 0.05686 0.04358 0.01230 TGFb2 ((((Pam,Pcy),Ccy),Pca),Pro) ((((Pcy,Pam),Pca),Pro),Ccy) 0.00082 0.00487 0.01103 ((((Pam,Pca),Pcy),Pro),Ccy) 0.00018 0.00191 0.00748
Underlining indicates probabilities that are greater with aP. amoena/P. cyaneaspecies topology than with aP. amoena/P. caerulea species topology. Italic numbers indicate the opposite pattern. All probabilities calculated using COAL (Degnanand Salter 2005).
aGene tree searches based on Tropo6 sequence data from one randomly chosen individual from each species resulted in.100
ML gene trees and so that locus was dropped from the COAL analysis.
relationship betweenP. amoenaandP. cyanea. Interest-ingly, theP. caerulea/P. amoena sister relationship pro-posed by Klickaet al.(2001) was supported by analyses of the MC1R data (Tables 4–6). Mutations in MC1R are known to correlate with variations in melanin-based plum-age in a variety of taxa, including birds (Mundy2005; Hoekstra2006). Within Passerina, P. amoenaandP. caeruleaare the only species with putatively melanin-based plumages (Hilland McGraw2006) and selection ac-ting on MC1R might explain the differences we found between inferences based on MC1R and those based on other loci. There is a nonsynonymous change at amino acid residue 102 (Val/Leu) that unitesP. caeruleaand P. amoena(Val) to the exclusion ofP. cyanea(Leu), which does not have any melanistic plumage. However,P. rositae andC. cyanoides(neither of which have melanin-based plumage) share the Val allele withP. amoenaandP. caerulea indicating that the allele (Leu) found inP. cyaneais likely derived and probably not related to the differences in
plumage patterns betweenP. caerulea,P. amoena, and P. cyanea. Therefore, while we cannot completely rule out the possibility that selection on the melanin-based plumages ofP. amoenaandP. caeruleahas resulted in the observed patterns, the available data suggest selection is an unlikely cause.
Below, we discuss the benefits of using the two types of analyses for resolving sister relationships in Passerina and then with respect to closely related taxa in general.
Comparing mtDNA and nuclear DNA signals: The
sister relationship betweenP. cyaneaandP. amoena sup-ported by the multilocus analyses conflicts with a well-supportedP. caerulea/P. amoenasister relationship inferred from mitochondrial data (Klickaet al.2001). A possible explanation for the discrepancies between the mtDNA and nuclear results is differential lineage sorting of the mtDNA with respect to the true species tree (Braun and Brumfield1998). Assuming ((P. cyanea,P. amoena), P. caerulea) is the correct topology, one can estimate the
TABLE 6
Probabilities of neighbor-joining gene topologies, inferred from the eight terminal tip data set, given two alternative species trees with differing internal:terminal branch length ratios (1:1, 1:2, and 1:10)
Probability
Locusa NJ treeb Species topologyb 1:1 1:2 1:10
AETC (Pcy1, (((Pam1,Pcy2), Pam2), ((Ccy,Pro), (Pca1,Pca2))))
((((Pcy,Pam),Pca),Pro),Ccy) 2.365E-09 4.78789E-07 1.8218E-05 ((((Pam,Pca),Pcy),Pro),Ccy) 1.62E-10 4.6316E-08 1.82953E-06
bact3 (Pcy1, (((Pam1,Pcy2), Ccy), ((Pro, (Pca1, Pca2)),Pam2)))
((((Pcy,Pam),Pca),Pro),Ccy) 5.05E-10 2.77914E-07 2.1178E-05 ((((Pam,Pca),Pcy),Pro),Ccy) 3.99E-10 1.07017E-07 2.62828E-06
GADPH (Pcy1, (((Pam1,Pam2), (Pro, (Pca1,Pca2))), (Ccy,Pcy2)))
((((Pcy,Pam),Pca),Pro),Ccy) 3.143E-09 1.8008E-06 0.00018838 ((((Pam,Pca),Pcy),Pro),Ccy) 2.7306E-08 2.72713E-06 3.75984E-05
MC1R (Pcy1, ((((Pam1,Pam2), (Pca1,Pca2)), (Ccy, Pro)),Pcy2))
((((Pcy,Pam),Pca),Pro),Ccy) 2.124E-09 1.30936E-06 0.000149501 ((((Pam,Pca),Pcy),Pro),Ccy) 1.02979E-07 5.10169E-06 3.50167E-05
MPLPR (Pcy1, ((((Pam1,Pam2), Pcy2),Ccy), ((Pro, Pca1),Pca2)))
((((Pcy,Pam),Pca),Pro),Ccy) 5.136E-09 9.52899E-07 2.77842E-05 ((((Pam,Pca),Pcy),Pro),Ccy) 3.98E-10 5.10169E-06 1.74861E-05
Myo2 (Pcy1, ((((Pam1,Pam2), Pcy2),Ccy), (Pro, (Pca1,Pca2))))
((((Pcy,Pam),Pca),Pro),Ccy) 1.53135E-06 6.8394E-05 0.000690821 ((((Pam,Pca),Pcy),Pro),Ccy) 1.28294E-06 2.86844E-05 9.5464E-05
ODC (Pcy1, ((((Pam1,Pcy2), (Ccy,Pro)), (Pca1, Pca2)),Pam2))
((((Pcy,Pam),Pca),Pro),Ccy) ,1.0E-12 1.393E-09 2.7787E-06 ((((Pam,Pca),Pcy),Pro),Ccy) ,1.0E-12 5.27E-10 3.8284E-07
Rho1 (Pcy1, ((((Pam1,Pam2), (Pca1,Pca2)), (Ccy, Pro)),Pcy1))
((((Pcy,Pam),Pca),Pro),Ccy) 2.124E-09 1.30936E-06 0.000149501 ((((Pam,Pca),Pcy),Pro),Ccy) 1.02979E-07 5.10169E-06 3.50167E-05
TGFb2 (Pcy1, ((Pam1, (Ccy, (Pcy2,Pam2))), (Pro, (Pca1,Pca2))))
((((Pcy,Pam),Pca),Pro),Ccy) 1.4E-11 3.7386E-08 1.2647E-05 ((((Pam,Pca),Pcy),Pro),Ccy) 1.1E-11 6.71486E-07 1.4255E-08
Underlining indicates probabilities that are greater with aP. amoena/P. cyaneaspecies topology than with aP. amoena/P. caerulea species topology. Italic numbers indicate the opposite pattern. All probabilities calculated using COAL (Degnanand Salter 2005).
a
NJ gene tree search based on Tropo6 sequence data produced an unresolved topology and was dropped from COAL analyses.
b
probability of incongruence between a gene tree and the species tree (Felsenstein2004; Heinet al.2005). In-corporating a range of internode values based on the divergence time estimates from IM and a range of po-tential effective ancestral population sizes, the chance a gene tree differs from the true species tree in the Passerina system ranges from 0% (Ne¼10,000 individuals, inter-node length¼100,000 years) to 65% (ancestral Ne¼ 1,000,000, internode length¼100,000 years, Figure 2). Using an internode length of 350,000 years, which is the difference in the maximum-likelihood estimates of the divergence time for theP. cyanea3P. amoena(138,000 years ago) and the P. caerulea 3 P. amoena (486,000 years ago) comparisons (Table 7), and assuming no post-speciation gene flow, the probabilities of incongruence range from 0% (ancestralNe¼10,000) to 55% (ances-tralNe¼1,000,000) (Figure 2). While an accurate esti-mate of the ancestral population size is unavailable, an effective size of 10,000 or 20,000 may be unrealistically small. Current population census estimates forP. cyanea are on the order of 20–80 million individuals (Payne1992). Furthermore, while some coalescent-based ancestral pop-ulation-size estimates tend to be relatively small (Hey2005; Wonand Hey 2005), an estimate in birds based on se-quence data from multiple nuclear markers suggested an ancestral population size on the order of hundreds of
thousands of individuals ( Jenningsand Edwards2005). Large population sizes and short internode lengths com-bine to increase the chance of incomplete and incorrect lineage sorting of gene copies, confusing the phylogenetic relationships of the focal taxa. The analyses of a multilocus data set presented herein suggest that the stochastic nature of lineage sorting of the mitochondrial genome resulted in a gene tree that is discordant with the species tree.
In closely related taxa, gene flow, in addition to lineage sorting problems, may limit the ability to correctly infer the species tree from gene sequences. P. cyanea andP. amoena currently hybridize where their breeding ranges overlap, although the amount of in-trogression is currently unknown, and hybrid specimens between other members of the genus have been reported. The samples ofP. amoenaandP. cyaneaincluded in this study were collected far from the Great Plains contact zone (appendix) to minimize the chance that recent introgression between the two species might be obscuring the true evolutionary relationships between P. cyanea,P. amoena, andP. caerulea. Ongoing studies of the genetic structure of the hybrid zone between P. cyanea and P. amoena suggest little mitochondrial or nuclear introgression is occurring (M. Carling, un-published data). The data from the hybrid zone, along with the nonsignificant difference in the likelihood of
Figure4.—The posterior
probability distributions of model parameters (t,m1, and m2) estimated using IM for
the data to the more complex model in IM, indicate that gene flow betweenP. cyaneaandP. amoenahas probably not had a strong influence on the speciational history inferred in this study.
Implications for uncovering phylogenetic signals in closely related taxa:Integrating top-down phylogenetic methods with bottom-up population genetic methods was successful in that the same sister relationship was supported by both types of analyses. The data set of 10 loci sampled from either one (P. rositaeandC. cyanoides) or two individuals per species (P. cyanea,P. amoena, and P. caerulea) generated a relatively well-supported species tree despite the low level of variation at each locus. One possible solution to increase the resolution of individual gene trees is to increase the length of the sampled se-quence. Theoretically, lengthening the sampled sequence should increase the chance of detecting variable sites, which may then offer additional support for a particular topology (Doyle1992). In practice however, lengthening loci may not be a straightforward solution to a problem of poor resolution in phylogeny reconstruction. As the length of the sampled locus increases, so does the chance of sampling sites that have undergone recombination. We detected recombination in 3 of the 10 loci, a ratio similar to a recent multilocus study investigating the speciational history of Australian grass finches ( Jennings and Edwards2005). Both studies sampled loci between 200 and 900 bp, which demonstrates that potential effects of recombination should be considered in any popula-tion genetic or phylogenetic study employing sequence data from nuclear loci. Here, the results of the phylo-genetic analyses were similar regardless of whether we analyzed the entire sequence length or just the longest independently segregating block of sequence from the 3 loci (bact3, MPLPR, and TGFb2) that showed evidence of recombination (Table 3, Figure 3).
The sampling design used here closely mimicked the design that resulted in the greatest accuracy of species tree inference in Maddison and Knowles’s 2006 in-vestigation into the utility of using the minimize-deep-coalescences method for phylogenetic reconstruction. Using simulated data sets that differed both in the number of individuals sampled and the number of loci sampled, they assessed how often the minimize-deep-coalescences method recovered the true species tree, that is, the tree on which the sequences were simulated. A sampling design of nine loci and three individuals per species proved to be quite successful in recovering the correct species tree. The results of the modified minimize-deep-coalescences method used here provide empirical support for their best sampling design and serve as a use-ful reference point for researchers designing sampling protocols with the purpose of inferring phylogenies of closely related taxa.
Conclusions:Using DNA sequence data from a suite of nuclear loci, phylogenetic, and population genetic analyses supported the traditionally accepted
evolution-ary relationships between three North American passer-ines. In contrast to the findings of an earlier study that used data from the mitochondrial gene cytochromebto infer the phylogeny of the genus (Klickaet al.2001), we found, using both phylogenetic and population genetic-based methods,P. cyaneaandP. amoenato be more closely related to each other than either is toP. caerulea. These results underscore the importance of sampling multiple individuals and multiple loci when estimating multiple demographic parameters simultaneously under com-plicated evolutionary scenarios,e.g., when allowing for postdivergence gene flow. Unfortunately, IM and other coalescent-based methods available for inferring pop-ulation genetic parameters are often limited in some ways (e.g., how many populations they can handle, the sequence evolution models employed, etc). The continued im-provement of these methods will facilitate the combined analytical approach we advocate in studies with a greater number of focal taxa.
We thank D. Dittmann and S. Birks of the Louisiana State University Museum of Natural Science and University of Washington Burke Museum, respectively, for generously providing tissue samples for this research. We are also grateful to the following people for critical comments that significantly improved this manuscript: C. Burney, Z. Cheviron, A. Cuervo, R. Eytan, J. Maley, R. Nielsen, and two anon-ymous reviewers. J. Hey and J. Degnan provided assistance with IM and COAL, respectively. C. Burney helped produce Figure 1 and supple-mental Figure 1. B. Marks allowed us to use primers he developed for
bact3. This work was supported by National Science Foundation grants
DEB-0543562 and DBI-0400797 to R.T.B.
LITERATURE CITED
Axelsson, E., N. G. C. Smith, H. Sundstrom, S. Berlinand H.
Ellegren, 2004 Male-biased mutation rate and divergence in
autosomal, Z-linked and W-linked introns of chicken and turkey.
Mol. Biol. Evol.21:1538–1547.
Baker, M. C., and A. E. M. Baker, 1990 Reproductive-behavior of
female buntings - isolating mechanisms in a hybridizing pair of
species. Evolution44:332–338.
Baker, M. C., and J. T. Boylan, 1999 Singing behavior, mating
asso-ciations and reproductive success in a population of hybridizing
Lazuli and Indigo Buntings. Condor101:493–504.
Blake, C. H., 1969 Notes of the Indigo Bunting. Bird Banding40:
133–139.
Braun, M. J., and R. T. Brumfield, 1998 Enigmatic phylogeny of skuas:
an alternative hypothesis. Proc. R. Soc. Lond. Ser. B265:995–999.
Cheviron, Z. A., S. J. Hackett and R. T. Brumfield, 2006
Se-quence variation in the coding region of the melanocortin-1 re-ceptor gene (MC1R) is not associated with plumage variation in the Blue-crowned Manakin (Lepidothrix coronata). Proc. R. Soc.
Lond. Ser. B273:1613–1618.
Degnan, J. H., and N. A. Rosenberg, 2006 Discordance of species
trees with their most likely gene trees. PLoS Genet.2:0762–0768.
Degnan, J. H., and L. A. Salter, 2005 Gene tree distributions
un-der the coalescent process. Evolution59:24–37.
Doyle, J. J., 1992 Gene trees and species trees—molecular
system-atics as one-character taxonomy. Syst. Bot.17:144–163.
Edwards, S. V., L. Liuand D. K. Pearl, 2007 High-resolution species
trees without concatenation. Proc. Natl. Acad. Sci. USA104:5936–
5941.
Emlen, S. T., J. D. Risingand W. L. Thompson, 1975 A behavioral
and morphological study of sympatry in the Indigo and Lazuli
buntings of the Great Plains. Wilson Bull.87:145–179.
Excoffier, L., G. Lavaland S. Schneider, 2005 Arlequin ver 3.0:
an integrated software package for population genetics data
Felsenstein, J., 2004 Inferring Phylogenies.Sinauer Associates,
Sun-derland, MA.
Gillespie, J. H., and C. H. Langley, 1979 Are evolutionary rates
re-ally variable? J. Mol. Evol.13:27–34.
Greene, E., V. R. Muehterand W. Davison, 1996 Lazuli Bunting
(Passerina amoena), pp. 1–24 inThe Birds of North America, No.
232, edited by A. Pooleand F. Gill. The Academy of Natural
Sciences, Washington, DC/The American Ornithologists’ Union, Philadelphia.
Hein, J., M. K. Schierupand C. Wiuf, 2005 Gene Genealogies,
Varia-tion and EvoluVaria-tion.Oxford University Press, New York.
Hellack, J. J., and G. Schnell, 1977 Phenetic analysis of the
sub-family Cardinalinae using external and skeletal characters.
Wil-son Bull.89:130–148.
Heslewood, M. M., M. S. Elphinstone, S. C. Tidemannand P. R.
Baverstock, 1998 Myoglobin intron variation in the Gouldian
Finch Erythrura gouldiae assessed by temperature gradient gel
electrophoreses. Electrophoresis19:142–151.
Hey, J., 2005 On the number of New World founders: a population
genetic portrait of the peopling of the Americas. PLoS Biol.3:
965–975.
Hey, J., and R. Nielsen, 2004 Multilocus methods for estimating
population sizes, migration rates, and divergence time, with
applications to the divergence of Drosophila pseudoobscura and
D. persimilis.Genetics167:747–760.
Hill, G. E., and K. J. McGraw, 2006 Bird Coloration, Vol. I. Harvard
University Press, Cambridge, MA.
Hoekstra, H. E., 2006 Genetics, development and the evolution of
adaptive pigmentation in vertebrates. Heredity97:222–234.
Huelsenbeck, J. P., and F. Ronquist, 2001 MrBayes: Bayesian
infer-ence of phylogenetic trees. Bioinformatics17:754–755.
Jennings, W. B., and S. V. Edwards, 2005 Speciational history of
Australian Grass Finches (Poephila) inferred from thirty gene
trees. Evolution59:2033–2047.
Kimura, M., 1969 The number of heterozygous nucleotide sites
maintained in a finite population due to steady flux of mutations.
Genetics61:893–903.
Klicka, J.,A. J. Fry,R. M.ZinkandC.W.Thompson, 2001 Acytochrome-b
perspective on Passerina bunting relationships. Auk118:611–623.
Kroodsma, R. L., 1975 Hybridization in buntings (Passerina) in
North Dakota and eastern Montana. Auk92:66–80.
Kubatko, L. S., and J. H. Degnan, 2007 Inconsistency of
phyloge-netic estimates from concatenated data under coalescence. Syst.
Biol.56:17–24.
Maddison, W. P., 1997 Gene trees in species trees. Syst. Biol.46:
523–536.
Maddison, W. P., and L. L. Knowles, 2006 Inferring phylogeny
de-spite incomplete lineage sorting. Syst. Biol.55:21–30.
Maddison, W. P., and D. R. Maddison, 2004 Mesquite: a modular system
for evolutionary analysis, Version 1.01. http://mesquiteproject.org.
Mayr, E., and L. L. J. Short, 1970 Species taxa of North American
birds, a contribution to comparative systematics. Pub. 9, Nuttall Ornithological Club, Cambridge, MA.
McGuire, G., and F. Wright, 1998 TOPAL: recombination
detec-tion in DNA and protein sequences. Bioinformatics14:219–220.
McGuire, G., and F. Wright, 2000 TOPAL 2.0: improved detection
of mosaic sequences within multiple alignments. Bioinformatics
16:130–134.
Mundy, N. I., 2005 A window on the genetics of evolution:MC1R
and plumage colouration in birds. Proc. R. Soc. Lond. Ser. B
272:1633–1640.
NatureServe, 2006 NatureServe Explorer: An Online Encyclopedia of
Life, Version 6.1. http://www.natureserve.org/explorer.
Nei, M., and W. H. Li, 1979 Mathematical model for studying
ge-netic variation in terms of restriction endonucleases. Proc. Natl.
Acad. Sci. USA76:5269–5273.
Pamilo, P., and M. Nei, 1988 Relationships between gene trees and
species trees. Mol. Biol. Evol.5:568–583.
Payne, R. B., 1992 Indigo Bunting, pp. 1–24 inThe Birds of North America,
No. 4, edited by A. Poole, P. Stettenheimand F. Gill. The
Acad-emy of Natural Sciences, Washington, DC/The American Orni-thologists’ Union, Philadelphia.
Paynter, R. A., 1970 Subfamily Cardinalidae, pp. 216–245 in
Check-list of Birds of the World, edited by R. A. Paynterand R. W. Storer.
Museum of Comparative Zoology/Heffernan Press, Worcester, MA. Phillips, A. R., J. T. Marshalland G. Monson, 1964 The Birds of
Arizona.University of Arizona Press, Tucson, AZ.
Posada, D., and T. R. Buckley, 2004 Model selection and model
av-eraging in phylogenetics: advantages of the AIC and Bayesian
ap-proaches over likelihood ratio tests. Syst. Biol.53:793–808.
Posada, D., and K. A. Crandall, 1998 MODELTEST: testing the
model of DNA substitution. Bioinformatics14:817–818.
Primmer, C. R., T.Borgeand G. P.Saetre, 2002 Single-nucleotide
polymorphism characterization in species with limited available sequence information: high nucleotide diversity revealed in the
avian genome. Mol. Ecol.11:603–612.
Ridgely, R. S., T. F. Allnutt, T. Brooks, D. K. McNicol, D. W.
Mehlmanet al., 2003 Digital distribution maps of the birds of
the Western hemisphere, version 1.0. NatureServe, Arlington, VA. Ronquist, F., and J. P. Huelsenbeck, 2003 MrBayes 3: Bayesian
phy-logenetic inference under mixed models. Bioinformatics 19:
1572–1574.
Rosenberg, N. A., 2002 The probability of topological concordance
of gene trees and species trees. Theor. Popul. Biol.61:225–247.
Rosenberg, N. A., 2003 The shapes of neutral gene genealogies in
two species: probabilities of monophyly, paraphyly, and polyphyly
in a coalescent model. Evolution57:1465–1477.
Saitou, N., and M. Nei, 1987 The neighbor-joining method—a new
method for reconstructing phylogenetic trees. Mol. Biol. Evol.4:
406–425.
Shimodaira, H., and M. Hasegawa, 1999 Multiple comparisons of
log-likelihoods with applications to phylogenetic inference. Mol.
Biol. Evol.16:1114–1116.
Sibley, C. G., and L. L. J. Short, 1959 Hybridization in the
bunt-ings (Passerina) of the Great Plains. Auk76:443–463.
Slade, R. W., C. Moritz, A. Heidemanand P. T. Hale, 1993 Rapid
assessment of single-copy nuclear DNA variation in diverse
spe-cies. Mol. Ecol.2:359–373.
Sokal, R. R., and F. J. Rohlf, 1995 Biometry.W. H. Freeman, New York.
Swofford, D. L., 1998 PAUP*. Phylogenetic Analysis Using Parsimony
(*and Other Methods), Version 4. Sinauer Associates, Sunderland, MA. Tajima, F., 1983 Evolutonary relationships of DNA sequences in
fi-nite populations. Genetics105:437–460.
Takahata, N., 1989 Gene genealogy in three related populations—
consistency probability between gene and population trees.
Genetics122:957–966.
Takahata, N., 1995 A genetic perspective on the origin and history
of humans. Annu. Rev. Ecol. Syst.26:343–372.
Takahata, N., and M. Nei, 1985 Gene genealogy and variance of
interpopulational nucleotide differences. Genetics110:325–344.
Takahata, N., and M. Slatkin, 1990 Genealogy of neutral genes in
two partially isolated populations. Theor. Popul. Biol.38:331–
350.
Tamplin, J. W., J. W. Demastesand J. V. Remsen, 1993 Biochemical
and morphometric relationships among some members of the
Cardinalinae. Wilson Bull.105:93–113.
Wakeley, J., 1996 Pairwise differences under a general model of
population subdivision. J. Genet.75:81–89.
Wakeley, J., and J. Hey, 1998 Testing speciation models with DNA
sequence data, pp. 157–167 inMolecular Approaches to Ecology and
Evolution, edited by R. DeSalleand R. Schierwater. Birkhauser
Verlag, Basel, Switzerland.
Won, Y. J., and J. Hey, 2005 Divergence population genetics of
chim-panzees. Mol. Biol. Evol.22:297–307.
Species ID no. Locality
Passerina amoena B-4005 Douglas County, Washington
B-24769 San Bernadino County, California
P. cyanea B-20575 Iberville Parish, Louisiana
B-20773 Cass County, Michigan
P. caerulea B-20598 Cameron Parish, Louisiana
B-21812 Jeff Davis County, Texas
P. rositae 69937a Monte Bonito, Chiapas, Mexico
Cyanocompsa cyanoides B-12708 Velasco, Santa Cruz Department, Bolivia
a
Tissue obtained through loan from the University of Washington Burke Museum. All other tissue samples were obtained from the Genetic Resources Collection at the Louisiana State University Museum of Natural Science.