X-ray Diffraction Analysis of Ti-18 mol%Nb Based Shape Memory Alloys
Containing 3d Transition Metal Elements
Yosuke Horiuchi
1;*, Tomonari Inamura
1, Hee Young Kim
2, Syuichi Miyazaki
2,
Kenji Wakashima
1and Hideki Hosoda
11Precision and Intelligence Laboratory, Tokyo Institute of Technology, Yokohama 226-8503, Japan
2Institute of Materials Science, University of Tsukuba, Tsukuba 305-8573, Japan
The effect of 3d-transition-metal alloying on the phase constitution of Ti-18 mol%Nb based shape memory alloys was investigated by X-ray diffraction analysis (XRD) at room temperature. The baseline binary Ti-18 mol%Nb alloy (called Binary) and ternary Ti-18 mol%Nb-3 mol%Xalloys (X¼V, Cr, Mn, Fe, Co and Ni, called 3X) were fabricated by Ar arc-melting method, followed by homogenization at 1273 K for 3.6 ks. These alloys were cold-rolled with 30% and 98% reduction in thickness. Some specimens from 98% cold rolled material were solution treated at 1273 K for 1.8 ks and quenched in water. It was found that the phase present in the solution-treated and quenched Binary and 3V was
00martensite phase and that of the other alloys wasphase. No other phase or ordering was confirmed in these baseline and 3X alloys. The
lattice parameter ofphase showed a good correlation with the Goldschmidt atom radius of the ternary alloying metals. It was confirmed that (1) almost same type of deformation texture was formed inphase materials regardless of the alloying metals but that (2) the development of recrystallization texture was suggested to be different depending on the alloying metals.
(Received November 16, 2005; Accepted February 6, 2006; Published April 15, 2006)
Keywords: phase constitution, shape memory alloys, X-ray diffraction analysis, lattice parameter, texture
1. Introduction
Since the shape memory effect in -Ti alloy was firstly found by Baker in Ti-35 mass%Nb binary alloy in 1971,1) several researches such as recovery test, microstructure observation were done for such Ti-base shape memory alloys.2–6) It is well documented at present that the shape
memory effect of the Ti-base alloys comes from a thermo-elastic martensitic transformation from phase (bcc) to 00
phase (c-centered orthorhombic).7) However, neither
suffi-cient shape memory effect nor superelasticity for practical applications was found till 1990s. In order to improve shape memory properties of the Ti-based shape memory alloys, we have systematically investigated several ternary systems composed of nontoxic elements such as Ti-Nb-Al, Ti-Nb-Ge and Ti-Nb-Zr.8–19)Now it has been revealed that the Ti-base
shape memory alloys exhibit good shape memory effect, mechanical properties, biocompatibility and superior cold workability. It has been also found that the martensitic transformation behavior of the Ti-base shape memory alloys is affected by alloying metal. As for the martensitic trans-formation from to0 (hcp, nonthermoelastic
transforma-tion), the effects of binary alloying metal on the martensitic transformation temperatures (Ms) were precisely
investigat-ed,20) and the transition metals belonging to 8-, 9- and
10-groups in the Periodic Table decreaseMsmore strongly than
those belonging to 5-group. It was also reported that the phase transformation in-Ti alloys relates to the d-electron densities.21)Thus, 3d-transition metal alloying, which effects
on the d-electron density, must change the stability of bcc structure. It is believed that the change in Ms of to 00
martensitic transformation behaves similar toMs of to0
martensitic transformation. A few systematic works have
been done for the effects of alloying metal on Ti-Nb shape memory alloys. For example, mechanical properties are changed depending on the atom species of ternary elements belong to 13- and 14-goups.22)However, no systematic work has been done for the Ti-Nb alloys containing 3d-transition metal elements such as Fe, Co and Ni. Therefore, in this study, the phase constitution of Ti-18 mol%Nb alloys con-taining 3 mol% of ternary elements was investigated using
-2 X-ray diffraction (XRD) analysis at room temperature (RT). Effect of thermo-mechanical treatments on phase constitution and texture development was also investigated.
2. Experimental Procedure
Ingots of Ti-18 mol%Nb (called ‘‘Binary’’) and Ti-18 mol%-3 mol%X (X¼V, Cr, Mn, Fe, Co and Ni; called ‘‘3X’’) were fabricated by Ar arc-melting method in an Ar-1%H2atmosphere. Each alloy was prepared using elemental
materials with 99.9% or higher in purity. Each ingot was about 5 g in weight and no chemical analysis was made because of small weight change after alloying. It should be mentioned that TiNbAl alloys made similarly contained oxygen of about 200-400 ppm in weight. Then, the present alloys are considered to contain similar amount of oxygen. The ingots were homogenized at 1273 K for 3.6 ks in vacuum followed by quenching into water. The surface layer of the homogenized ingots was removed by mechanical polishing and then the ingots were cold-rolled. In this study, three kinds of thermo-mechanical conditions were selected for each alloy. The first is a cold-rolling with a final reduction in thickness of 30% and the rolling direction was randomly changed in order to avoid a specific texture formation. The second is a cold-rolling with a final reduction in thickness of 98% with keeping a constant rolling direction for the texture development and introducing severe cold deformation. The third is the similar solution treatment of 1273 K for 1.8 ks in
*Graduate Student, Tokyo Institute of Technology, Yokohama 226-8503,
vacuum followed by water quench using the 98% cold rolled materials.
All the specimens for XRD were polished mechanically by emery papers and diamond pastes with diameter of up to 1mm and then electropolished in a solution of perchloric acid:butanol:methanol = 1:6:10 in volume at 220 K for the elimination of damaged surface layer introduced during the mechanical polish. A conventional-2XRD was carried out at room temperature (RT, 298 K) with CuKradiation using Philips X’pert Pro Galaxy system equipped with an X’cel-erator module. The rolling direction (RD) was set to be parallel to the X-ray direction projected onto the specimen surface. Si powder was used as an external standard material for the correction of peak angles.
In a conventional -2XRD, the intensity of diffraction peak decreases with the increase in diffraction angle since the atomic form factor for X-Ray decrease with the increase in diffraction angle. It is, therefore, possible to know the existence of preferential orientation of grains from the relative intensity by-2XRD.
Electron back scattering diffraction (EBSD) measurements were additionally performed for 3Cr and 3Fe only in order to confirm the texture. EBSD measurements were performed in a field emission gun scanning electron microscope at a working distance of 15 mm and accelerating voltage of 20 kV. The software used for the EBSD measurements was INCA Microanalysis Suite from Oxford Instrument.
3. Results and Discussion
3.1 Phase constitution of 30% cold-rolled and solution-treated materials
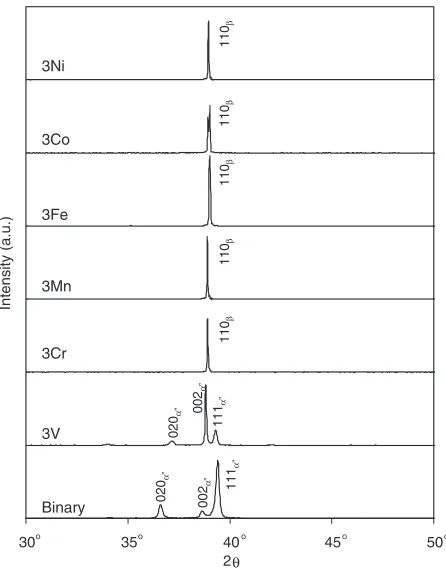
Figure 1 shows the XRD profiles of solution-treated materials after 30% cold-rolling. Subscript 00and in the
figure indicate the reflections from00martensite and parent
phase, respectively. The diffraction peaks only from 00
martensite phase are detected in Binary and 3V. On the other hand, the diffraction peaks only fromphase are detected in 3Cr, 3Mn, 3Fe, 3Co and 3Ni alloys. From these results, it was recognized that Binary and 3V are 00 martensite phase and
the other ternary alloys are phase at RT. These results indicate that Cr, Mn, Fe, Co and Ni decrease the Ms of
Ti-18 mol%Nb alloy. Thus, it is considered that thephase was stabilized by the addition of these alloying metals. It should be mentioned that, although ordering was reported for Ti-(16–26 mol%) Nb binary alloys by Ahmed and Rack,23)no
trace of ordering was recognized by XRD in this study regardless of alloy systems. Such an ordering phenomenon was not detected even in recent transmission electron microscopy (TEM) observation and details of results of TEM observation will be reported elsewhere.
3.2 Lattice parameter
The lattice parameters were precisely determined by
CellCalc, a unit cell parameter refinement program on
windows computer,24) which is based on a least-square method using the reciprocal lattice parameters. The lattice parameters of each alloy are listed in Table 1. Since Binary and 3V were orthorhombic 00 phase at RT, their lattice parameters were represented bya00,b00 andc00 (defined as
b00>c00 >a00). The other ternary alloys (3Cr, 3Mn, 3Fe, 3Co and 3Ni) were bcc phase at RT and their lattice parameters were represented bya. The unit cell volumeV00 for00phase andV
forphase, and averaged atomic volume
Vatommeasured (unit: cm3/mol) are also listed in Table 1. To
evaluate the validity of Vatommeasured independently of
apparent crystal structure, atomic volume Vatomcalc of each
alloy was estimated based on the rule of mixture under the assumption that single phase was formed regardless of alloy systems, as
Vatomcalc¼VTiCTiþVNbCNbþVxCx; ð1Þ
where VTi, VNb and Vx are atomic volumes of constituent
elements (Ti, Nb and ternary elements) at RT listed in Table 2, and CTi, CNb and Cx are their concentrations,
respectively. It is found in Table 1 that measured atomic volumes are in good agreement with estimated atomic volumes. Then, the atomic volume change by the addition
30 35 40 45 50
2θ
Intensity (a.u.)
020
α
”
002
α
”
111
α
”
020
α
” 002
α
”
111
α
”
110
β
110
β
110
β
110
β
110
β
3Cr 3Mn 3Co
3Fe 3Ni
Binary 3V
o o o o o
[image:2.595.315.538.71.356.2]Fig. 1 XRD profiles of 30% cold-rolled and solution treated materials.
Table 1 Lattice parameters and atomic volumes at RT. Binary 3V 3Cr 3Mn 3Fe 3Co 3Ni
a/nm — — 0.3272 0.3275 0.3265 0.3266 0.3269 a00/nm 0.3104 0.3142 — — — — — b00/nm 0.4907 0.4838 — — — — — c00/nm 0.4656 0.4637 — — — — — V00/nm3 0.0709 0.0705 — — — — — V/nm3 — — 0.0350 0.0351 0.0348 0.0348 0.0349 Vatommeasured
10.67 10.61 10.54 10.57 10.48 10.49 10.52 /cm3mol1
Vatomcalc
[image:2.595.305.548.412.551.2]of ternary elements is due to the atomic volume difference between Ti and alloying metals.
In order to clarify the effect of the ternary addition on the lattice parameter, the lattice parameters of phase for the Ti18Nb3X alloys were plotted in Fig. 2 as a function of Goldschmidt radius of alloying metal. The Goldschmidt radii used in this study are based on the coordination number of 12. It is seen in the figure that the lattice parameter decreases linearly when the Goldschmidt radius of the alloying metal become small. It is therefore, considered that the added third alloying metals are soluble within the composition range investigated in this study. Moreover, it is generally believed that atomic volume is reduced by occurrence of ordering due to increase in bonding energy. Thus, these results support the result that no ordering occurs by the addition of these alloying metals.
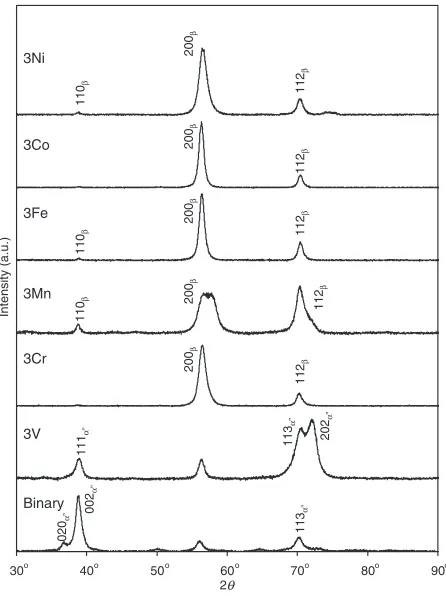
3.3 Phase constitution of 98% cold-rolled materials All the alloys were easily cold-rolled with a final reduction in thickness of 98% and no cracks were formed by the rolling. Figure 3 shows XRD profiles of alloys after 98% cold rolling. Two phases of00andwere detected for Binary and 3V, and single phase was detected for the other alloys except for 3Mn. Thephase detected in Binary and 3V must be retained due to the increase in transformation hysteresis by the severe cold rolling. It should be noted that the200and112peaks are split in 3Mn. This may be due to the stress induced 00
martensite formed during the cold-rolling but clear evidence about the existence of00martensite was not detected.
It is seen in Binary and 3V with 00þ two phase that
there are difference in peak intensities: strong 00200 for Binary and strong 11300 for 3V, for example. Such dif-ferences must be due to difference in deformation-texture caused by addition of V.
On the other hand, no significant difference was recog-nized in the relative intensity of each peak for the alloys with
single phase (3Cr, 3Fe, 3Co and 3Ni) as well as 3Mn. The relative intensity of200peak was stronger than that of110
peak in 3Mn, 3Fe and 3Ni. No remnants of110 peak were
detected in 3Cr and 3Co. These results indicate that preferential orientations of grains exist in these alloys. It is deduced that the normal direction (ND) tends to be parallel to
f200g.
The deformation texture depended on the species of the ternary elements. This should indicate that deformation mechanism of the alloy is affected by the ternary additions. In the alloys with 00 phase, some twinning systems can be
activated and the twinning elements depends on the alloy composition.25) For the -Ti alloys, there are some reports showing that the dislocation slip and/or twining are affected by changes in the electronic structures.26)Thef332g
h113i
twin and dislocation slip with Burgers vector ofh111iare the plausible deformation system in the -Ti alloys. In addition, stress-induced martensitic transformation should occur depending on Ms which is determined by the ternary
elements. Some of the four deformation mechanisms, there-fore, become dominant mechanisms depending on the kind of the ternary elements. The variations in the intensity distri-bution in the XRD profiles should be due to the change in deformation texture resulted from the ternary addition.
3.4 Phase constitution of 98% cold-rolled and solution-treated materials
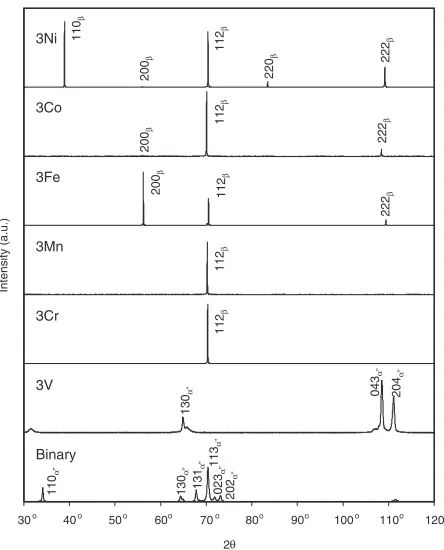
[image:3.595.315.538.71.369.2]Figure 4 shows XRD profiles of solution-treated materials after 98% cold rolling. By comparing the results of 30%
Table 2 Atomic volumes of 3d transition metal elements used in this study. Ti Nb V Cr Mn Fe Co Ni
Vatom
10.54 10.86 8.78 7.22 7.40 7.10 6.70 6.59 /cm3mol1
0.326 0.3265 0.327 0.3275 0.328
0.124 0.125 0.126 0.127 0.128 0.129 0.13 0.131
Lattice parameter,
a
/nm
Goldschmidt radius, r G /nm
Cr
Mn
Co
Fe Ni
Fig. 2 Relationship between lattice parameters of phase and Gold-schmidt radii of ternary elements.
30 40 50 60 70 80 90 2
Intensity (a.u.) 200
β
112
β
112
β
112
β
112
β
200
β
110
β
200
β
200
β
200
β
110
β
110
β
112
β
020
α
” 002
α
”
113
α
”
113
α
”
202
α
”
111
α
”
3Cr 3Mn 3Co
3Fe 3Ni
Binary 3V
o o o o o o o
θ
[image:3.595.50.287.78.324.2](Fig. 1) and 98% cold-rolled materials (Fig. 4), no change in phase constitution is detected for the solution treated materials. For 3Cr, 3Fe, 3Co and 3Ni, onlyphase appears regardless of cold rolling reduction and heat treatment condition. These results suggest that Ms of these alloys is
much lowered by the addition of ternary elements. By comparing Binary and 3V, the intensity distribution in XRD profiles is quite different: strong11300for Binary and strong
04300 and 20400 for 3V. These differences suggest that recrystallization texture is changed by V addition. This should be partially due to that the deformation texture is changed by V addition as discussed in the above section.
On the other hand, distribution of intensity in XRD profiles ofsingle phase alloys (3Cr, 3Mn, 3Fe, 3Co and 3Ni) were also different each other, even though the relative intensity of each peak after cold rolling were similar to each other as shown in Fig. 3. 3Cr and 3Mn exhibit112 reflection only. Our previous work revealed that f112gh110i type
recrys-tallization texture is well developed in Ti-24 mol%Nb-3 mol%Al alloy by the combination of a severe cold rolling and a solution treatment.16)Then, it is quite acceptable that f112gh110itype recrystallization texture is also developed in 3Cr and 3Mn alloys. However, XRD profiles of 3Fe and 3Co exhibit 200,112 and222, and that of 3Ni exhibits strong 110 in addition to 112. These results suggest that
f112gh110i type recrystallization texture was not well
developed in 3Fe, 3Co and 3Ni comparing with that of 3Cr and 3Mn. The reason for these differences in recrystallization texture is not clear at present, but these results imply the difference in the deformation texture resulted from the difference in the alloying metals. In order to clarify the effect of 3d-transition-metal alloying on texture development quantitatively, the texture evaluation using both XRD pole
figure measurement and EBSD measurement are under investigation. Figure 5 shows the 100 pole figures obtained by EBSD for (a) 3Cr and (b) 3Fe. It is seen that different textures appear:f112gh110itype recrystallization texture is well developed in 3Cr and not well developed in 3Fe. These results obtained by EBSD are in good agreement with the above-described texture development based on -2 XRD profiles.
4. Conclusions
(1) 00 single phase appears at RT for the binary
Ti-18 mol%Nb (Binary) and the ternary Ti-Ti-18 mol%Nb-3 mol%V (mol%Nb-3V) after the solution treatment of 127mol%Nb-3 K for 1.8 ks regardless of cold rolling reduction.00and
two-phases appear for Binary and 3V at RT after 98% cold rolling thickness reduction without solution treat-ment. Thephase must be stabilized by the severe cold rolling.
(2) Ti-18 mol%Nb-3 mol%X alloys (X¼Cr, Fe, Co and Ni) at RT are phase regardless of cold rolling reduction and heat treatment.Msis much lowered and
these alloying metals stabilizephase.
(3) The lattice parameter of phase decreases with decreasing the Goldschmidt radius of alloying metal. (4) For the 98% cold-rolled materials, similar relative
intensity of each peak was observed regardless of the species of alloying metal when onlyphase appears. It is considered that the normal direction (ND) tends to be parallel toð200Þfrom the XRD profiles of these alloys.
(5) For the 98% cold-rolled and solution-treated materials, only112was detected in 3Cr and 3Mn, and the peaks of 112 and other peaks were detected in 3Fe, 3Co
and 3Ni. This indicates that the development of recrystallization texture is affected by alloying with the 3d-transition metals.
Acknowledgments
This work was partially supported by a Grant-in-Aid for Fundamental Scientific Research Kiban B (No. 17360334, 2005–2007), Wakate B (No. 16760566, 2004–2006), Scien-tific Research of Priority Areas 438, Next-Generation Actuators Leading Breakthroughs (No. 17040013, 2005– 2006), the 21st COE program from the Ministry of Education, Culture, Sports, Science and Technology, Japan and Osawa Scientific Studies Grants Foundation.
30 40 50 60 70 80 90 100 110 120
2θ
Intensity (a.u.)
200
β
112
β
110
β
200
β
3Cr 3Mn 3Co
3Fe 3Ni
Binary 3V
200
β
112
β
112
β
112
β
112
β
220
β 222
β
222
β
222
β
110
α
”
130
α
”
131
α
”
023
α
”
202
α
”
113
α
”
130
α
”
043
α
”
204
α
”
o o o o o o o o o o
Fig. 4 XRD profiles of 98% cold-rolled and solution-treated materials.
a) 3Cr b) 3Fe
RD
TD RD
TD
Intensity
32
2 16
1 8
4
60 60
60 60
[image:4.595.57.279.70.345.2] [image:4.595.312.542.74.188.2]REFERENCES
1) C. Baker: Metal Sci. J.5(1971) 92–100.
2) T. W. Duerig, J. Albercht, D. Richter and P. Fisher: Acta Metall.30
(1982) 2161–2172.
3) H. Kimura and T. Sohmura: J. Jpn. Soc. Dental Materials and Devices4
(1985) 377–384.
4) H. Sasano and T. Suzuki: Proc. Intl. Conf. on Martensitic Trans-formations (ICOMAT-89), (1990) 1667–1670.
5) T. Sugimoto, M. Ikeda, S. Komatsu, K. Sugimoto and K. Kamei: Proc. Sixth World Conf. on Titanium, (1988) 1069–1074.
6) C. Y. Lei, J. S. L. Pak, H. R. P. Inoue and C. M. Wayman:Proc. Intl. Conf. On Martensitic Transformations (ICOMAT-92), (1993) 539–544. 7) D. L. Moffat and D. C. Larbalestier: Metall. Trans. A19A(1988)
1677–1686.
8) K. Nitta, S. Watanabe, N. Masahashi, H. Hosoda and S. Hanada:Proc. Intl. Symp. Structural Biomaterials for 21st Century, TMS, 25–34. 9) H. Hosoda, Y. Ohmatsu and S. Miyazaki: Trans MRSJ26(2001) 235–
238.
10) H. Hosoda, N. Hosoda and S. Miyazaki: Trans MRSJ26(2001) 243– 246.
11) N. Hosoda, H. Hosoda and S. Miyazaki: The Fourth Pacific Rim International Conference on Advanced Materials and Processing (PRICM4), eds. S. Hanadaet al., The Japan Inst. Metals2(2001) 1623– 1625.
12) Y. Ohmatsu, H. Hosoda and S. Miyazaki: The Fourth Pacific Rim International Conference on Advanced Materials and Processing
(PRICM4), eds. S. Hanadaet al.: The Japan Inst. Metals2(2001) 1627– 1629.
13) Y. Fukui, K. Kuroda, H. Hosoda, K. Wakashima and S. Miyazaki: Trans MRSJ28(2003) 623–626.
14) K. Kuroda, H. Hosoda, K. Wakashima and S. Miyazaki: Trans MRSJ
28(2003) 631–634.
15) Y. Fukui, T. Inamura, H. Hosoda, K. Wakashima and S. Miyazaki: Mater. Trans.45(2004) 1077–1082.
16) T. Inamura, Y. Fukui, H. Hosoda, K. Wakashima and S. Miyazaki: Mater. Trans.45(2004) 1083–1089.
17) H. Y. Kim, Y. Ohmatsu, J. I. Kim, H. Hosoda and S. Miyazaki: Mater. Trans.45(2004) 1090–1095.
18) J. I. Kim, H. Y. Kim, H. Hosoda and S. Miyazaki: Mater. Trans.46
(2005) 852–857.
19) J. I. Kim, H. Y. Kim, T. Inamura, H. Hosoda and S. Miyazaki: Mat. Sci. Eng. A403A(2005) 334–339.
20) P. Duwez: Trans. ASM45(1953) 934–940.
21) E. W. Collings:Materials Properties Handbook: Titanium Alloys, eds. R. Boyer, G. Welsch and E. W. Collings, ASM International (1994) ‘‘2. Classification of Titanium Alloys’’ 5–11.
22) H. Hosoda. Y. Fukui, T. Inamura, K. Wakashima and S. Miyazaki: Mat. Sci. Forum475–479(2005) 2329–2332.
23) T. Ahmed and H. J. Rack: J. Mat. Sci.31(1996) 4267–4276. 24) H. Miura: J. Cryst. Soc. Jpn.45(2003) 145–147.
25) K. A. Bywater and J. W. Christian: Phil. Mag.25(1972) 1249–1273. 26) D. Kuroda, M. Niinomi, M. Morinaga, Y. Kato and T. Yashiro: Mat.