Validation of the MCNP6 electron-photon transport algorithm: multiple-scattering
of 13- and 20-MeV electrons in thin foils
David A. Dixon1and H. Grady Hughes1
1Los Alamos National Laboratory, Los Alamos, NM 87545
This paper presents a validation test comparing angular distributions from an electron multiple-scattering experiment with those generated using the MCNP6 Monte Carlo code system. In this experiment, a 13- and 20-MeV electron pencil beam is deflected by thin foils with atomic numbers from 4 to 79. To determine the angular distribution, the fluence is measured down range of the scattering foil at various radii orthogonal to the beam line. The characteristic angle (the angle for which the max of the distribution is reduced by 1/e) is then determined from the angular distribution and compared with experiment. Multiple scattering foils tested herein include beryllium, carbon, aluminum, copper, and gold. For the default electron-photon transport settings, the calculated characteristic angle was statistically distinguishable from measurement and generally broader than the measured distributions. The average relative difference ranged from 5.8% to 12.2% over all of the foils, source energies, and physics settings tested. This validation illuminated a deficiency in the computation of the underlying angular distributions that is well understood. As a result, code enhancements were made to stabilize the angular distributions in the presence of very small substeps. How-ever, the enhancement only marginally improved results indicating that additional algorithmic details should be studied.
KEYWORDS: MCNP6, Monte Carlo, electron-photon transport, multiple-scattering, validation
I. Introduction
It is of interest to establish a comprehensive electron-photon validation suite for the MCNPR version 6.2 code system.(1) Though previous efforts to validate the electron-photon trans-port in earlier versions of MCNP6 were made,(2–4) these val-idations correspond to unsupported versions of the code and are somewhat limited in scope. New validation efforts are un-derway(5)that test the current version of the code containing improvements to the electron-photon transport capabilities.(6, 7) The purpose of this paper is to benchmark MCNP6 against the measurements of Rosset al.(8) Rosset almeasured angular distributions corresponding to electron pencil beams of 13- and 20-MeV normally incident on single-element (with exception of a titanium alloy), thin foils with atomic numbers from 4 to 79. Electron fluence was measured roughly 120 cm from the beam exit window at various radii orthogonal to the beam line. While a number of similar benchmarks exist, uncertainties in the accelerator descriptions associated with these similar exper-iments somewhat limit their utility. Whereas, Rosset al deter-mined angular distributions where the beam characteristics are well known, with no free parameters, making this benchmark ideal for validation of electron transport codes. Though this benchmark is valuable to codes intended for medical physics ap-plications, it is also valuable for general validation of multiple-scattering models. As such, this experimental benchmark will be added to the MCNP6 electron-photon validation suite.
As the emphasis of this paper is the validation test rather than MCNP6 electron-photon transport algorithm, we briefly describe the relevant physics and identify additional references that provide greater detail. The MCNP6 electron-photon
trans-port algorithm is considered a class I condensed history method. In MCNP6, electrons traverse a substep distance where both angular deflection and energy-loss are sampled (i.e. the primary processes impacting the angular distributions studied herein). In MCNP6, angular deflection resulting from multiple elastic scattering of electrons is given by the Goudsmit-Saunderson dis-tribution,(9, 10)and energy-loss resulting from multiple inelastic scattering is given by the Landau distribution.(11)Additionally, secondary electrons and bremsstrahlung photons are sampled along the substep, and the necessary atomic relaxation pro-cesses are considered. A substep is determined by dividing an energy step, or the range corresponding to someΔEk, intoM
smaller steps, whereMis an increasing function of the target atomic number. Calculation of the energy steps, substeps, and the necessary electron transport data are completed during a preprocessing stage for a fixed grid ofkenergies. While elec-tron and photon transport is coupled, the impact of photons on the angular distribution is nominal, and therefore, not discussed herein. More detail on the electron-photon transport algorithm is given by Hughes.(12)
step-size, and the treatment of angular deflection attributed to impact-ionization collisions for both the primary and the knock-on electrknock-on (again, details knock-on each of these can be found in the literature(12, 13)).
II. Method
1. Experiment
The characteristics of the experiment are detailed in Rosset al.(8) Below we provide sufficient detail to understand the sim-ulation setup and the validation results. For the purposes of this paper, we consider a beam of electrons emerging from an accelerator exit window (see Fig. 1). The beam is effectively a pencil beam with some spread in space, angle, and energy. However, only the spread in space is considered. The spatial distribution of the experimental beam in transverse directions did not have cylindrical symmetry, but could be approximated by a gaussian with a full-width at half-max of approximately 1-mm.(8) Immediately upstream of the exit window is the scat-tering foil that is followed by the remainder of the apparatus including a transmission monitor chamber, a helium bag, and then the detector.
Figure 1: Schematic of experimental apparatus (not to scale).
To sufficiently resolve the scattered electrons a significant distance between the foil and the detector was required. What would be an air column was replaced by a helium column to reduce the scattering power of the region between the foil and the detector. For this reason, a Mylar bag was constructed to contain the helium.
The scattered electron distributions were measured using both an ionization chamber and diode detectors. The point of measurement was assumed to be the center of the detector. The detectors were mounted on a linear translator positioned orthogonal to the beam line. The detectors were then moved along the translator to determine the fluence at a given radial distance from the beam line that is then converted to angle.
2. Simulation
In this work, the experimental apparatus was approximated by several cylinders. The position and thickness of the cylinders were taken from the description of the key experimental com-ponents in Ross et al.(8) The electron source was placed at the origin and directed along the positive x-axis. The beam was assumed to be Gaussian in the transverse directions with a
FWHM=1-mm. One billion source particles were followed in each simulation. The scoring plane was taken to be the plane orthogonal to the beam located at a point furthest from the source. The F2 surface flux tally was applied to this plane, which was subdivided into rings with increasing radii at 0.1 cm spacings from 0.1 cm out to 21 cm (this is accomplished using theFSor tally segment card).
The default photon physics was used to transport photons; however, it is of interest to note that the new EPRDATA li-brary(7)(i.e. the ".12p" extension) was used for photon data.
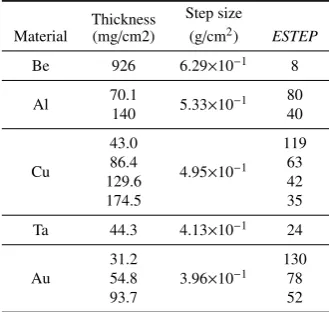
For electrons, three physics settings were studied including the default physics, and two other settings where the impact of modifyingESTEPandEFACare studied in isolation.ESTEP controls the number of substeps per energy step and presum-ably improves accuracy in problems with optically thin regions where electrons stream through these regions without colliding. Under such conditions, truncation of the electron substep is likely and results in an approximation of the angular deflec-tion distribudeflec-tion. Therefore, one can increaseESTEPto ensure at least a few of collisions occur before reaching a boundary. ESTEPis applied to specific materials, so one can modify the substep size only for the material of interest that is contained in the thin cells. One should always keep in mind that reducing the substep size increases runtime. The following two tables present theESTEPsettings necessary to ensure that roughly 10 condensed collisions occur in each foil. These settings corre-spond to results labeled asESTEP. Default values ofESTEP are for the materials used herein are: Be=2, C=3, Al=5, Cu=7, Ta=12, and Au=13.
Table 1:ESTEPparameter analysis for 13-MeV simu-lations. ESTEPwas determined such that there were approximately 10 substeps per foil thickness (that is, electrons will suffer roughly 10 condensed collisions when traversing the foil).
Material
Thickness (mg/cm2)
Step size
(g/cm2) ESTEP
Be 926 6.29×10⁻¹ 8
Al 70.1 5.33×10⁻¹ 80
140 40
Cu
43.0
4.95×10⁻¹ 119
86.4 63
129.6 42
174.5 35
Ta 44.3 4.13×10⁻¹ 24
Au
31.2
3.96×10⁻¹ 130
54.8 78
93.7 52
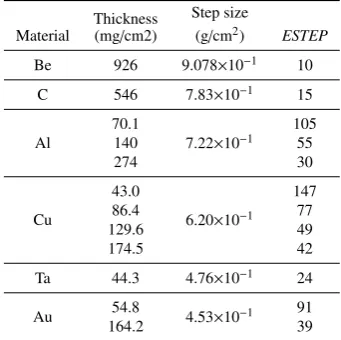
Table 2:ESTEPparameter analysis for 20-MeV simu-lations.ESTEPwas determined such that there were approximately 10 substeps per foil thickness (that is, electrons will suffer roughly 10 condensed collisions when traversing the foil).
Material
Thickness (mg/cm2)
Step size
(g/cm2) ESTEP
Be 926 9.078×10⁻¹ 10
C 546 7.83×10⁻¹ 15
Al
70.1
7.22×10⁻¹ 105
140 55
274 30
Cu
43.0
6.20×10⁻¹ 147
86.4 77
129.6 49
174.5 42
Ta 44.3 4.76×10⁻¹ 24
Au 54.8 4.53×10⁻¹ 91
164.2 39
3. Results Processing
Characteristic angles are determined by fitting a Gaussian to the measured and calculated angular distributions,R(θ), over a partial range. The partial range corresponds to all values where the distributions are greater than approximatelyRmax/eor 1/e
if the distribution is nomalized such that the amplitude is unity. The fit is then used to obtain the characteristic angle by setting the Gaussian equal to 1/eand solving forθ=θ1/e. That is,
R(θ1/e)= Rmax
e =aexp(−θ 2
1/e/b), (1)
whereaandbare the Gaussian fit parameters obtained in the first step. Therefore,
θ1/e=
−bln
R
max ea
, (2)
or ifRmax=a=1,θ1/e=
√
b.
Rosset alprovide the experimental results where the inde-pendent variable is given in either the raw form, or shifted. The shifted results are used herein, as they correspond to a symmetric distribution necessary for a consistent comparison.
III. Results
The characteristic angles of the measured and calculated angu-lar distributions are presented in Tables 4 and 5. In these tables there are several characteristic angles reported as described below:
• Rosset al.: Characteristic angles reported by Rosset al.(8) using the fitting technique described therein.
• Dixon and Hughes: Characteristic angles determined by applying the fitting technique described herein to the data from Ross.(8)
• Calc.: Characteristic angles determined by applying the fit-ting technique described herein to the angular distributions calculated using MCNP6.
Furthermore, there are three different calculated results cor-responding to different physics settings: the default physics; the default physics with modifiedESTEPparameters, and the default physics modifiedEFACparameter of 0.99.
The average difference (i.e. an arithmetic average of the rel. diff. over each of the foils) in the measured and calculated characteristic angle for 13-MeV and 20-MeV electrons for the physics settings tested are presented in Table 3. According to Faddegon(14)et al., for 13-MeV and 20-MeV electrons the average difference in the measured and calculated character-istic angle for EGSnrc was 1.3% and 1.1% respectively; for PENELOPE the average difference was 1.1% and 1.1% respec-tively; and for Geant4 the average difference was 0.7% and 0.9% respectively.
Table 3: Average of the relative differences between measured and calculated characteristic angles for 13-MeV and 20-MeV electrons for three different physics configurations including: default, ESTEP, andEFAC.
Average Relative Difference
Physics Setting 13-MeV 20-MeV
Default 6.4% 5.8%
ESTEP 10.1% 12.2%
EFAC 7.3% 9.5%
The average values presented above were determined from the relative difference results in Tables 4 and 5. The values in Tables 4 and 5 compare characteristic angles corresponding to MCNP6 computed angular distributions (i.e. Calc.) with the Dixon and Hughes column such that a consistent fitting tech-nique is used between the compared results. The characteristic angle reported by Ross(8)was included to demonstrate that the fitting technique used by Dixon and Hughes gives characteristic angles that are in agreement with those reported by Ross.(8)
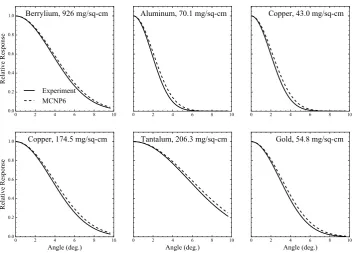
In general, the characteristic angles are overestimated as seen in Tables 4 and 5 and in Figs. 2 and 3. In Figs. 2 and 3, the angular distribution for 13- and 20-MeV electrons on several foils with the default physics are presented.
IV. Conclusions
Table 4: Comparison of measured and calculated characteristic angles for 13-MeV electrons on Be, Al, Cu, Ta, and Au. Three different physics configurations are studied: default,ESTEP, andEFAC=0.99.
Default ESTEP EFAC
Material
Thickness (mg/cm2)
Rosset al.
(deg.)
Dixon & Hughes (deg.)
Calc. (deg.)
Rel. Diff. (%)
Calc. (deg.)
Rel. Diff. (%)
Calc. (deg.)
Rel. Diff. (%)
Be 926 8.143 8.089 8.363 3.382 8.846 9.353 9.081 12.26
Al 70.1 4.003 3.981 4.308 8.223 4.558 14.48 4.289 7.745
140 5.268 5.226 5.602 7.196 5.798 10.93 5.652 8.150
Cu
43.0 4.219 4.167 4.541 8.968 4.745 13.86 4.450 6.786
86.4 5.630 5.562 5.970 7.310 6.161 10.74 5.956 7.056
129.6 6.861 6.803 7.115 4.593 7.323 7.645 7.210 5.989
174.5 7.956 7.911 8.521 7.704 8.681 9.722 8.619 8.938
Ta 44.3 5.558 5.503 5.812 5.608 5.787 5.158 5.799 5.385
Au
31.2 4.878 4.798 5.061 5.473 5.346 11.43 5.164 7.626
54.8 6.329 6.260 6.568 4.911 6.769 8.124 6.650 6.216
93.7 8.243 8.231 8.812 7.052 9.013 9.495 8.986 9.163
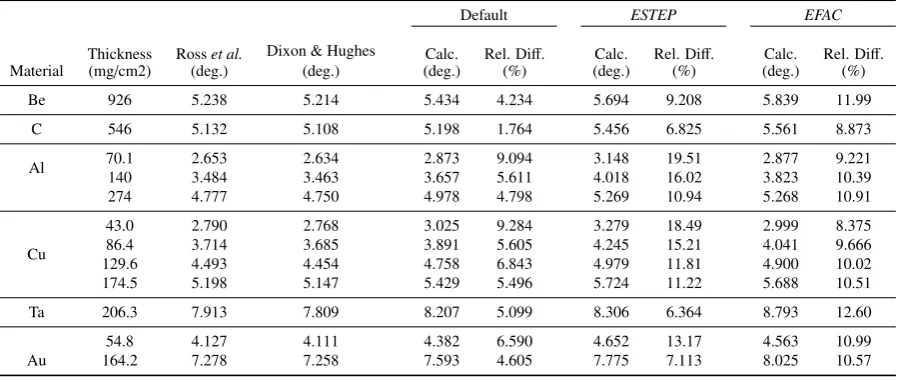
Table 5: Comparison of measured and calculated characteristic angles for 20-MeV electrons on Be, C, Al, Cu, Ta, and Au. Three different electron physics configurations are studied: default,ESTEP, andEFAC=0.99.
Default ESTEP EFAC
Material
Thickness (mg/cm2)
Rosset al.
(deg.)
Dixon & Hughes (deg.)
Calc. (deg.)
Rel. Diff. (%)
Calc. (deg.)
Rel. Diff. (%)
Calc. (deg.)
Rel. Diff. (%)
Be 926 5.238 5.214 5.434 4.234 5.694 9.208 5.839 11.99
C 546 5.132 5.108 5.198 1.764 5.456 6.825 5.561 8.873
Al 70.1 2.653 2.634 2.873 9.094 3.148 19.51 2.877 9.221
140 3.484 3.463 3.657 5.611 4.018 16.02 3.823 10.39
274 4.777 4.750 4.978 4.798 5.269 10.94 5.268 10.91
Cu
43.0 2.790 2.768 3.025 9.284 3.279 18.49 2.999 8.375
86.4 3.714 3.685 3.891 5.605 4.245 15.21 4.041 9.666
129.6 4.493 4.454 4.758 6.843 4.979 11.81 4.900 10.02
174.5 5.198 5.147 5.429 5.496 5.724 11.22 5.688 10.51
Ta 206.3 7.913 7.809 8.207 5.099 8.306 6.364 8.793 12.60
Au
54.8 4.127 4.111 4.382 6.590 4.652 13.17 4.563 10.99
164.2 7.278 7.258 7.593 4.605 7.775 7.113 8.025 10.57
deflection data that is not fully converged. That is, MCNP6 currently allows for no more than 240 series solution terms when computing the angular deflection distributions. In many cases, additional terms are required to ensure that the solution has converged. The code was modified to determine if allowing more terms would improve the angular distributions. We found that allowing for several thousand terms in the computation of the underlying angular deflection distributions, the agreement in the characteristic angle improved by roughly 1% for each of the different physics settings.
Acknowledgments
This work was funded by the US Department of Energy’s Na-tional Nuclear Security Administration, under Los Alamos National Security, LLC, Contract No. DE-AC52-06NA25396. The authors would like to give many thanks to Daren Sawkey for his careful explanation of the validation process for the multiple-scattering experiment.
References
1) T. Goorley et al., “Initial MCNP6 Release Overview,”Nuclear Technology,180, 298 (2012).
2) D. J. Whalen, D. E. Hollowell, and J. S. Hendricks, “MCNP: Photon Benchmark Problems,” LA-12196, Los Alamos National Laboratory (1991).
3) D. P. Gierga and K. J. Adams, “Electron/Photon Verification Calculations Using MCNP4B,” LA-13440, Los Alamos National Laboratory (1999).
4) P. Libby, G. Hughes III, and J. Goorley, “Electron Transmission and Backscatter Verification Calculations Using MCNP5,” LA-UR-03-5751, LANL (2003).
5) D. Dixon and H. Hughes, “Validation of MCNP6 for Electron Energy Deposition in Extened Media,” Trans. Am. Nucl. Soc. (2015).
6) H. G. Hughes, “Improved Logic for Sampling Landau Straggling in MCNP5,” LA-UR-05-4404, Los Alamos National Laboratory (2005).
7) H. G. Hughes, “Recent Developments in Low-Energy Elec-tron/Photon Transport for MCNP6 - Revision 4,” LA-UR-12-24213 rev 4, Los Alamos National Laboratory (2013).
and 20 MeV electrons by thin foils,”Med. Phys.,35, 4121–4131 (2008).
9) S. Goudsmit and J. L. Saunderson, “Multiple Scattering of Elec-trons,”Phys. Rev.,57, 24–29 (1940).
10) S. Goudsmit and J. L. Saunderson, “Multiple Scattering of Elec-trons. II,”Phys. Rev.,58, 36–42 (1940).
11) L. Landau, “On the Energy Loss of Fast Particles by Ionization,” J. Phys.,8, 201 (1944).
12) H. G. Hughes, “Treating Electron Transport in MCNP,” LA-UR-96-4583, Los Alamos National Laboratory (1996).
13) S. M. Seltzer, “An Overview of ETRAN Monte Carlo Meth-ods,” Proc. Monte Carlo Transport of Electrons and Photons, volume 38 ofEttore Majorana International Science, p. 153–181, Physical Sciences, Plenum Press, 1988.
Figure 2: Comparison of Gaussian fits to experiment (solid curve) and calculated (dashed curve) angular distributions for 13-MeV electrons on various foils.