Electronic nose-based technique for rapid detection and
recognition of moldy apples
Wenshen Jia
1,3,4,5, Gang Liang
1,3,4*, Hui Tian
1,3,4,5, Jing Sun
2,6, Cihui Wan
1 1. Beijing Research Center for Agricultural Standards and Testing, Beijing Academy of Agricultureand Forestry Science, Beijing 100097 PRChina
2. Chinese Academy of Agricultural Engineering, Beijing 100121, PRChina;
3. Risk Assessment Lab for Agro-products (Beijing), Ministry of Agriculture, Beijing 100097,
PRChina
4. Beijing Municipal Key Laboratory of Agriculture Environment Monitoring, Beijing 100197,
PRChina
5. Key Laboratory of Urban Agriculture (North China), Ministry of Agriculture and Rural Affairs,
Beijing 100097, PRChina
6. Key laboratory of Agro-Products Postharvest Handling, Ministry of Agriculture, Beijing 100121,
PRChina
*Corresponding Authors: [email protected];
Tel.: +86-10-51505523
Abstract:
In this paper, PEN3 electronic nose was used to detect and recognize fresh and moldy apples
(inoculated with Penicillium expansum and Aspergillusniger) taken Golden Delicious apples as model subject. Firstly, the apples were divided into two groups: apples only inoculated with different
molds (Group A) and mixed apples of inoculated apples with fresh apples (Group B). Then the
characteristic gas sensors of the PEN3 electronic nose that were most closely correlated with the
flavor information of the moldy apples were optimized and determined, which can simplify the
analysis process and improve the accuracy of results. Four pattern recognition methods, including
linear discriminant analysis (LDA), backpropagation neural network (BPNN), support vector
machines (SVM) and radial basis function neural network (RBFNN), were then applied to analyze
the data obtained from the characteristic sensors, respectively, aiming at establishing the prediction
model of flavor information and fresh/moldy apples. The results showed that only the gas sensors
of W1S, W2S, W5S, W1W and W2W in the PEN3 electronic nose exhibited strong signal response
to the flavor information, indicating were most closely correlated with the characteristic flavor of
apples and thus the data obtained from these characteristic sensors was used for modeling. The
results of the four pattern recognition methods showed that BPNN presented the best prediction
performance for the training and validation sets for both the Group A and Group B, with prediction
accuracies of 96.29% and 90.00% (Group A), 77.70% and 72.00% (Group B), respectively.
Therefore, it first demonstrated that PEN3 electronic nose can not only effectively detect and
recognize the fresh and moldy apples, but also can distinguish apples inoculated with different
molds.
Keywords: Electronic nose; apple; mildew; pattern recognition; artificial neural network;
1. Introduction
Apples are widely consumed because of their rich vitamin, water, and dietary fiber contents.
The apple industry, with an annual total output of more than 40 million tons, has become the first
major fruit industry in China. Unfortunately, because of improper storage after harvesting, apples
are vulnerable to diseases induced by various internal and external factors and infections by
pathogenic microorganisms, resulting in serious post-harvest losses [1, 2]. A few moldy apples,
which can be difficult to find from the surface in time, may lead to greater losses in the absence of
a prompt solution. Therefore, development of a rapid and nondestructive detection method for
moldy apples will help to guarantee the safety and quality of apples during storage and improve the
competitiveness of Chinese apples in the global market. And it will help fruit farmers reduce their
economic losses and help satisfy consumers by assuring the quality of the apples.
Methods such as gas chromatography [3], gas chromatography–mass spectrometry [4], stable
isotope identification, and fluorescence spectroscopy have long been used to analyze the variety and
concentrations of single substances in materials under test. However, these methods require
expensive instrumentation and fail to evaluate the tested materials comprehensively [5], despite
their high accuracy. Most importantly, they are time-consuming and are ineffective in rapid
detection applications. The electronic nose technology that imitates the functions of the human
olfactory system has seen rapid development in recent years. It can realize recognition of the
characteristic information of complex flavors [6, 7] and provide superior performance in terms of
response time, detection speed, evaluation range, and repeatability [8]. An electronic nose consists
of two parts: a gas sensor array and a pattern recognition system [9, 10]. The gas sensor array collects
the flavor characteristic information of the sample under test and sends the resulting data to the
pattern recognition system. The pattern recognition system then processes the data and outputs the
detection results for specific qualities of the samples. Commonly used pattern recognition methods
used for electronic noses include principal component analysis (PCA) [11], linear discriminant
analysis (LDA) [12, 13], support vector machines (SVM) [14, 15] and artificial neural networks
(ANNs) [16, 17].
There have been numerous reports of the application of electronic noses in different
agricultural product detection. For example, Russo et al. investigated the classification of red onion
accuracy of the DFA (Deterministic Finite Automaton) model used in their research was as high as
97.5%. Konduru et al. tested onions with sour skin disease using an electronic nose composed of
nine metal oxide sensors, and the prediction model established attained an accuracy of 85% [19].
Biondi et al. used a PEN3 electronic nose (Airsense Company, Germany) in a survey of common
ring rot and brown rot in potatoes [20]. The prediction model in their research achieved the
recognition accuracy of 81.3%. Cheng et al. studied tomato seedlings that had been infected with
early blight using a PEN2 electronic nose (Airsense Company, Germany) and obtained an optimum
model accuracy of 87.5% [21]. In addition, electronic noses have also be applied to mildew detection
in grain crops. Yin et al. explored the effects of different features combination characterizations for
identifying the moldy maize by using a homemade electronic nose [22]. And a positive judgment
rate of 96% was obtained with Fisher discrimination analysis. Lippolis et al. used the ISE Nose 2000
electronic nose to wheat mold detection by using the fungal volatile metabolite deoxynivalenol
(DON) of wheat as the detection index [23]. The DFA model used in this research yielded a
recognition rate of 86.7% for durum wheat.
Until now, researchers are also working on fruit disease detection using electronic noses [24].
For example, Zhu applied the PEN3 electronic nose to classify and identify strawberries that had
been artificially inoculated with three pathogens and obtained satisfactory results [25]. In addition,
researches with regard to the application of electronic noses to the volatile flavor characteristics
information of apples are currently well-established. However, the researchesare mostly focused on
differences among varieties [26], freshness identification [27], and storage time prediction of the
apples [28, 29], along with the detection, analysis, and application of quality and nutrition
information [30]. While little attention has been paid to the detection of mildew in apples, especially
discrimination of different mildew.
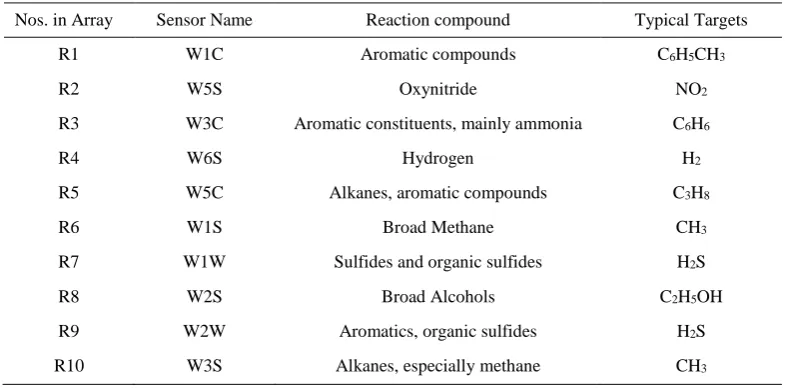
Therefore, inspired by previous researches, PEN3 electronic nose (It has 10 different built-in
metallic oxide gas sensors that can realize the detection and identification of various common gases,
shown in Table 1) was used to detect and recognize fresh and moldy apples (artificial inoculation
with Penicillium expansum and Aspergillusniger on Golden Delicious apples) in this study. To simplify the analysis process and improve the prediction accuracy, the gas sensor arrays of the PEN3
electronic nose were optimized and determined. And four pattern recognition methods, including
(RBFNN), were respectively compared to analyze the characteristic flavor data for establishing the
prediction model of flavor information for fresh/moldy apples.
Table 1. Performance of the sensor arrays of the PEN3 electronic nose
Nos. in Array Sensor Name Reaction compound Typical Targets
R1 W1C Aromatic compounds C6H5CH3
R2 W5S Oxynitride NO2
R3 W3C Aromatic constituents, mainly ammonia C6H6
R4 W6S Hydrogen H2
R5 W5C Alkanes, aromatic compounds C3H8
R6 W1S Broad Methane CH3
R7 W1W Sulfides and organic sulfides H2S
R8 W2S Broad Alcohols C2H5OH
R9 W2W Aromatics, organic sulfides H2S
R10 W3S Alkanes, especially methane CH3
2 Materials and methods
2.1 Materials
The apples samples used in the experiments were Golden Delicious apples picked from an
orchard in the Changping District in Beijing. And the apples were mature and fresh, all had a similar
color, and were without surface damage and diseases. The inoculated molds were Penicillium expansum and Aspergillus niger; potato agar was used as the culture medium (Sinopharm Chemical Reagent Beijign Co., Ltd, China, Analytical grade). All other solutions were prepared with Milli-Q
water (18.2 MΩ/cm resistivity) from a Millipore Milli-Q system (Thermo Scientific EASYpure II).
All glassware ware was pre-washed three times with Milli-Q water and then dried in an oven.
2.2 Method of mold inoculation
2.2.1 Culture and purification of the molds
Firstly, the molds were made into suspensions using the pour plate method; these suspensions
were then diluted using sterile water into proportions of 1:10, 1:100, and 1:1000. We took 1 ml from
each diluted solution and mixed each solution with sterilized but uncondensed potato agar (acting
as the culture medium). After being evenly shaken, the mixed solutions were poured into culture
dishes and kept until natural coagulation occurred. The mold plates made as described above were
obtained were then sealed in sterile environments and preserved in a refrigerator at 2 °C for direct
use in the future experiments.
2.2.2 Mold inoculation of apples
Firstly, the apple samples were aired naturally on a sterile workbench after being cleaned using
alcohol with purity of 75%. Each apple was then drilled with four holes located at different positions
on the surface using an inoculation needle. The holes were filled with the pure colonies of
Penicillium expansum and Aspergillus niger from the culture dishes by using an inoculation ring and were then covered using sterile seal films. The inoculated apples were placed into sterile beakers
and sealed using further seal films. The samples were then placed into a thermostat incubator (25 ℃)
and cultured for five days until mildew appeared. Before the experiments began, the inoculated
apples were carefully observed to ensure that they had been impregnated by the molds.
2.3 Apples sample set division
Before PEN3 electronic nose measurement, the apple samples were divided into two groups:
individual apple only inoculated with/withoutone mold (single sample group, Group A) and mixed
apples of inoculated apples with fresh apples (canned sample group,Group B). The canned sample
group consisted offresh apples and moldy apples (inoculated with single molds of Penicillium expansum and Aspergillus niger, respectively) with a 9:1 ratio, and placed in a sealed canenvironment. Further, the apple samples of Group A and Group B were randomly divided into
training set and validation set, training set A (TA) and validation set A (VA) for Group A and training
set B (TB) and validation set B (VB) for Group B, respectively. The training set was used for
building the prediction model, and the validation set was used for validating the prediction model.
2.4 Characteristic data collection of apples using electronic nose
The PEN3 electronic nose is applied to collecting the characteristic flavor of the apples. Briefly,
the inoculated apples were sealed and placed at room temperature for 30 min after they were
removed from the incubator. And headspace sampling was then initiated using the PEN3 electronic
nose by inserting the sampling and pressure-stabilizing needles into the headspace of the beaker and
drawing the flavor from the beaker for 150 s after cleaning for 70 s. Using the PEN3 detection figure,
it was found that the response value of the sensor tended to be stable after 50 s, based on comparison
and analysis. Therefore, the data acquired after 60 s was used as the effective data for the data
2.5 Data preprocessing of the electronic nose
The data preprocessing system is as an important link in the electronic nose system. The
sampled signals were transmitted to the data preprocessing system for analysis and processing,
while the pattern recognition system is used to realize qualitative identification of the gas. An
effective data preprocessing algorithm can reduce the data errors and improve system reliability
[31]. Simultaneously, it contributes to acquisition of more accurate analysis results and thus more
believable conclusions.
When the gas under test reaches a stable contact state with the gas sensor array, the response
value gradually tends to reach a constant level. However, slight fluctuations are unavoidable because
of noise inference during data collection. Therefore, preprocessing using a data preprocessing
algorithm is a necessary step. The main denoising methods that are commonly used in the electronic
nose system include the smoothing method and the baseline correction method.
2.5.1 Six-point smoothing algorithm
The data curve obtained using a metal-oxide-semiconductor (MOS) sensor shows that the
six-point smoothing algorithm is effective for denoising. The operator for the six-six-point smoothing
algorithm is expressed as:
g(i) =sum(f(i: i + h − 1)) − max(f(i: i + h − 1)) − min(f(i: i + h − 1)) h − 2
where:
f(i:i+h−1) refers to all response values between f(i) and f(i+h−1);
f(i) represents the response value at time point I;
g(i) is the response value at time point i after smoothing; and
h denotes the smoothing step size.
Data preprocessing using the above algorithm can effectively reduce the interference produced
by noise.
2.5.2 Baseline correction
The baseline of the electronic nose refers to the variation curve of the blank background with
time in the case where no test gas is in contact with sensor, which is generally regarded as noise
interference [32]. Because the electronic nose is used in detection applications, the air inlet chamber
increases, thus resulting in environmental changes. It is therefore necessary to conduct baseline
correction of the data to explore the response values between the gas sensor and its environment,
while also ensuring the repeatability and accuracy of the experiments. During baseline correction,
the datum Y(i) obtained at the selected time point X(i)−MinX(i) is used as the response value at time
point t.
3 Results and disscussion
3.1 Mold culture and inoculation on apple
As described in section 2.2.1, the molds of Penicillium expansum and Aspergillus niger were first cultured in the culture dishes with potato agar as the culture mediumby using the plate streak
method. Keeping at 25°C and five days later, the filamentous single pure colonies of Penicillium expansum, Aspergillus niger were obtained (shown in Figure 1b, 1c, respectively). The pure colonies obtained were then sealed in sterile environments and preserved in a refrigerator at 2 °C for direct
use in the future experiments.
a) b) c)
Figure 1. Cultured molds: a) culture medium without mold b) Penicillium expansum; c) Aspergillus niger. (Conditons: culture at 25°C for 5 days)
Next, the pretreated apples were inoculated with the cultured pure molds by filling the holes
drilled at the apple surface using the inoculation ring (the left holes after sampling shown in Figure
1). The inoculated apples were placed into sterile beakers, sealed using further seal films, and kept
at 25 ℃.As shown in Figure 2, the mildew appeared on the apple surface (Figure 2b, 2c) after five
days, which also confirming the apples were successfully impregnated by the different molds. And
a) b) c)
Figure 2. Apple samples inoculated with different molds: a) No mold (fresh apple); b) Penicillium expansum; c)
Aspergillus niger. (Conditons: kept at 25°C for 5 days)
3.2 Determination of Characteristic flavorgas sensors
Figure 3. The gas sensors responses of PEN3 electronic nose to apples inoculated with different mold
As shown in Table 1, PEN3 electronic nose has 10 different built-in metallic oxide gas sensors,
and it will simultaneously collect 10 sets of data information in one measurement. However, some
of these data information are not characteristic flavor information for fresh/moldy apples. To
simplify the subsequent analysis process and improve the prediction accuracy, the gas sensor arrays
of the PEN3 electronic nose were first optimized to determine the characteristic flavor sensors for
fresh and moldy apples. Then the response of PEN3 electronic nose to the fresh and moldy apples
(apples inoculated separately with Aspergillus niger and Penicillium expansum) were explored and the characteristic values were extracted from the collected data of the ten sensors. As shown in
1 2 3 4 5 6 7 8 9 10
0 2 4 6 8 10 12 14 16 18
R R R R R R R R R R
S
ig
n
a
l
re
sp
o
n
se
Different gas sensors
Aspergillus nigerFigure 3, it can be noticed that the sensors give different signal for the four sets of samples measured,
and only sensors of nos. R2, R6, R7, R8, and R9 (namely W5S, W1S, W1W, W2S and W2W)
exhibited strong responses to the four sets of apple samples, indicating these sensors are the
characteristic flavor gas sensors for apples. Therefore, the data collected from the sensors of W5S,
W1S, W1W, W2S and W2W were used for data analysis in our study.
3.4 Data analysis
Four pattern recognition methods of including LDA, BPNN, SVM and RBFNN were
respectively applied to analyze the data obtained from the characteristic sensors optimized for the
prediction model of flavor information and fresh/moldy apples.
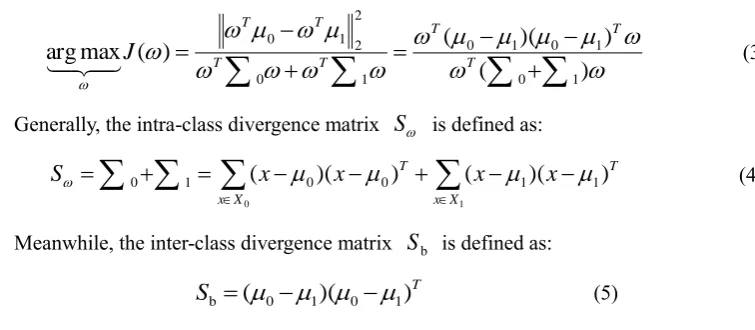
3.4.1 LDA analysis
The purpose of LDA is to find a projection that maps the original sample space to the low-dimensional space, so that the projection of high-low-dimensional data on the low-low-dimensional space can make the samples within the class more clustered, and the samples of different categories are separated to the greatest extent. Suppose data set D={(x1,y1),(x2,y2),...,((xm, ym))}, where any sample xi is an n-dimensional vector, yi∈{0,1}. Define Nj (j = 0, 1) for the number of sample j, Xj (j = 0, 1), for the collection of sample j, and (j = 0, 1) for the mean vector of sample j, define (j
= 0, 1) for the covariance matrix of sample j.
is expressed as: (1)
is expressed as: (2)
Assuming that our projection line is the vector , then the projection of any sample xi on the line is , and the projection of center points of two categories in the line is
and .
Optimization objective is:
(3)
Generally, the intra-class divergence matrix is defined as:
(4)
Meanwhile, the inter-class divergence matrix is defined as:
(5) j
jj
=
=
j X x jj
x
N
(
0
,
1
)
1
j
j
j=
(
−
)
(
−
)
(
=
0
,
1
)
j
x
x
j TX x j j
T ix
0,
1
0
T 1
T
(
)
)
)(
(
)
(
max
arg
1 0 1 0 1 0 1 0 2 2 1 0
+
−
−
=
+
−
=
T T T T TT T
J
S
T X x T X xx
x
x
x
S
0 1(
0)
(
0)
(
1)
(
1)
1 0
=
+
=
−
−
+
−
−
bS
TThus, our optimization objective can be rewritten as:
(6)
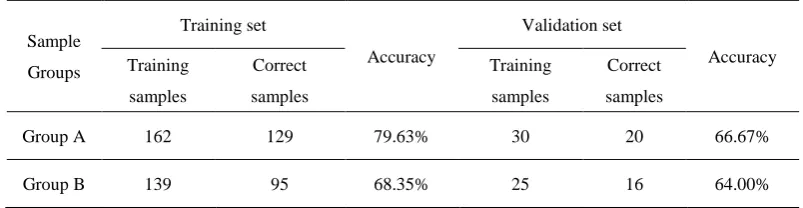
By using LDA algorithm, the test results of prediction accuracies were analyzed and shown in
Table 2. As listed in Table 2, it can be seen that the LDA algorithm obtained the prediction accuracies
of 79.63% for TA, 68.35% for TA of the training sets, 66.67% for TB, 64.00 for VB of the validation
sets. The prediction accuracies were all lower than 80%, and lower than 70% for sets of TB, VA,
VB, indicating that the LDA algorithm showed poor performance, and was not suitable for
fresh/moldy apple discrimination.
Table 2 The test results of LDA algorithm
Sample Groups Training set Accuracy Validation set Accuracy Training samples Correct samples Training samples Correct samples
Group A 162 129 79.63% 30 20 66.67%
Group B 139 95 68.35% 25 16 64.00%
3.4.2 SVM analysis
Support Vector Machine (SVM) is a generalized linear classifier that carries out binary
classification on data according to supervised learning, and its decision boundary is the
maximum-margin hyperplane that is solved for learning samples.
The feature values extracted by the PEN3 electronic nose are taken as the input, and the
category as the output. The model is built by LibSVM toolbox.Usually, (x, y) is based on the
difference between the model output of f(x) and the real value yi to calculate the loss is, if and only if f(x) = yi , loss is zero. The basic idea is to allow the deviation between the predictive value of f(x) and yi maximum to Ɛ, when |f(x)-yi| <Ɛ, indicating correct prediction, regardless of the loss; only when the |f(x)-yi| >Ɛ, then calculate the loss.SVM problem can be described as follows:
min
𝜔 ⃗⃗⃗ ,𝑏(
1 2‖
𝜔
⃗⃗⃗ ‖2
+ 𝐶 ∑𝑛𝑖=1𝐿𝜀(𝑓(
𝑥
⃗⃗ ) − 𝑦𝑖)) (7)γ =
‖𝜔⃗⃗⃗ ‖2 (8)The punishment coefficient C=10, and the regular coefficient γ=0.1
In the selection of kernel functions, different kernel functions are tried, and the kernel function with the minimum inductive error is the best kernel function. In this paper, the core function uses the radial basis kernel function. TA and TB apple samples were used to build a characteristic
S
S
j
T bT
=
relationship model based on SVM, while VA and VB apple sampleswere used as validation sets. The prediction results were presented in Table 3.
Table 3 The test results of SVM algorithm
Sample Groups
Training set
Accuracy
Validation set
Accuracy Training
samples
Correct samples
Training samples
Correct samples
Group A 162 153 94.44% 30 24 80.00%
Group B 139 98 70.50% 25 16 64.00%
As shown in Table 4, the yielded prediction accuracies with SVM algorithm were 94.44% for
TA, 80.00% for VA, and 70.50% for TB, 64.00% for VB, respectively. The results indicated that
SVM algorithm showed good performance for discrimination of Group Aapple samples inoculated
with different molds (validation accuracy 80.00%), but bad recognition performance for Group B
apple samples (validation accuracy 64.00%).
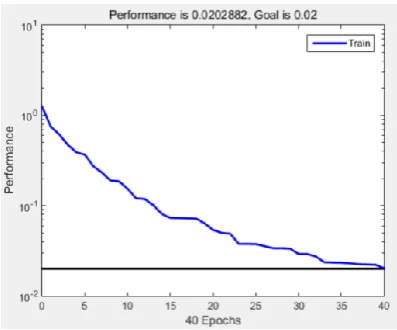
3.4.3 RBFNN analysis
Fistly, the parameters were set for RBFNN analysis. The learning rate was set to 0.08, the
momentum factor to 0.1, the maximum iteration epoch to 10000, and target accuracy to 0.02. Then
the training data were input into the RBFNN, and the network structure was initialized to train the
network. By judging threshold results of the stable error, adjusting the center and the weight of the
hidden layer, and increasing the number of training epochs. Finally, the training set was predicted
when the error was reduced below the pre-set threshold. The result of the RBFNN iteration process
for the moldy apple samples was shown in Figure 4.
Figure 4. Diagram of the RBFNN iteration process result
0.020 after 40 training epochs, which meets the maximum error requirements. Furthermore,
constantly increasing the training epochs had little effect on the final recognition results obtained
after 40 epochs (data not shown), and was time-consuming. Therefore, the designated training epoch
number was set at 40 epochs. Then the RBFNN model was constructed for the TA, VA, TB and VB
sets, respectively. The prediction results were listed in Table 3 below.
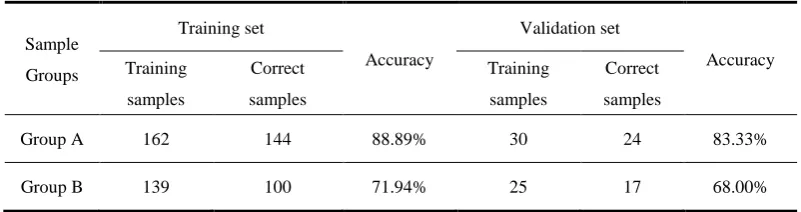
Table 4 The test results of RBFNN algorithm
Sample Groups
Training set
Accuracy
Validation set
Accuracy Training
samples
Correct samples
Training samples
Correct samples
Group A 162 144 88.89% 30 24 83.33%
Group B 139 100 71.94% 25 17 68.00%
As shown in Table 4, the RBFNN algorithm yielded prediction accuracy of 88.89% for TA,
83.33% for VA, and 71.94% for TB, 68.00% for VB, respectively. The validation accuracy was as
high as 83.33% for Group A, but was only 68.00% for Group B (a little higher than that of LDA,
SVM), indicating the RBFNN algorithm also showed bad recognition performance for
discriminating moldy apples of Penicillium expansum and Aspergillus niger, if mixed with fresh apples.
3.4.4 BPNN analysis
BPNN, which learning processis realized by constantly error backpropagation. In this process,
the input information propagates forward, while the errors propagate backward. By a process of
constant iteration, training is finally suspended when the error accuracy is reduced to below a preset
value or the number of training epochs is maximized.
The input and output in the BPNN are related as follows:
Input (9)
Output (10)
As the convergence speed can be changed by adjusting the value of net in Equation (10), so the value of net should be controlled within a rapid convergence range during the calculations. Similarly, in this experiment, data of TA and TB was used to build a characteristic relationship model, while data of VA and VB was used as prediction sets. The prediction results were presented in Table 5.
1
n
n
i i i
et
X W
=
=
1
(
)
1
nety
f net
e
−Table 5 The test results of BPNN algorithm
Apple Groups
Training set
Accuracy
Validation set
Accuracy Training
samples
Correct samples
Training samples
Correct samples
Group A 162 156 96.29% 30 27 90.00%
Group B 139 108 77.70% 25 18 72.00%
As listed in Table 5, the judgement accuracies were 96.29% for TA, 90.00% for VA, and 77.70%
for TB, 72.00% for VB, respectively. It showed that higher prediction accuraciesof 90.00% and
validation accuracies of 72.00% were respectively obtaind for Group A and Group B apple samples
by using BPNN algorithm. The results also confirmed that the PEN3 electronic nose showed good
recognition performance for discriminating fresh and moldy apples, moldy apples inoculated with
different molds (Aspergillus niger, Penicillium expansum).
Table 6 Comparison of the recognition accuracies of the four algorithms for the two groups
Sample Groups Algorithm Recognition rate of
training set
Recognition rate of validation set
Group A
LDA 79.63% 66.67%
SVM 94.44% 80.00%
RBFNN 88.89% 83.33%
BPNN 96.29% 90.00%
Group B
LDA 68.35% 64.00%
SVM 70.50% 64.00%
RBFNN 71.94% 68.00%
BPNN 77.70% 72.00%
For better comparison, an overview of the performance of the four algorithms for moldy apples
recognition was listed in Table 6. As shown in Table 6, it's obvious that the BPNN algorithm showed
the best performance for recogniston fresh/moldy (Aspergillus niger, Penicillium expansum) apples compared to the other three algorithm, so BPNN algorithm should be firstly considered as the
optimized algorithm in the future study. However, the recognition accuracies of the four algorithm
for Group B apple samples (canned sample group) were all lower than those of the Group A apple
samples (single sample group), this could be explained the collected flavor information of the
mildew infected apples was more or less influenced by the mixed fresh apples. But the later was
4 Conclusions
In this study, PEN3 electronic nose system was used to detect and recognizemoldy apples
inoculated with Penicillium expansum and Aspergillusniger. Based on the results discussed above, it could be described as follows:
(1) Firstly, the pure molds of Penicillium expansum and Aspergillus niger were cultured using the plate streak method and used for apples inoculation. Then, the apple samples were divided into
two groups: individual apple only inoculated with single mold (single sample group) and mixed
apples of inoculated apples with fresh apples (canned sample group).
(2) Secondly, the gas sensor arrays of the electronic nose system were optimized to determine
the characteristic sensors that most closely correlated with the flavor information of the mildew
infected apples (designated the W5S, W1S, W1W, W2S, and W2W), and then applied for data
collection, which greatly simplifed the analysis procedure and improved the results accuracy.
(3) Thirdly, four pattern recognition methods, including LDA, BPNN, SVM and RBFNN, were
respectively used to model the date obtained from the characteristic sensors. The results showed that
BPNN presented the best recognition accuracy for the two Groups, and a higher recognition
accuracies was abtained for Group A apple samples.
In conclution, the findings in this study proved that PEN3 electronic nose could not only
effectively detect and recognize fresh and moldy apples, but also can distinguish moldy apples
inoculated with Penicillium expansum and Aspergillusniger. Furthermore, the electronic nose technology can meet the demands of rapid, low-cost, nondestructive detection merits, which also
provide references for developing detection equipment of mildew apple in the future.
Acknowledgments
We are grateful for financial support from the Beijing Agricultural Forestry Academy Youth
Fund (NO. QNJJ201630), the Special Projects of Construction of Science and Technology
Innovation Ability of Beijing Academy of Agriculture and Forestry Sciences (NO.
KJCX20170420), the Beijing Natural Science Foundation (L182031), the National Natural
Science Foundation of China (NO. 21806013, 31801634, 21806014), the International
Cooperation Fund of Beijing Agricultural Forestry Academy (NO. GJHZ2018-05), the Project of
Beijing Science and Technology (NO. Z171100001517017), the Project of Beijing Excellent
Agro-products of the Ministry of Agriculture (NO. KFKT201707). We also thank David MacDonald,
MSc, from Liwen Bianji, Edanz Editing China (www.liwenbianji.cn/ac), for editing the English text
of a draft of this manuscript.
Author Contributions
Gang Liang principally conceived the idea for the study, and was in charge of the
project management, revising this manuscript, and approval of the manuscript.
Wenshen Jia, Hui Tian, Cihui Wan performed the experiments. Hui Tian, Cihui Wan
Jing Sun analyzed the data. Gang Liang, Wenshen Jia was responsible for the
preparation of this manuscript. All authors participated in some form in the concept,
experimentation, writing, and editing of this manuscript. All authors read and approved
the manuscript.
Conflicts of Interest The authors declare no conflict of interest.
References
1. Hu, Q. Y.; Hu T. L.; Wang Y. N.; Wang, S. T.; Cao, K. Q., Survey on the occurrence and
distribution of apple diseases in China. Plant Prot. 2016, 42, 175-179.
2. Yu, Q. G.; Gong, M. B.; Wei, S. W.; Zheng, X. Q.; Zhang, Y. W.; et al. Classification and
identification of apple diseases, Northern Hortic. 1998, 6, 47-48.
3. Liang, J.; Li, H. F.; Zhao, Z. Y.; Fan, M. T., Determination of cyhalothrin pesticide residue in
apple by capillary GC method. Agric. Res. Arid Areas 2008, 26, 49-50.
4. Fan, L.; Ren, X. L.; Xiang, C. Y.; Kang, J., Aroma quality of Gala apple during storage evaluated
by electronic nose and gas chromatography-mass spectrometry. Food Sci. 2014, 35, 164-169. 5. Qu, Y. L.; Gong Y. J., Application of near infrared spectroscopy in nondestructive testing of apple
quality. Agric. Sci.Technol. Equipment 2014, 6, 32-33.
6. Jin, C. Y.; Cui, Y.; Wang Y., Electronic nose and its latest research progress in various fields.
Sensors World 2010, 16, 6-10.
7. Xu, S.; Sun, X.; Lu, H.; Yang, H.; Ruan, Q.; Huang, H.; Chen, M., Detecting and monitoring the
flavor of tomato (solanum lycopersicum) under the impact of postharvest handlings by
physicochemical parameters and electronic nose. Sensors 2018, 18, 1847-1861.
quality: A mini review. Food Anal. Methods 2018, 11, 2916-2924.
9. Gardner J. W.; Bartlett P. N.; A Brief History of Electronic Nose. Sens. Actuators B Chem. 1994, 18-19, 211-220.
10. Persaud, K.; Dodd, G., Analysis of discrimination mechanisms in the mammalian olfactory
system using a model nose. Nature 1982, 299, 352-355.
11. Noureddine, E. B.; Eduard, L.; Nezha, E. B.; OrcID, N. E. B.; Xavier, C.; Benachir, B.B.,
Electronic Nose Based on Metal Oxide Semiconductor Sensors as an Alternative Technique for the
Spoilage Classification of Red Meat. Sensors 2008, 8,142-156.
12. Li, H. H.; Chen, Q. S.; Zhao, J. W.; Ouyang, Q., Non-destructive evaluation of pork freshness
using a portable electronic nose (E-nose) based on a colorimetric sensor array. Anal. Methods 2014, 6, 6271-6277.
13. Di Rosa, A.R.; Leone, F.; Cheli, F.; Chiofalo, V., Fusion of electronic nose, electronic tongue
and computer vision for animal source food authentication and quality assessment -A review. J. Food Eng. 2017, 210, 62-75.
14. Śliwińska, M.; Wiśniewska, P.; Dymerski, T.; Namieśnik, J.; Wardencki W., Food analysis using
artificial senses. J. Agric. Food Chem. 2014, 62, 1423-1448.
15. Śliwińska, M., Wiśniewska, P.; Dymerski. T.; Namieśnik, J.; Wardencki, W., Food analysis using
artificial senses. J. Agric. Food Chem. 2014, 62, 1423-1448.
16. Haddi, Z.; Mabrouk, S.; Bougrini, M.; Tahri, K.; Sghaier, K.; Barhoumi, H.; El Bari, N.; Maaref,
A.; Jaffrezic-Renault, N.; Bouchikhi, B., E-Nose and e-Tongue combination for improved
recognition of fruit juice samples. Food Chem. 2014, 150, 246-253.
17. Borràs, E.; Ferré, J.; Boqué, R.; Mestres, M.; Aceña, L.; Busto, O., Data fusion methodologies
for food and beverage authentication and quality assessment -A review. Anal. Chim. Acta 2015, 891,
1-14.
18. Russo, M.; di Sanzo, R.; Cefaly, V.; Carabetta, S.; Serra, D.; Fuda, S., Nondestructive flavor
evaluation of red onion (Allium cepa L) Ecotypes: An electronic-nose-based approach. Food Chem.
2013, 141, 896-899.
19. Konduru, T.; Rains, G. C.; Li, C., Detecting sour skin infected onions using a customized gas
sensor array. J. Food Eng. 2015, 160, 19-27.
electronic nose : From laboratory to real scale. Talanta 2014, 129, 422-430.
21. Cheng, S. M.; Wang, J.; Wang, Y. W.; Ma, Y. H.; et al. Research on distinguishing tomato seeding
infected with early blight disease by electronic nose. Bulletin Sci. Technol. 2013, 29, 68-77. 22. Yin, Y.; Hao, Y. F.; Yu, H. C., Identification method for different moldy degrees of maize using
electronic nose coupled with multi-features fusion. Trans. CSAE 2016, 32, 254-260.
23. Lippolis, V.; Pascale, M.; Cervellieri, S.; Damascelli, A.; Visconti, A., Screening of
deoxynivalenol contamination in durum wheat by MOS-based electronic nose and identification of
the relevant pattern of volatile compounds. Food Control 2014, 37, 263-271.
24. Cortellino, G.; Gobbi, S.; Rizzolo, A., Monitoring shelf life of fresh-cut apples packed in
different atmospheres by electronic nose. Acta Hortic. 2016, 1120, 71-78.
25. Zhu, N.; Mao, S. B.; Zhu, L. Q.; Yuan, L. J.; Tu, K., Early detection of fungal disease infection
in strawberry fruits by e-nose during postharvest storage. Trans. Chin. Soc. Agric. Eng. 2013, 29, 266-273.
26. Distinguishing different cultivar apples by electronic nose on support vector machine. Trans.
CSAE 2007, 23, 146-149.
27. Hui, G. H.; Wu, Y. L.; Ye, D. D.; Ding, W. W., Fuji apple storage time predictive method using
electronic nose. Food Anal. Methods 2013, 6, 82-88.
28. Li, Y.; Ren, Y. M.; Zhang, S.; Zhao, H.; Zhou, L. A.; Ren, X. L.; et al. Prediction of
low-temperature storage time and quality of apples based on electronic nose. J. Northwest Univ. 2015, 5, 183-191.
29. Cortellino, G.; Gobbi S.; Rizzolo A., Monitoring shelf life of fresh-cut apples packed in different
atmospheres by electronic nose. Acta Hortic. 2016,10, 71-78.
30. Zhang, P.; Li, J. K; Chen S. H., The electronic nose 1-MCP at room temperature different time
apple discriminant analysis. Northern Hortic. 2015, 12, 119-124.
31. Lin, W.; Wu, L. M.; Tang, D. Y.; Cheng, W.; Zhou, J.; el al. Research on novel electronic nose
preprocessing algorithm. J. Wuhan Univ. Technol. 2016, 38, 88-95.