1071-412X/04/$08.00⫹0 DOI: 10.1128/CDLI.11.1.168–173.2004
Copyright © 2004, American Society for Microbiology. All Rights Reserved.
Establishment of Adult Peripheral Blood Lymphocyte Subset Reference
Range for an Asian Population by Single-Platform Flow Cytometry:
Influence of Age, Sex, and Race and Comparison
with Other Published Studies
Wee J. Chng,
1,2* Guat B. Tan,
2and Ponnudurai Kuperan
2Department of Haematology-Oncology, National University Hospital,1and Department of Pathology and
Laboratory Medicine, Tan Tock Seng Hospital,2Singapore, Republic of Singapore
Received 11 August 2003/Returned for modification 25 September 2003/Accepted 7 November 2003
We established a normal reference range for peripheral blood lymphocyte subsets in a multiracial adult
pop-ulation by using single-platform flow cytometry. Further analysis of our cohort showed that the CD8ⴙ-cell
counts decrease with age, there is a gender difference in NK cell percentages and counts, and there are
signifi-cant differences in the CD3ⴙ-, CD4ⴙ-, and CD19ⴙ-cell counts between Indians and other racial groups.
Over-all, our results are significantly different from other published data. This difference further stresses the need for different populations to establish their own reference ranges as these may have important implications for the management of patients with human immunodeficiency virus and AIDS. The use of single-platform flow cytometry will eliminate some of the variability between different study centers, making studies more compara-ble. This platform should be used for future studies into the effects of age, sex, and race on lymphocyte subsets.
Tremendous progress has been made in the field of flow cytometry in the last 2 decades. With the impetus provided by the human immunodeficiency virus (HIV)-AIDS pandemic, the increase in the number of monoclonal antibodies specific for lymphocyte surface antigens, and advances in instrumenta-tion, data analysis, computer technology, and fluorochrome chemistry, flow cytometry has evolved into the most important tool in the evaluation of immunological status (4). The primary clinical applications of immunophenotyping include the enu-meration of CD4⫹-cell counts in the management of HIV
infection (25), the characterization of primary immunodefi-ciency disorders (18, 26), the evaluation of immune-mediated diseases (5), and the assessment of immune reconstitution following stem cell transplantation (38).
Lymphocyte subset analysis is a crucial element in the man-agement of patients with HIV. The importance of absolute CD4⫹- and CD8⫹-T-cell counts and the derived CD4/CD8
T-cell ratio in monitoring the progression of HIV infection (11, 36) and the additional value of CD4⫹counts in guiding the
initiation of prophylactic treatment of opportunistic infections (20) and in monitoring responses to antiviral therapy (46) are well established. The thresholds used in these guidelines are largely based on studies of Caucasians (6). Early immunophe-notyping studies were hampered by differences in preanalytical and analytical methodologies that caused interinstitutional variability. Guidelines now exist for CD4⫹- and CD8⫹-T-cell
enumeration to minimize these problems (1, 25). The intro-duction of single-platform flow cytometry using fluidics or mi-crobead technology has further reduced the variability caused
by differences in white cell count estimation by hematology counters (2).
Many studies have been conducted to establish a reference range for peripheral blood lymphocyte subsets in different countries. These studies revealed variations in the normal range for lymphocyte subsets according to age (9, 10, 35, 39, 45), sex (3, 22, 32, 33, 34, 40), race (7, 8, 19, 22, 30, 31, 42, 43), and environmental factors (41). The clinical implication is that the thresholds for therapy or AIDS definition may have to be established separately for different populations.
The fact that differences exist even between genetically and environmentally similar populations suggests that differences in analytical methodologies may be the source of these varia-tions. Furthermore, few studies compared different racial groups within the same population. Comparing racial groups from different environments is hampered by a number of confound-ing factors. As a result, whether a true genetic difference in the compositions of lymphocyte subsets exists is still unresolved. However, comparisons with other studies may still be useful in establishing gender differences and age-dependent variability if there are consistent findings across different studies.
With these considerations in mind, we set out to establish the local reference range for lymphocyte subsets, both percent-ages and absolute counts, by using established guidelines and a single-platform method. Furthermore, the multiracial compo-sition of our cohort would allow interracial comparisons in a single population. The composition of our cohort might also reduce the confounding effect of environmental differences, dietary patterns, and prevailing infections and provide a more accurate reflection of genetic differences.
MATERIALS AND METHODS
Subjects.A total of 232 healthy blood donors were recruited for the study.
Blood donors were screened with an initial health questionnaire that sought to identify volunteers at high risk for HIV-AIDS infection. Volunteers who had any
* Corresponding author. Mailing address: Department of Haema-tology-Oncology, National University Hospital, 5 Lower Kent Ridge Rd., Singapore 119074, Republic of Singapore. Phone: (65) 6772 4971. Fax: (65) 6777 5545. E-mail: [email protected].
168
on August 17, 2020 by guest
http://cvi.asm.org/
significant medical illness or who were taking medications were excluded. Vol-unteers were also required to have their HIV, hepatitis B and C, and syphilis statuses checked by either serological or molecular methods or a combination of both. Only blood donors eligible after this screening process were included in our study.
Blood collection.Whole blood was collected into EDTA Vacutainer tubes and
transported to the hematology laboratory immediately. The blood samples were stained and fixed on the same day.
Flow cytometry analysis.Lymphocyte subsets were analyzed on a FACScalibur
Flow Cytometer (Becton Dickinson). A single-platform, lyse–no-wash procedure was performed with Trucount tubes (Becton Dickinson) with the following two, four-color monoclonal antibody combinations supplied in the MultiTEST IMK kit (Becton Dickinson): CD3-fluorescein isothiocyanate–CD8-phycoerythrin– CD45-peridinin chlorophyll protein–CD4-allophycocyanin and CD3-fluorescein isothiocyanate–CD16 plus CD56-phycoerythrin–CD45-peridinin chlorophyll protein–CD19-allophycocyanin. The stained blood sample was lysed with a di-luted lysing solution, and special care was taken not to expose the stained sample
to light. CD3⫹T cells, CD3⫹CD4⫹T helper cells, and CD3⫹CD8⫹T cytotoxic
cells were identified according to published protocols. B cells were identified by
CD19 expression, and NK cells were identified by the CD3⫺CD16⫹and/or
CD56⫹phenotype.
Statistical analysis.Data were entered and analyzed by using Analyze-IT for
Microsoft Excel statistical software. The means and standard deviations (SD) were calculated for each marker. The frequency of distribution of each variable was analyzed. If Gaussian distribution was described by the mean and standard
deviation, then the reference range was defined by the mean⫾2 SD. If the result
of the Wilks-Shapiro test for normality was significant, the data were considered to have a non-Gaussian distribution, and the reference range was defined as the central 95% of the area under the distribution curve of values (from 2.5 to 97.5%). The distribution of T-cell subsets was compared between population
groups by Student’sttest (sex) or analysis of variance (ages and races).Pvalues
of⬍0.05 were considered significant.
RESULTS
A total of 232 healthy blood donors ranging in age from 16 to 65 years were included in the study. Of these, 104 (45%) were male and 128 (55%) were female. The racial mix of the study population was as follows: 184 (79.3%) were Chinese, 22 (9.5%) were Malay, 19 (8.3%) were Indian, and 9 (3.9%) belonged to other races, including Caucasian and Eurasian. The age distribution according to sex is presented in Table 1. The sex and racial mix of our cohort were representative of the general adult population in Singapore, and the reference ranges generated from this study should be applicable to the adult Singapore population.
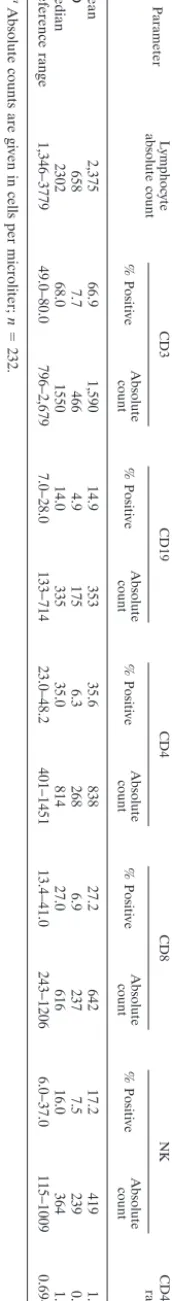
Table 2 shows the means, standard deviations, medians, and reference ranges for the various lymphocyte subsets generated by our study. On the whole, distribution was non-Gaussian for most parameters, and the reference ranges were defined as the central 95% of the area under the distribution curve. The exceptions were the percentages of CD4⫹ and CD8⫹ cells
which showed Gaussian distribution, and their reference ranges were constructed by using the mean⫾2 SD.
The data were further analyzed according to sex, race, and
TABLE 1. Age distribution according to gender
Age range
(yr) No. of malesubjects No. of femalesubjects Total no. ofsubjects
10–19 6 9 15
20–29 39 43 82
30–39 28 41 69
40–49 21 24 45
50–59 7 9 16
60–69 3 2 5
TABLE
2.
Lymphocyte
subset
percentages
and
absolute-number
reference
ranges
of
study
population
a
Parameter
Lymphocyte
absolute
count
Value
for
cell
type:
CD4/CD8
ratio
CD3
CD19
CD4
CD8
NK
%
Positive
Absolute
count
%
Positive
Absolute
count
%
Positive
Absolute
count
%
Positive
Absolute
count
%
Positive
Absolute
count
Mean
2,375
66.9
1,590
14.9
353
35.6
838
27.2
642
17.2
419
1.43
SD
658
7.7
466
4.9
175
6.3
268
6.9
237
7.5
239
0.56
Median
2302
68.0
1550
14.0
335
35.0
814
27.0
616
16.0
364
1.33
Reference
range
1,346
–3779
49.0
–80.0
796
–2,679
7.0
–28.0
133
–714
23.0
–48.2
401
–1451
13.4
–41.0
243
–1206
6.0
–37.0
115
–1009
0.69
–2.83
a
Absolute
counts
are
given
in
cells
per
microliter;
n
⫽
232.
on August 17, 2020 by guest
http://cvi.asm.org/
age. The means, standard deviations, medians, and reference ranges for males and females are tabulated in Table 3. Only NK cell percentages and absolute counts were significantly different (P ⬍ 0.0001). These differences are not clinically relevant as quantification of NK cell subsets does not play a significant role in clinical management.
Our study did not show any significant variation in lympho-cyte subsets according to age except for CD8⫹-cell counts,
which decreased with age (P⬍0.0001; data not shown). When the analysis was done according to racial group, there were significant differences among the racial groups in the following parameters: CD3⫹-T-cell counts, CD19⫹-B-cell counts, and
CD4⫹-T-helper-cell counts (Table 4). Indians seemed to have
higher CD3⫹, CD4⫹, and CD19⫹counts than the Chinese or
Malays, while lymphocyte subsets were comparable between the Malays and Chinese.
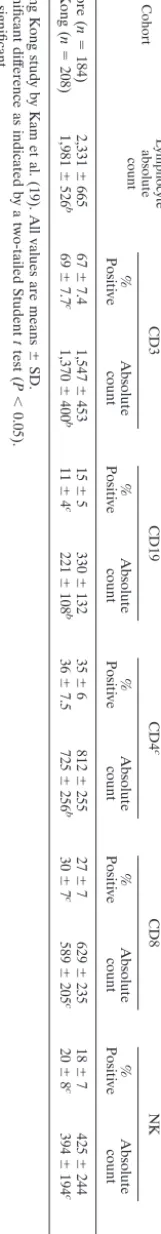
We then compared the results of the Chinese subset in our population with the results obtained from a study of Chinese in Hong Kong. Hong Kong and Singapore have very similar so-cioeconomic and environmental characteristics. Genetically, the Chinese from these two populations should be closely related. The two study populations also have similar age dis-tributions. Interestingly, despite having similar lymphocyte subset percentages, the absolute CD3⫹-, CD19⫹-, and CD4⫹
-cell counts of the Singapore cohort are significantly higher than those of the Hong Kong cohort (Table 5).
DISCUSSION
In this study, we have managed to obtain reference ranges for lymphocyte subsets in a multiracial cohort that should be representative of our adult population. These reference ranges are applicable to patients between the ages of 16 and 65 years, which is also the clinically relevant population. These reference ranges do not apply to the pediatric population. As some studies have shown the effect of age on lymphocyte subsets, a separate study is necessary to determine reference ranges for this group of patients.
The results obtained from our population are again different from the results of other populations studied. This difference suggests that each population should have its own reference ranges for lymphocyte subsets. As a result, populations where HIV and AIDS are a major problem should study their own HIV-AIDS cohorts to see if traditional thresholds for CD4 used for the determination of treatment and prophylaxis and for AIDS definition are applicable to their populations as these ranges were defined in terms of Caucasian populations. Immu-nological progression markers for HIV-AIDS may have to be reestablished for different populations, and this process will require long-term prospective cohort studies aimed at describ-ing the progression of HIV in each population.
The sources of variations between populations are less cer-tain. Comparisons are hampered by differences in the meth-odologies of lymphocyte subset analysis. Results from external quality assurance surveys in the early 1990s identified a range of methodological features that could affect the results of flow cytometric immunophenotyping: blood sample characteristics and integrity, sample preparation (red cell removal techniques, staining, washing, and fixation), staining reagents and fluoro-chromes, flow cytometer setup and performance, data
acqui-TABLE 3. Lymphocyte subset percentages and absolute-number reference ranges for males and females in the study population a Parameter
Lymphocyte absolute count
Value for cell type: CD4/CD8 ratio CD3 CD19 CD4 CD8 NK % Positive Absolute count % Positive Absolute count % Positive Absolute count % Positive Absolute count % Positive Absolute count Mean ⫾ SD b Male 2,437 ⫾ 645 66.0 ⫾ 7.5 1,609 ⫾ 454 13.6 ⫾ 3.9 349 ⫾ 213 35.0 ⫾ 6.0 837 ⫾ 262 27.3 ⫾ 6.5 660 ⫾ 231 18.8 ⫾ 7.1 472 ⫾ 247 1.4 ⫾ 0.5 Female 2,325 ⫾ 667 67.5 ⫾ 7.7 1,575 ⫾ 477 15.9 ⫾ 5.4 356 ⫾ 138 36.1 ⫾ 6.6 839 ⫾ 273 27.0 ⫾ 7.2 628 ⫾ 242 16.0 ⫾ 7.6 375 ⫾ 224 1.5 ⫾ 0.6 Median Male 2,358 67.0 1,565 13.0 325 35.0 814 27.5 636 18.0 413 1.30 Female 2,203 66.0 1,497 15.0 340 35.0 813 27.0 597 14.0 330 1.33 Reference range Male 1,147 –3,727 47.1 –79.4 701 –2,517 7.0 –22.0 109 –802 23.0 –47.0 313 –1,361 14.3 –40.3 228 –1,243 7.6 –37.4 140 –1,103 0.68 –2.73 Female 1,342 –3,859 49.2 –80.0 800 –2,751 7.2 –31.1 138 –645 21.5 –48.8 399 –1,489 12.6 –41.4 254 –1,193 5.2 –36.6 96 –998 0.70 –3.22 aAbsolute counts are given in cells per microliter. For males, n ⫽ 104; for females, n ⫽ 128. bMean ⫾ SD values were compared by analysis of variance; only NK cell percentages and absolute counts were signi ficantly dif ferent ( P ⬍ 0.05).
on August 17, 2020 by guest
http://cvi.asm.org/
sition and analysis, including gating strategies, and absolute cell count assessment (12, 13, 17, 29). A multicenter study in 1995 highlighted three major technical difficulties resulting in interlaboratory variability: variations in sample processing, suboptimal lymphocyte gating that uses light scattering (for-ward scatter and side scatter [SSC]) and a CD14-CD45 strat-egy, and variations in white cell count measurement (14). More recent surveys have reported marked improvement in inter-laboratory variability with the adoption of guidelines (44), im-provements in gating strategies (using CD45 and SSC, due to the availability of more fluorochromes), and the adoption of the lyse–no-wash instead of the Ficoll-Hypaque method for sample preparation (15). Other studies have also shown that the major source of interlaboratory variation in flow cytometric analysis of lymphocyte subsets is the variation in lymphocyte count produced by the automated blood analyzer when a dual-platform method is used (21, 27). This fact is further illustrated by the comparison between results for the Chinese in our population and those for the Hong Kong Chinese. Despite showing similar percentages of lymphocyte subsets, the popu-lations have different absolute values for CD3⫹, CD4⫹, and
CD19⫹cells. This source of variation can be eliminated by the
single-platform methodology (2) that is adopted in this study. Furthermore, most of the other studies trying to establish reference ranges for lymphocyte subsets adopted older gat-ing strategies and sample preparation methods, makgat-ing direct comparison difficult. As far as we know, ours is the first study that uses the single-platform method and the latest guidelines to establish reference ranges for lymphocyte subsets in an Asian population. Recently, a guideline on T-cell subset enu-meration by single-platform flow cytometry was published by the Centers for Disease Control and Prevention (23). We sug-gest that future studies utilize this method and adopt recom-mendations from the latest guidelines to improve interlabora-tory comparability.
Environmental factors like prevailing mycobacterium infec-tion, hepatitis, helminthic infestainfec-tion, and poor nutrition have been suggested as possible causes of the differences between populations in lymphocyte subsets. As a result, whether there are true racial and genetic differences is hard to ascertain. Our study is unique in that it looks at the interracial differences among a cohort that lives in one environment. Our study showed CD3⫹-T-cell, CD4⫹-T-helper-cell, and CD19⫹-B-cell
counts that were significantly higher in Indians than in Chinese and Malays. This trend is similar to that reported in a previous study, suggesting that it is probably true (8). Very little data
TABLE 4. Comparison of absolute lymphocyte subpopulation counts between different races in the study cohort
Cell type
Mean absolute count⫾SD by race (cells/l)
Chinese
(n⫽184) (nMalay⫽22) (nIndian⫽17) (nOther⫽9)
CD3 T cellsa 1,547⫾453 1,599⫾518 1,881⫾407 1,908⫾458
CD4 T cellsa 812⫾255 856⫾308 958⫾296 1,096⫾184
CD8 T cellsb 629⫾235 661⫾257 707⫾221 738⫾261
B cellsa 330⫾132 422⫾137 514⫾411 342⫾139
NK cellsb 425⫾244 363⫾212 358⫾189 527⫾260
aSignificant difference (P⬍0.05) as indicated by a two-tailed Studentttest.
bNot significant.
TABLE
5.
Comparison
between
the
Chinese
cohorts
of
the
Singapore
study
and
of
the
Hong
Kong
study
a
Cohort
Lymphocyte
absolute
count
Value
for
cell
type:
b
CD4/CD8
ratio
CD3
CD19
CD4
c
CD8
NK
%
Positive
Absolute
count
%
Positive
Absolute
count
%
Positive
Absolute
count
%
Positive
Absolute
count
%
Positive
Absolute
count
Singapore
(
n
⫽
184)
2,331
⫾
665
67
⫾
7.4
1,547
⫾
453
15
⫾
5
330
⫾
132
35
⫾
6
812
⫾
255
27
⫾
7
629
⫾
235
18
⫾
7
425
⫾
244
1.0
⫾
0.6
Hong
Kong
(
n
⫽
208)
1,981
⫾
526
b
69
⫾
7.7
c
1,370
⫾
400
b
11
⫾
4c
221
⫾
108
b
36
⫾
7.5
725
⫾
256
b
30
⫾
7c
589
⫾
205
c
20
⫾
8c
394
⫾
194
c
1.0
⫾
0.4
c
a
Hong
Kong
study
by
Kam
et
al.
(19).
All
values
are
means
⫾
SD.
b
Signi
ficant
dif
ference
as
indicated
by
a
two-tailed
Student
t
test
(
P
⬍
0.05).
c
Not
signi
ficant.
on August 17, 2020 by guest
http://cvi.asm.org/
exist for the Indian population. The number of Indians in our study is quite small, and a larger number of volunteers should be collected to confirm this finding.
Our study showed a significantly lower NK cell percentage and count in women than in men. This finding is consistent with findings of other studies (22, 32). However, we did not find any gender differences in CD4⫹-T-helper-cell counts as
has been reported in some other studies (3, 22, 32, 33, 40). Differences in immune cell numbers between genders may be secondary to the differential influences of sex hormones shown in murine studies (24). The mechanisms involved may include the modulation of thymic involution by sex hormones (16, 28) or the effect of binding to cell receptors for the sex steroid present on T cells (37).
Our study showed that the number of CD8⫹ T cells
in-creases with age and, as a result, the CD4/CD8 ratio dein-creases, similar to the findings of a previous Saudi study (35). The impact of age on lymphocyte subsets is not well established, with different studies reporting different results. Some studies showed that the number of CD4⫹cells increased while the
number of CD8⫹cells decreased with age (9, 39), while others
showed the numbers of both CD4⫹and CD8⫹cells increasing
with age (45). The inconsistency arises because most studies looked at patients of different age ranges. Most of our cohort is between 20 and 49 years of age, so it would be difficult to draw any definite conclusion about the effect of age on lym-phocyte subsets from our study. To answer this question, stud-ies would need to include patients of a wide range of ages and with each age well represented. One such study including pa-tients from birth onwards showed that the absolute lymphocyte count falls with age but that the percentage of CD4⫹ and
CD8⫹cells increases with age, thereby maintaining a relatively
constant level of absolute CD4⫹- and CD8⫹-cell counts (10).
Alternatively, a longitudinal study monitoring a cohort of healthy volunteers as they grow older would also provide more definitive results.
In conclusion, we have established reference ranges for the lymphocyte subsets in a multiracial Asian population by using four-color, single-platform flow cytometry and following the latest guidelines (lyse–no-wash sample preparation and CD45 and SSC lymphocyte gating). Our study suggests that there may be a true genetic difference in lymphocyte subsets and further confirms the gender difference in NK cell counts. The impact of age on the lymphocyte subset is less certain.
ACKNOWLEDGMENTS
We acknowledge H. L. Tan for help with the statistical analysis of some of the data and all the staff in the hematology laboratory of Tan Tock Seng Hospital who performed the flow cytometry analysis for the lymphocyte subsets.
REFERENCES
1. Barnett, D., G. Bird, A. C. Newland, D. C. Linch, E. M. Matutes, E. Hodges,
J. T. Reilly.1997. Guidelines for the determination of CD4⫹T lymphocytes
in immunosuppressed individuals. Clin. Lab. Haematol.19:231–241.
2. Barnett, D., V. Granger, L. Whitby, I. Storie, and J. T. Reilley.1999.
Abso-lute CD4⫹T-lymphocyte and CD34⫹stem cell counts by single platform
flow cytometry: the way forward. Br. J. Haematol.106:1059–1062.
3. Bartlett, J. A., S. J. Schleifer, M. K. Demetrikopoulos, B. R. Delaney, S. C.
Shiflett, and S. E. Keller.1998. Immune function in healthy adolescents.
Clin. Diagn. Lab. Immunol.5:105–113.
4. Blessing, J. H. H., and T. A. Fleisher.2001. Immunophenotyping. Semin.
Hematol.38:100–110.
5. Blessing, J. H. H., S. E. Strauss, and T. A. Fleisher.2000. Autoimmune
lymphoproliferative syndrome: a human disorder of abnormal lymphocyte
apoptosis. Pediatr. Clin. N. Am.47:1291–1310.
6. Centers for Disease Control and Prevention.1992. 1993 revised classification
system for HIV infection and expanded surveillance case definition for AIDS
among adolescents and adults. Morb. Mortal. Wkly. Rep.41:1–35.
7. Chin, S. F., S. K. Cheong, Y. C. Lim, and S. H. Ton.1993. The distribution
of immunoregulatory cells in the peripheral blood of normal Malaysian
adults. J. Pathol.15:49–52.
8. Choong, M. L., S. H. Ton, S. K. Cheong.1995. Influence of race, age and sex
on the lymphocyte subsets in peripheral blood of healthy Malaysian adults.
Ann. Clin. Biochem.32:532–539.
9. Denny, T., R. Yogev, R. Gelman, C. Skuza, J. Oleske, E. Chadwick, S. Cheng,
and E. Connor.1992. Lymphocyte subsets in healthy children during the first
5 years of life. JAMA267:1481–1488.
10. Erkeller-Yuksel, F. M., V. Deneys, B. Yuksel, I. Hannet, F. Hulstaert, C.
Hamilton, H. Mackinnon, L. T. Stokes, V. Munhyeshuli, F. Vanlangendonck,
et al.1992. Age-related changes in human blood lymphocyte subpopulation.
J. Pediatr.120:216–222.
11. Fahey, J. L., J. M. Taylor, R. Detels, B. Hoffman, R. Melmed, P. Nishinian,
and J. V. Giorgi.1990. The prognostic value of cellular and serologic markers
in infection with human immunodeficiency virus type 1. N. Engl. J. Med.
322:166–172.
12. Gelman, R., S. C. Cheng, P. Kidd, M. Waxdal, and J. Kagan.1993.
Assess-ment of the effects of instruAssess-mentation, monoclonal antibody, and fluoro-chrome on flow cytometric immunophenotyping: a report based on 2 years of the NIAID DAIDS flow cytometry quality assessment program. Clin.
Im-munol. Immunopathol.66:150–162.
13. Giorgi, J. V., H. I. Cheng, J. H. Margolick, K. D. Bauer, J. Ferbas, M.
Waxdal, I. Schmid, L. E. Hultin, A. L. Jackson, I. Park, J. M. G. Taylor, and
the Multicenter AIDS Cohort Study Group.1990. Quality control in the flow
cytometric measurement of T-lymphocyte subsets: the Multicenter AIDS
Cohort Study experience. Clin. Immunol. Immunopathol.55:173–186.
14. Gratama, J. W., J. Kraan, R. Van den Beemd, B. Hooibrink, D. R. Van
Bockstaele, and H. Hooijkaas.1997. Analysis of variation in results of flow
cytometric lymphocyte immunophenotyping in a multicenter study.
Cytom-etry30:166–177.
15. Gratama, J. W., J. Kraan, M. Keeney, V. Granger, and D. Barnett.2002.
Reduction of variation in T-cell subset enumeration among 55 laboratories using single platform, three or four-color flow cytometry based on CD45 and
ssc-based gating of lymphocytes. Cytometry50:92–101.
16. Grossman, C.1989. Possible underlying mechanisms of sexual dimorphism
in the immune response, fact and hypothesis. J. Steroid Biochem.34:241–
251.
17. Homburger, H. A., W. Rosenstock, H. Paxton, M. L. Paton, and A. L.
Landay.1993. Assessment of interlaboratory variability of
immunopheno-typing: results of the College of American Pathologists flow cytometry
sur-vey. Ann. N. Y. Acad. Sci.677:43–49.
18. Jain, A., T. P. Atkinson, P. E. Lipsky, J. E. Slater, D. L. Nelson, and W.
Strober.1999. Defects of T-cell effector function and post-thymic maturation
in X-linked hyper-IgM syndrome. J. Clin. Investig.103:1151–1158.
19. Kam, K. M., W. L. Leung, M. Y. Kwok, M. Y. Hung, S. S. Lee, and W. P.
Mak.1996. Lymphocyte subpopulation reference ranges for monitoring
hu-man immunodeficiency virus-infected Chinese adults. Clin. Diagn. Lab.
Im-munol.3:326–330.
20. Kovacs, J. A., and H. Masur.2000. Prophylaxis against opportunistic
infec-tions in patients with human immunodeficiency virus infection. N. Engl.
J. Med.342:1416–1429.
21. Lau, L. G., G. B. Tan, and P. Kuperan.2002. CD4 lymphocyte enumeration
in patients with human immunodeficiency virus infection using three-colour and four-colour dual-platform flow cytometry: an interlaboratory
compara-tive evaluation. Ann. Acad. Med. Sing.31:765–771.
22. Lee, B. W., H. K. Yap, F. T. Chew, T. C. Quah, K. Prabhakaran, G. S. Chan,
S. C. Wong, and C. C. Seah.1996. Age- and sex-related changes in
lympho-cyte subpopulations of healthy Asian subjects: from birth to adulthood.
Cytometry26:8–15.
23. Mandy, F. F., J. K. Nicholson, and J. S. McDougal.2003. Guidelines for
performing single-platform absolute CD4⫹T-cell determination with CD45
gating for persons infected with human immunodeficiency virus. Morb.
Mor-tal. Wkly. Rep.52:1–13.
24. McMurray, R. W., R. W. Hoffman, W. Nelson, and S. E. Walker.1997.
Cytokine mRNA expression in the B/W mouse model of systemic lupus erythematosus–analysis of strain, gender, and age effects. Clin. Immunol.
Immunopathol.84:260–268.
25. Nicholson, J. A., and T. L. Hearn.1997. 1997 Revised guidelines for the
performance of CD4⫹T cell determinations in persons with human
immu-nodeficiency virus infection. Morb. Mortal. Wkly. Rep.46:1–29.
26. Nicholson, J. K. A.1989. Use of flow cytometry in the evaluation and
diagnosis of primary and secondary immunodeficiency diseases. Arch.
Pathol. Lab. Med.113:598–605.
27. O’Gorman, M. R. G., R. Gelman, Site Investigators, and the NIAID New
CD4 Technologies Focus Group.1997. Inter- and intrainstitutional
on August 17, 2020 by guest
http://cvi.asm.org/
tion of automated volumetric capillary cytometry for the quantification of CD4- and CD8-positive T lymphocytes in the peripheral blood of persons infected with human immunodeficiency virus. Clin. Diagn. Lab. Immunol.
4:173–179.
28. Olsen, N. J., S. M. Viselli, J. Fan, and W. J. Kovacs.1998. Androgens
accelerate thymocyte apoptosis. Endocrinology139:748–752.
29. Parker, J. W., B. Adelsberg, S. P. Azen, D. Boone, M. A. Fletcher, G. F.
Gjerset, J. Hassett, J. Kaplan, J. C. Niland, T. Odom-Maryon, E. A.
Oper-skalski, H. Prince, D. Scott, D. P. Stites, J. W. Mosley, et al.1990. Leukocyte
immunophenotyping by flow cytometry in a multisite study: standardization, quality control, and normal values in the Transfusion Safety Study. Clin.
Immunol. Immunopathol.55:187–220.
30. Prince, H. E., K. Hirju, L. S. Waldbeser, S. Plaeger-Marchal, S. Kleinman,
and L. L. Lainer.1985. Influence of racial background on the distribution of
T cell subsets and Leu 11-positive lymphocytes in healthy donors. Diagn.
Immunol.3:33–37.
31. Qouzi, A. A., A. A. Salamah, R. A. Rasheed, A. A. Musalam, K. A. Khairy, O.
Kheir, S. A. Ajaji, and A. H. Hajeer.2002. Immunophenotyping of peripheral
blood lymphocytes in Saudi men. Clin. Diagn. Lab. Immunol.9:279–281.
32. Reichert, T., M. DeBruyere, V. Deney, T. Totterman, P. Lydyard, F. Yuksel,
H. Chapel, D. Jewell, L. Van Hove, J. Linden, and L. Buchner.1991.
Lym-phocyte subset reference ranges in adult Caucasians. Clin. Immunol.
Immu-nopathol.60:190–208.
33. Rudy, B. J., C. M. Wilson, S. Durako, A. Moscicki, L. Muenz, and S. D.
Douglas.2002. Peripheral blood lymphocyte subsets in adolescents: a
longi-tudinal analysis from the REACH project. Clin. Diagn. Lab. Immunol.
9:959–965.
34. Santagostino, A., G. Gargaccio, A. Pistorio, V. Bolis, G. Camisasca, P.
Pagliaro, and M. Girotto.1999. An Italian national multicenter study for the
definition of a reference ranges for normal values of peripheral blood
lym-phocyte subsets in healthy adults. Haematologica84:499–504.
35. Shahabuddin, S.1995. Quantitative differences in CD8⫹lymphocytes, CD4/
CD8 ratio, NK cells, and HLA-DR⫹-activated T cells of racially different
male populations. Clin. Immunol. Immunopathol.75:168–170.
36. Stein, D. S., J. A. Korvick, and S. H. Vermund.1992. CD4⫹lymphocyte
enumeration for prediction of clinical course of human immunodeficiency
virus disease: a review. J. Infect. Dis.165:352–363.
37. Stimson, W. H.1998. Estrogen and human T lymphocytes: presence of
specific receptors in the T-suppressor/cytotoxic subset. Scand. J. Immunol.
28:345–350.
38. Storek, J., and R. P. Witherspoon.2000. Immunologic reconstitution after
haematopoietic stem cell transplantation, p. 111–146.InK. Atkinson (ed.),
Clinical bone marrow and blood stem cell transplantation, 2nd ed. Cam-bridge University Press, CamCam-bridge, United Kingdom.
39. Tollerud, D. J., S. T. Ildstad, L. M. Brown, J. W. Clark, W. A. Blattner, D. L.
Mann, C. Y. Neuland, L. Pankiw-Trost, and R. N. Hoover.1990. T-cell
subsets in healthy teenagers: transition to the adult phenotype. Clin.
Immu-nol. Immunopathol.56:88–96.
40. Tollerud, D. J., J. W. Clark, L. M. Brown, C. Y. Neuland, L. K. Pankiw-Trost,
W. A. Blattner, and R. N. Hoover.1989. The influence of age, race, and
gender on peripheral blood mononuclear-cell subsets in healthy
non-smok-ers. J. Clin. Immunol.9:214–222.
41. Tollerud, D. J., J. W. Clark, L. M. Brown, C. Y. Neuland, D. L. Mann, L. K.
Pankiw-Trost, W. A. Blattner, and R. N. Hoover.1989. The effects of
ciga-rette smoking on T-cell subsets: a population-based survey of healthy
Cau-casians. Am. Rev. Respir. Dis.139:1446–1451.
42. Tsegaye, A., T. Messele, T. Tilahun, E. Hailu, T. Sahlu, R. Doorly, A. L.
Fontanet, and T. F. Rinke de Wit.1999. Immunohematological reference
ranges for adult Ethiopians. Clin. Diagn. Lab. Immunol.6:410–414.
43. Webster, H. K., K. Pattanapanyasat, P. Phanupak, C. Wasi, C. Chuenchitra,
L. Ybarra, and L. Buchner.1996. Lymphocyte immunophenotype reference
ranges in healthy Thai adults: implications for management of HIV/AIDS in
Thailand. Southeast Asian J. Trop. Med. Public Health27:418–429.
44. Whitby, L., V. Granger, I. Storie, K. Goodfellow, A. Sawle, J. T. Reilly, and
D. Barnett.Quality control of CD4⫹T-lymphocyte enumeration: results
from the last 9 years of the United Kingdom National External Quality
Assessment Scheme for immune monitoring (1993–2001). Cytometry50:
102–110.
45. Wiener, D., S. Shah, J. Malone, N. Lowell, S. Lowitt, and D. T. Rowlands, Jr.
1990. Multiparametric analysis of peripheral blood in the normal paediatric
population by flow cytometry. J. Clin. Lab. Anal.4:175–179.
46. Yeni, P. G., S. M. Hammer, C. C. J. Carpenter, D. A. Cooper, M. A. Fischl,
J. M. Gatell, B. G. Gazzard. M. S. Hirsch, D. M. Jacobsen, D. A. Katzen-stein, J. S. G. Montaner, D. D. Richman, M. S. Saag, M. Schechter, R. T.
Schooley, M. A. Thompson, S. Vella, and P. A. Volberding.2002. Antiviral
treatment for adult HIV infection in 2002. JAMA288:222–235.