ISSN 2286-4822 www.euacademic.org
Impact Factor: 3.1 (UIF) DRJI Value: 5.9 (B+)
A Novel Method for Image Steganography Based on
Texture Features
TAWFIQ A. AL-ASADI
College of Information Technology Babylon University Iraq
ALI ABDUL AZZEZ MOHAMMAD BAKER
Department of Computer Science Babylon University Iraq
Abstract:
In this paper, we have introduced a new method for image steganography based on the nature of cover (image) texture, the system consist of two stages, in the first stage we segment the image into isolated regions and then cluster the segments of cover image to determine the segments with highest frequencies, and then use this segments as a region to hide the message. We proposed a new method to hide each byte of message in each row of that region individually. In the second stage (message extraction), we apply segmentation on the stego image and clustering the segments to determine the highest frequencies and apply the invers of hiding algorithm to extract the message.
Key words: similar regions, segmentation, hide information, extract message.
1-Introduction
there exist two types of materials in steganography which are message and carrier, Message is the secret data that should be hidden and carrier is the material that takes the message in it. There are many applications for steganography which are military, diplomatic and personal applications. There are three principles to determine the effectiveness of steganography technique which are
1- The size of message.
2- The difficulty of detect message. 3- The difficulty of alter the message.
Steganography can be classified into three types:
1- Pure steganography which hide information (message) directly in cover in deterministic sequence without use key so this sequence must be known for both sender and receiver.
2- Symmetric key steganography which hide message in cover by using secret key and the key must be known for both sender and receiver.
3- Public key steganography which hide message in cover by using two keys (secret and public) first one used in hiding and the second used in extract message.
2-Proposed system
Message hiding stage
Message extracting stage
Segmentation Image clustering
Define the segments with high frequency Extract Message by
using inverse new proposed method Cover (image)
Mess age (imag
e)
Segmentation
Segments clustering Determine
segments with highest frequency
Apply new proposed method to hide
message that segments
Stego image
Figure (1) block diagram of proposed system
2.1-Message hiding stage
This stage is divided into the following steps:- 1- image segmentation into isolated regions.
2- clustering of segments and define the segments with highest frequencies(to hide in).
3-Hide information by using new algorithm.
2.1.1-Image segmentation
In this step the image will be divided into isolated regions using edge detect segmentation, we firstly divided 24-bits RGB image into three bands (red, green, blue) then we used red component image in steps before hiding step. Initially this image translated to binary using global threshold by the following states
1-Select initial threshold (T) as the mean of the image.
2-Segment the image into black and white pixels using initial threshold (T)
3-Compute the mean of black and white segments (m1, m2). 4-Compute the new threshold (T)
T=0.5*(m1+m2) (1)
5-Repeat states 2-4 until initial (T) =new (T) or the difference between them is smaller than specific value (To).
After that edges detected by simple gradient method on binary image with vertical and horizontal masks as illustrated in figure (2). (SumitTandon, 2005)
1 -1 1
-1
Vertical mask horizontal mask Figure (2) masks for edge detect
is edge (boundary) pixel.
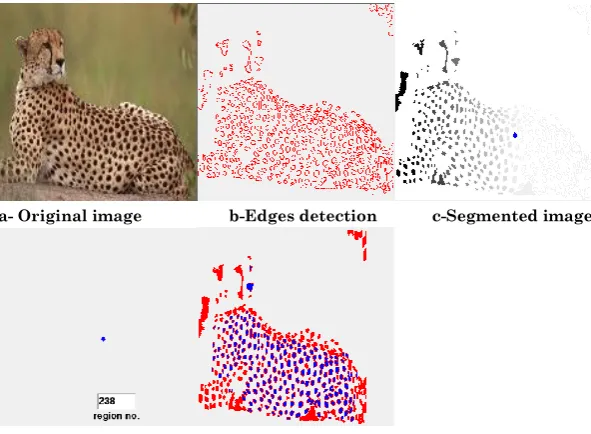
If binary image (i, j) - binary image (i-1, j) =255 then pixel (i, j) is edge pixel Figure (3b) show edges detect for tiger image, When edge detected we divided image into isolated regions ,as shown in figure(3c,3d), by collecting the pixels inside each closed boundary to construct each region with label for this region.
a- Original image b-Edges detection c-Segmented image
d- Region drawing e- (blue) high frequent regions Figure (3) determine high frequent regions
2.1.2- Clustering of segments
After segmentation step we calculate the mean for each region by divided the summation of red level for each segment by the number of pixels in this segment, then we
1- divided the regions into specific number of classes (we choose five classes) and initially we select random center for each class (c1, c2, c3, c4, c5)
3- Correct the center of classes by dividing the summation of mean for each region in specific class by number of regions in this class.
4- Repeat step2 and 3 until no change in classes center, then we select the cluster with highest number of segments to hide in.
2.1.3-Hide message in the regions of highest frequency After we detect similar regions to hide in. We used a new technique to hide message in tiger image into similar regions in green and blue bands of image by applying the following algorithm for each region
Hiding algorithm
Input: segments with highest frequencies, message (image). Output: stego image
Begin
For i=1 to number of rows in region do
If all row (i) pixels <> value of boundary then Call function to calculate mean of row (i) pixels.
Covert all row (i) pixels to be equal the mean except the boundary pixels.
Convert the mean value into binary representation. Save the mean value in the first pixel of row (i).
Calculate the KMSB (the number of most significant Bits which equal zero)
Hide each bit from message in each Byte of row (i) (in the Reset of 8- KMSB bits)
End if End for End algorithm.
When we apply this algorithm the following states must be checked
row must be neglected.
2- We leave first and last values of each row because they are edge.
3- For each row verify the two conditions above A- Calculate the mean of row pixels.
B- Never hide in the first pixel of row.
C- Convert the mean to binary number and perform the following
i-Calculate number of most significant bits equal to zero.
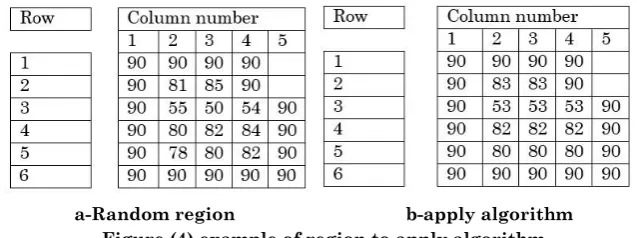
ii- Reduced these bits and hide in remaining bits of each pixels. For region in figure (4)
1-We ignore the first row because all pixels in this row are edge
a-Random region b-apply algorithm Figure (4) example of region to apply algorithm
2-For second row mean of pixels (not boundary) equal to ((81+85)/2) =83 which represented in binary
0 1 0 1 0 0 1 1
Then we found that the number of MSBs equal to zero is (1) then the number of bits will be used in hiding information equal to (7) and we hide only in pixel in column number (3), we let pixel in column (2) as guide to retrieve information in second stage.
0 0 1 1 0 1 0 1
2.2-Extract message stage
In second stage we applying the same techniques used in section 2.1.1and2.1.2 for image segmentation, clustering of segments, and determine the high frequent regions for extract information from it, this mean that The second stage for extract information from highest frequent regions in image consist of the following steps:-
1- Image segmentation. 2- Clustering of segments.
3- High frequent regions detection (to extract message). 4- Extract message from this regions.
In same way when we need to extract message from stego image we read the first pixel in each row in useless regions then from this value we know the number of pixels used in hiding information by converting this value to binary and calculating the number of MSBs equal to zero, from this value we determined number of bits used in information hiding.
3-Experiment Results
a.original image b. message c.stego image Figure (5) result (1) of proposed system
In figure (6) Dimensions of original and stego images are (396*336) and dimensions of message image are (84*80) Peak signal to noise ratio for this state is (38.14).
a.original image b. message c.stego image
Figure (6) result (2) of proposed system
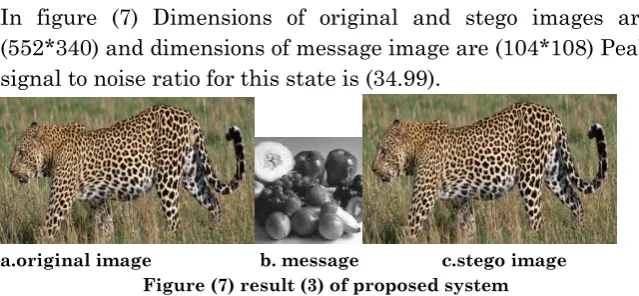
In figure (7) Dimensions of original and stego images are (552*340) and dimensions of message image are (104*108) Peak signal to noise ratio for this state is (34.99).
4-Conclusion
1-the similarity regions detected from red band and information will be hide in green and blue bands to avoid change of similarity regions when we hide in red band, so the red band will be used as a guide to detect similar regions.
2-Hides of information don't alter the visible features of image so the image effect on image will be non-visible.
3-Segmentation of image is the key for sound results, any way lead to under segmentation cause to merge many regions in one region which effect in reducing total number of pixel available for hiding information while the results of over segmentation make the positions of pixels used in hide information more randomize but may alter the similarity between regions so good result depend on good segmentation.
BIBLIOGRAPHY:
Cole, Eric and Ronald D. Krutz. 2003. Hiding in plain sight: Steganography and the art of covert communication. Indianapolis, IN: Wiley.
De Sa, J. P. Marques. 2001. Pattern Recognition: Concepts,
Methods and Applications. Springer.
Garg, Sanjay and Ramesh Chandra Jain. 2006. "Variations of k-mean algorithm: A study for high-dimensional large data sets." Information Technology Journal 5(6): 1132-1135.
Kumar, Arvind and Km. Pooja. 2010. "Steganography-A data hiding technique.” IGCA. 9(7): 19-23.
Tandon, Sumit. 2005. “Edge detection." Course # EE6358 Computer Vision. University of Texas at Arlington. Umamaheswari, M., S. Sivasubramanian and S. Pandiarajan.