Konkoly Observatory Budapest
14 May 2013
HU ISSN 0374 – 0676
GSC 02996-00858: A NEW ALGOL-TYPE ECLIPSING BINARY IN LEO
AYIOMAMITIS, ANTHONY1,2
1Perseus Observatory, Athens, Greece; e-mail: [email protected] 2Helliniki Astronomiki Enosi, Greece
The previously unknown variable GSC 02996-00858 (α2000: 09h53m35s,δ2000: +40◦33′20′′,
V = 14.48) was followed over six nights and confirmed to be an eclipsing binary with a
deep primary minimum and a shallow secondary minimum. Perhaps of greater interest is the unexpected flare-like event associated with GSC 02996-00858 which was identified during one of the follow-up sessions. Single filter light elements with light curve and period analysis are presented.
A supplementary analysis of the sparse field of view centered on the exoplanet host star
KELT-3 (SAO 43097, α2000: 09h54m34s.39, δ2000: +40◦23′17′′.0) and measuring 46′ ×31′
revealed the presence of two potential new variable stars. Further analysis of one of these candidates suggested the presence of an eclipsing binary with a deep minimum (approximately 0.50 mag) owing to the single minimum captured during the initial session. Five further nights immediately thereafter were dedicated for follow-up observations and additional data so as to constrain the parameters of interest further.
An Astro-Physics AP 305/f3.8 Riccardi-Honders astrograph with AP 1200/CP3 Ger-man equatorial mount and SBIG ST-10XME CCD camera (KAF 3200ME NABG sensor,
2184×1472 pixel array, 6.8 µm per pixel) with clear filter (UV/IR blocked) were used
in both the initial discovery and follow-up monitoring. Image capture was accomplished
using CCDSoft V5.00.201 (Software Bisque, 2012) using 1×1 binning mode, thus yielding
an image scale of 1′′.21 per pixel. The CCD camera was cooled to approximately 30
de-grees below ambient temperature (operating temperature at−15.0◦C). Image acquisition
exploited the availability of the TC-237H guide chip (657×495 pixel array, 7.4 µm per
pixel) in the ST-10XME CCD camera for autoguiding purposes and where four-second guide exposures were consistently employed during the 39.2 hours of observation.
All data were analysed using AIP4Win V2.4.0 (Berry and Burnell 2011). The differ-ential photometry analysis involved full calibration comprised of a master bias (30 indi-vidual frames, min-max average combine with n=2) and a master sky flat (15 indiindi-vidual flat frames, min-max median combine with n=2) obtained during each session whereas the master dark (15 individual dark frames, min-max average combine with n=2) was produced at the end of the first session and reused for the follow-up sessions immediately thereafter.
The dim magnitude for the new eclipsing binary, mag 14.48 (v), allowed for the use of a brighter comparison and check star, thus allowing for greater confidence in the differential
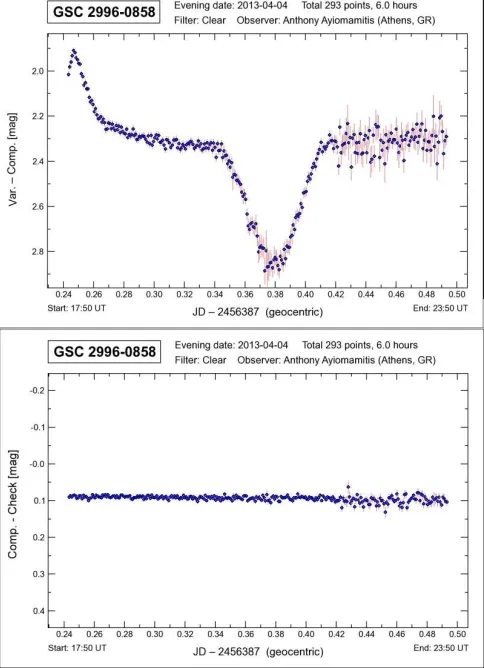
(3) Discovery light curve (unexpected flare-like event)
12.30) served as the comparison star whereas GSC 2996-0651 (α2000: 09h53m24s, δ2000:
+40◦27′31′′, mag 12.45) was used as the check star. The standard errors associated with
each measurement (var-comp and comp-check) during the six sessions and as reported by AIP4Win varied from 0.010 to 0.025 mag but were slightly higher during moments of heavy humidity.
[image:2.595.113.484.104.221.2]Table 1 presents a breakdown of the 1904 data points using 60-sec exposures col-lected during six sessions and representing a total observation time of 39.2 hours (JD 2456361.2864 to 2456388.5348). Heliocentric corrections were computed using the on-line facility by Bruton. The data are available electronically via the IBVS database (see 6057-t4.txt).
[image:2.595.173.424.488.662.2]Figure 1 provides the field of view as per one of the 60-sec exposures including KELT-3, GSC 2996-0858 as well as the comparison and check stars.
Figure 1. Finder chart for GSC 2996-0858 including KELT-3, GSC 2996-0858 and comp/check stars
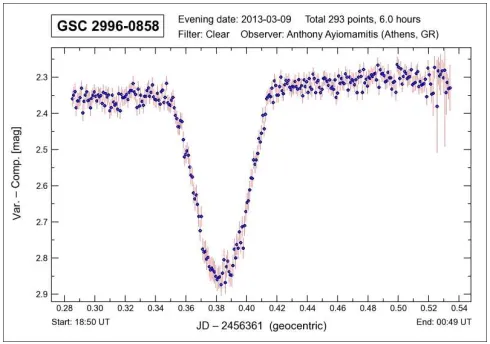
Figure 2. Discovery light curve involving the primary eclipse of GSC 2996-0858
Figure 3. Discovery light curve involving the secondary eclipse of GSC 2996-0858
Determination of extrema and period analysis was accomplished using the Kwee-van Woerden (1956) method (with linear interpolation) and two iterations of a Phase-Binned ANOVA as implemented in the Peranso V2.50 software package (Vanmunster).
Figure 5 provides the prominent periods identified by the initial Phase-Binned ANOVA.
The dominating spike at 0.6906 days (1.44800 c/d) with θ = 1894.49 proved to be
erro-neous on the basis of the ensuing phase plot. In contrast, a visually perfect phase plot was produced when using the next most prominent period, namely 0.4727 days (2.11533 c/d,
θ = 401.31) and which served the basis for a second Phase-Binned ANOVA with a greater
resolution step-size (1000 units) so as to further finetune the period to 0.4726 days (2.11578
c/d,θ= 443.41). The third most prominent period from the initial Phase-Binned ANOVA
at 0.4769 days (2.09667 c/d, θ= 276.66) also proved to be unsatisfactory.
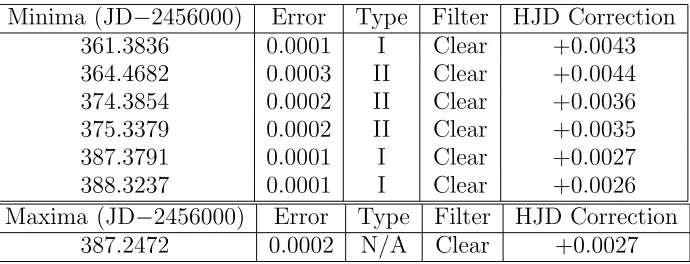
Table 2: Computed minima and maxima for GSC 2996-0858
Minima (JD−2456000) Error Type Filter HJD Correction
361.3836 0.0001 I Clear +0.0043
364.4682 0.0003 II Clear +0.0044
374.3854 0.0002 II Clear +0.0036
375.3379 0.0002 II Clear +0.0035
387.3791 0.0001 I Clear +0.0027
388.3237 0.0001 I Clear +0.0026
Maxima (JD−2456000) Error Type Filter HJD Correction
[image:5.595.162.437.283.395.2]387.2472 0.0002 N/A Clear +0.0027
Table 3: O−C results for the observed minima of GSC 2996-0858
Minima (HJD−2456000) Type Epoch O−C
361.3879 I 0 0.0000
387.3818 I 55 0.0009
388.3263 I 57 0.0002
364.4726 II −23 0.0010
374.3890 II −2 −0.0072
375.3414 II 0 0.0000
Table 2 provides the six computed extrema observed and comprised of three primary and three secondary minima. The Kwee-van Woerden method with linear interpolation was preferred over spline interpolation and no interpolation at all since a lower standard error was reported for the estimate of each computed extremum.
Figure 6 provides a phase plot for GSC 2996-0858 using the aforementioned period
of 0.4726 days (2.11578 cycles/day) whereas Table 3 provides the O−C results using the
initial light elements above.
Initial light elements using the primary and secondary epochs with the lowest standard error (Table 2):
HJD = 2456361.3879±0.0001 + (0.4726±0.0001)× E (Primary)
HJD = 2456375.3414±0.0002 + (0.4726±0.0001)× E (Secondary)
The phase plot suggests this eclipsing binary to be an Algol-type system with a rela-tively bright primary and dim(mer) secondary which are detached while orbiting around a common center of mass. Careful inspection of Figure 6 suggests that star spotting is most probably present, for the secondary maximum is lower than primary maximum and the light curve seems to be distorted post secondary minimum. The flare-like event observed during one of the sessions and the spotting which is implied in Figure 6 suggests that GSC 2996-0858 may be an RS CVn-type Algol.
Figure 5. Prominent periods for GSC 2996-0858 using a Phase-Binned ANOVA
[image:6.595.177.420.500.676.2]The primary eclipse is characterized with a depth of about 0.52 magnitudes and a du-ration of approximately 95 minutes. In contrast, the secondary eclipse is much shallower with a depth of about 0.10 magnitudes and a duration of approximately 105 minutes. Similarly, the single maximum observed during one of the sessions (Figure 4) and sus-pected to be a flare-type event is characterized with an amplitude of approximately 0.40 magnitudes and with an implied duration of about 90 minutes.
A Fisher randomization test with 200 iterations revealed a very low False Alarm
Prob-ability Level, namely < 0.001, thus reinforcing the integrity of the computed period of
0.4726 days. A Schwarzenberg-Czerny (1991) analysis yields an error for the dominant
period of ±0.0001 (± 1 sigma).
Although the 39.2 hours of data captured for this analysis was sufficient to finally acquire a complete phase curve and in spite of the single minimum observed during each session, an effort involving multiple observers across more than one time zone would be welcome so as to obtain a complete phase cure within a single night. The chance flare-type event observed (Figure 4) and which was totally unexpected will be the focus of further study immediately so as to further document its behaviour in relation to magnitude and frequency.
Follow-up analysis involving spectroscopy and photometry is also encouraged so as to further assess various characteristics of this newly discovered eclipsing binary system.
Acknowledgements:
The author acknowledges the use of the Guide Star Catalog II (GSC 2.3.3) from the Catalogs and Surveys Group (CASG), Space Telescope Science Institute (STScI) for the J2000 coordinates and magnitudes reported above for the variable, comparison and check stars. The author is also grateful to the anonymous reviewer for constructive criticism and feedback.
References:
Software Bisque, CCDSoft software package, http://www.bisque.com/sc/
Berry, R. and Burnell, J., 2011, The Handbook of Astronomical Image Processing With AIP for Windows Software, Willmann-Bell, http://www.willbell.com/aip4win/aip.htm Bruton, D., HJD computing facility, http://www.physics.sfasu.edu/astro/javascript/hjd.html Kwee, K.K., & van Woerden, H., 1956, B.A.N. 12, (464), 327-330
Schwarzenberg-Czerny, A., 1991, MNRAS, 253, 198-206