Eff e c t of i m p e r m e a b l e b a r r i e r
o ri e n t a ti o n o n b o t t o m w a t e r
c r e s ti n g
Ak a n g b o u , H N , B u r by, M L, N a sr, GG a n d B a b ai e , M
T i t l e Eff e c t of i m p e r m e a b l e b a r r i e r o ri e n t a ti o n o n b o t t o m w a t e r c r e s ti n g
A u t h o r s Ak a n g b o u , H N , B u r by, M L, N a sr, GG a n d B a b ai e , M
Typ e Ar ticl e
U RL T hi s v e r si o n is a v ail a bl e a t :
h t t p :// u sir. s alfo r d . a c . u k /i d/ e p ri n t/ 4 2 9 1 8 / P u b l i s h e d D a t e 2 0 1 7
U S IR is a d i gi t al c oll e c ti o n of t h e r e s e a r c h o u t p u t of t h e U n iv e r si ty of S alfo r d . W h e r e c o p y ri g h t p e r m i t s , f ull t e x t m a t e r i al h el d i n t h e r e p o si t o r y is m a d e f r e ely a v ail a bl e o nli n e a n d c a n b e r e a d , d o w nl o a d e d a n d c o pi e d fo r n o
n-c o m m e r n-ci al p r iv a t e s t u d y o r r e s e a r n-c h p u r p o s e s . Pl e a s e n-c h e n-c k t h e m a n u s n-c ri p t fo r a n y f u r t h e r c o p y ri g h t r e s t r i c ti o n s .
Effect of impermeable barrier orientation on bottom water cresting
Hector Ngozi Akangbou1*, Martin Burby2, Ghasem Nasr3, Meisam Babaie4
1234Petroleum Technology and Spray Research Groups, School of Computing Science and Engineering,
University of Salford, Manchester, United Kingdom, M5 4WT.
Abstract
The use of either a permeable or semi-permeable barriers has been proven to be effective in minimizing cresting effects in oil reservoirs characterized by strong bottom aquifer, with the latter known to be more effective. Most research has been focused on coning control in vertical wells with little research existing for cresting control in horizontal wells, especially
in use of barriers.
Therefore, this paper sets out to numerically investigate the effect of an impermeable barrier orientation in an oil reservoir characterized by a strong bottom aquifer. The orientations considered in this study were horizontal and inclined (step-like) in terms of placement in the oil reservoir, modeled with similar thickness and width.
From the results, it was observed that a horizontally-placed impermeable barrier is more effective than inclined impermeable barriers in bottom water cresting scenarios. A
horizontal impermeable barrier closer to the perforation of the horizontal well, 0.08x in
thickness to the reservoir height and 0.45x to reservoir width was the most effective,
although the effect of impermeable barrier width was found to be inconsistent with the performance of impermeable barriers. The study shows that the closer the entire top surface of the inclined impermeable barrier, the more effective the inclined impermeable barrier in minimizing bottom water cresting effect. The value of Reynolds number was found to be dependent on the orientation, thickness, position, and width of an impermeable barrier.
Keywords: Water cresting, Optimization, impermeable barrier.
1 Introduction
For over a decade, cresting in horizontal wells or coning in vertical wells has been a major problem in oil reservoirs characterized by strong gas cap and or strong bottom aquifer. Cresting in horizontal wells is often described as the protruded, crest-like movement of effluent(s) (unwanted water and or gas) in an oil reservoir towards the perforation of the horizontal well as a result of the imbalance of gravitational and viscous forces [1-4]. This results in displacement of oil by the effluent(s) towards the perforations of the well [1], until a breakthrough is experienced. At post-breakthrough, the effluent(s) dominate production, posing adverse effects in terms of overall oil productivity, operating and handling the cost of the water and/or gas produced and possibly the early shutting-in of wells [1]. Although cresting and coning are governed by similar principle, its effect in Horizontal wells is less detrimental due to the massive exposure of its laterals in the reservoir compared to vertical wells, resulting in a lower pressure drop and hence a preferred candidate in cresting scenarios [1].
prevention methods [5-33], gravity segregation [34, 35] and ICDs [36, 37]. Despite the wide research focus on coning control and prevention in vertical wells, little research exists for cresting control in horizontal wells [38]. Akangbou et al. [39] presented a novel experimental procedure to proactively control cresting in horizontal wells using an electromagnetic valve and effluent(s) breakthrough time. Yue et al. [28] numerically studied the effect of position and size of an impermeable barrier on bottom water cresting. They concluded that increase in impermeable barrier size (width and thickness) and vertical-displacement from the Water-Oil-Contact (WOC), yielded a higher critical rate. Yue et al. [38] investigated the effects of well, reservoir parameters, horizontally-placed semi-permeable and imsemi-permeable barriers on bottom water cresting. Yue et al. [27] numerically studied the effect of position and size of an assumed horizontal-placed, semi-permeable and impermeable barriers on bottom water cresting. They noticed that increase in semi-permeable barrier size, thickness and vertical position of the barrier resulted in a higher critical rate, hence a delay in bottom water breakthrough time. Although they stated that impermeable and semi permeable barriers can prevent or delay bottom water encroachment, they observed that the impermeable barrier performed better than the semi- permeable barrier but neglecting the effect its orientation in the reservoir for optimization purposes. Therefore, this paper sets out to numerically investigate the effect of impermeable barrier orientation, its vertical position, width and thickness in a homogeneous reservoir faced with bottom water cresting problem.
2 Reservoir and horizontal well models
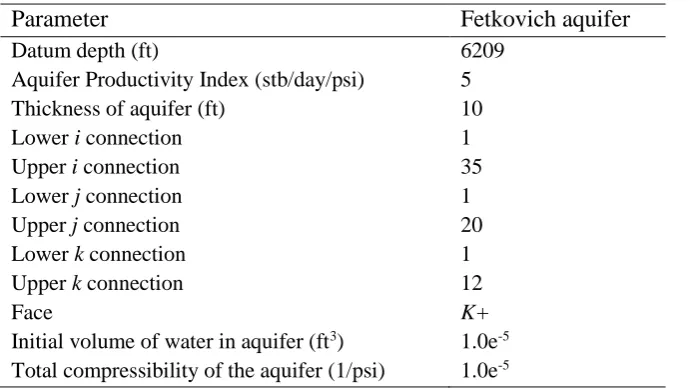
The reservoir model and reservoir phases used in this investigation are illustrated in Figure 1. The reservoir model was assumed to be rectangular, homogeneous and consisted of 35 grid-blocks in the x-direction, 20 grid-blocks in the y-direction and 12 grid-blocks/layers in the z-direction with a total of 8400 active cells. Each grid block from layers 1-11 measured 40 ft in the x-direction, 60 ft in the y-direction and 5 ft in the z-direction while each grid block in layer 12 measured 40 ft in the x-direction, 60 ft in the y-direction and 10 ft in the z-direction. The reservoir fluids consist of water and oil phases. For sensitivity analysis, the adequate Fetkovich aquifer was connected to the entire base of water cell on Layer 12, to simulate the constant pressure of bottom water. The reservoir data and fluid properties are summarized in Table 1 while the data for Fetkovich aquifer is illustrated in Table 2. The initial aquifer pressure for the Fetkovich aquifer was defaulted, thereby placing the aquifer as close as possible to equilibrium with the reservoir pressure.
The horizontal well and its lateral placement in the in the reservoir is illustrated in Figure
2. As shown in Figure 2, the horizontal well model was located at i = 4-35 (opened to liquid
production from i = 6-35), j = 11 and k = 2, far away from the WOC or layer saturated with
x-axis
[image:4.595.81.459.72.290.2]z-axis y-axis
Figure. 1. Reservoir model showing oil and water saturations.
y-axis x-axis
z-axis Horizontal
well
[image:4.595.79.467.316.587.2]Horizontal well lateral in layer 2
Figure. 2. Horizontal well in reservoir.
Table 1. Reservoirand horizontal well data
Parameter Value
Reservoir thickness (ft) 65
Reservoir length (ft) 1400
Reservoir width (ft) 1200
Reservoir Pressure (psia) 2500
Horizontal well Datum depth (ft) 6164
[image:4.595.80.399.659.766.2]Horizontal well production rate (stb/day) 9000
Reservoir Water Compressibility (1/psi) 3.0e-6
Reservoir oil Density (ρo), lb/ft3 58
Reservoir water Density (ρw), lb/ft3 64.2
Reservoir water Viscosity (μw), cP 0.48
Reservoir oil Compressibility (1/psi) 1.5e-5
Reservoir oil viscosity (μo), cP 3.8
Porosity (oil zone) 0.35
Porosity (water zone) 1e10
[image:5.595.79.429.262.457.2]Horizontal well diameter (ft) 0.41667
Table 2. Data for Fetkovich aquifer
Parameter Fetkovich aquifer
Datum depth (ft) 6209
Aquifer Productivity Index (stb/day/psi) 5
Thickness of aquifer (ft) 10
Lower i connection 1
Upper i connection 35
Lower j connection 1
Upper j connection 20
Lower k connection 1
Upper k connection 12
Face K+
Initial volume of water in aquifer (ft3) 1.0e-5
Total compressibility of the aquifer (1/psi) 1.0e-5
3 Impermeable barriers
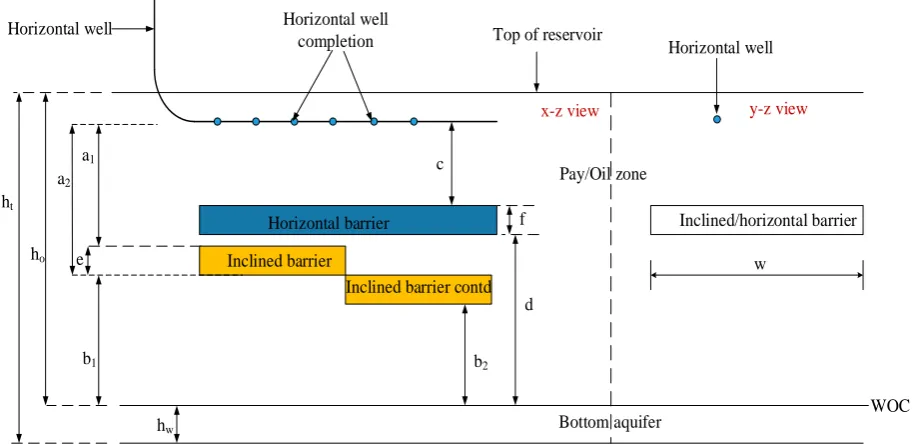
A conceptual design of the different orientation of impermeable barriers used in this investigation on the x-z axis and y-z axis are illustrated in Figure 3. The impermeable barrier effective permeability was modeled by setting the effective permeability for the region of
interest or grid blocks to zero (0 mD). In Figure 3, a1 and a2 represent the distance of
horizontal well to inclined (step-like) impermeable barrier, c represents the distance of
horizontal well to horizontal impermeable barrier, hw represents the height/thickness of the
aquifer, ho represents the height of the oil/pay zone, htrepresents the height/thickness of the
reservoir, b1 and b2 represents the distance of inclined impermeable barrier to the WOC, d
represents the distance of horizontal impermeable barrier to the WOC, w represents the
width of the impermeable barriers while e and f represents the thickness of the inclined and
Bottom aquifer Pay/Oil zone Horizontal well Horizontal well
completion Top of reservoir
ht
ho
hw
WOC a1
a2
b2
b1
e
f Horizontal barrier
Inclined barrier w
y-z view x-z view
Inclined/horizontal barrier
d c
Horizontal well
[image:6.595.81.538.76.298.2]Inclined barrier contd
Figure. 3. Orientations of impermeable barriers on the x-z axis and y-z axis in the reservoir.
Table 3. Input data for Impermeable barrier sensitivity simulations
Parameter Horizontal barrier(s) Inclined barrier(s)
Thickness of barrier (ft) f = 5, 10, 15 e = 5, 10, 15
Width of barrier (ft) w = 420, 540, 660 w = 420, 540, 660
Length of barrier (ft) 1200 (grid block 6-35) 1200 (grid block 6-35)
Distance of horizontal well to impermeable barrier (ft) c = 10, 15 a1 = 10, 15; a2 = 15, 20, 25, 30
[image:6.595.78.398.527.766.2]Distance of impermeable barrier to WOC (ft) d = 15, 20, 25, 30 b1 = 15, 20, 25, 30; b2 = 0, 5, 10, 15, 20, 25
Table 4. Detailed description of cases used for horizontal impermeable barrier simulations
Cases f (ft) c (ft) w (ft) d (ft)
Case 1 - - - -
Case 2 5 10 420 30
Case 3 5 10 540 30
Case 4 5 10 660 30
Case 5 5 15 420 25
Case 6 5 15 540 25
Case 7 5 15 660 25
Case 2A 10 10 420 25
Case 3A 10 10 540 25
Case 4A 10 10 660 25
Case 5A 10 15 420 20
Case 6A 10 15 540 20
Case 7A 10 15 660 20
Case 2B 15 10 420 20
Case 4B 15 10 660 20
Case 5B 15 15 420 15
Case 6B 15 15 540 15
[image:7.595.76.533.174.467.2]Case 7B 15 15 660 15
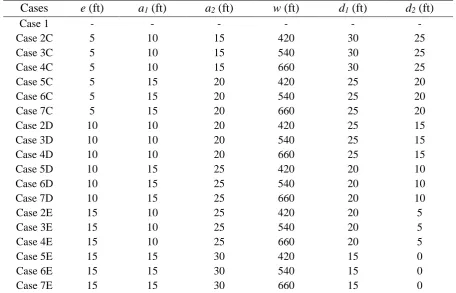
Table 5. Detailed description of cases used for inclined (step-like) impermeable barrier simulations
Cases e (ft) a1 (ft) a2 (ft) w (ft) d1 (ft) d2(ft)
Case 1 - - - -
Case 2C 5 10 15 420 30 25
Case 3C 5 10 15 540 30 25
Case 4C 5 10 15 660 30 25
Case 5C 5 15 20 420 25 20
Case 6C 5 15 20 540 25 20
Case 7C 5 15 20 660 25 20
Case 2D 10 10 20 420 25 15
Case 3D 10 10 20 540 25 15
Case 4D 10 10 20 660 25 15
Case 5D 10 15 25 420 20 10
Case 6D 10 15 25 540 20 10
Case 7D 10 15 25 660 20 10
Case 2E 15 10 25 420 20 5
Case 3E 15 10 25 540 20 5
Case 4E 15 10 25 660 20 5
Case 5E 15 15 30 420 15 0
Case 6E 15 15 30 540 15 0
Case 7E 15 15 30 660 15 0
4 Results and discussion
Sets of simulation cases defined in Tables 4 and 5 were used to carry out sensitivity analyses in an oil reservoir affected by bottom water cresting problem. The simulation for each case
was run from May-2017 to December-2023. From Table 3 in section 3, the total number of
impermeable barrier grid block(s) simulated ranged between 0-990.
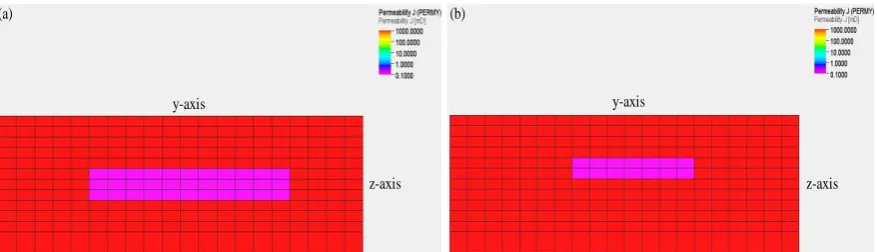
Figure 4 illustrates the permeability results of simulated impermeable barriers for different cases. Figure 4(a) represents the permeability results on the y-z axis for case 7B while Figure 4(b) represents the permeability result for Case 2A on the y-z axis. Figure 5 depicts the simulation result of water cresting occurring in a formation with no defined impermeable barrier (Case 1/base case) on the y-z axis. Figure 5(a) shows the reservoir at
static condition (Time, T = 0 days) while Figure 5(b-d) illustrates water cresting process at
T = 300, 600 and 900 days respectively. Figure 6 shows the simulation result of water
cresting occurring in a formation with a defined horizontal impermeable barrier for Case
2A (f = 10 ft, c = 10 ft, w = 420 ft and d = 25 ft) on the y-z axis. Figure 6(a) shows the
reservoir at static condition (T = 0 days) while Figure 6(b-d) illustrates water cresting
process at T = 300, 600 and 1500 days respectively. Figure 7 shows the simulation result of
water cresting occurring in a formation with a defined horizontal impermeable barrier for
reservoir at static condition (T = 0 s) while Figure 7(b-c) illustrates water cresting process
at T = 300, 600 and 1500 days respectively.
From the simulation results presented in Figures 5-7, it can be clearly seen that an impermeable barrier impedes the rise of bottom water during cresting and distorts the crest-like shape. More so, the bottom water height can be seen to be closer to the horizontal well in Case 1 compared to Cases 2A and 7B at about 300 days, reaching the perforations of the horizontal well in layer 2 at about 600 days.
z-axis
y-axis y-axis
z-axis
[image:8.595.88.527.183.309.2](a) (b)
Figure. 4. Formation with impermeable barriers (a) Case 7B, (b) Case 2A.
P1
P1 P1
P1
z-axis
y-axis y-axis
z-axis
y-axis
z-axis z-axis
y-axis
(a) (b)
(c) (d)
[image:8.595.82.529.356.597.2]P1
P1
P1
z-axis
y-axis y-axis
z-axis
y-axis
z-axis z-axis
y-axis
(a) (b)
(c) (d)
[image:9.595.88.530.70.317.2]P1
Figure. 6. Water cresting process for Case 2A at (a) static condition (T = 0 day), (b) simulation at T = 300 days, (c) simulation at T = 600 days, (d) simulation at T = 1500 days.
P1
P1
P1
z-axis
y-axis y-axis
z-axis
y-axis
z-axis z-axis
y-axis
(a) (b)
(c) (d)
[image:9.595.85.531.378.607.2]P1
Figure. 7. Water cresting process for Case 7B at (a) static condition (T = 0 day), (b) simulation at T = 300 days, (c) simulation at T = 600 days, (d) simulation at T = 1500 days.
4.1 Effect of impermeable barrier thickness on oil and water production cumulative
Figures 8 and 9 illustrate the effect of impermeable barrier thickness on oil and water production cumulative for horizontal and inclined impermeable barriers respectively, in
standard cubic meters (sm3). In Figure 8, Cases 1, 2, 2A, 2B, 3, 3A, 3B were simulated to
determine the effect of horizontal impermeable barrier thickness on oil and water production
As expected, Figure 8 shows that Case 1 had the lowest oil production cumulative and highest water production cumulative when compared with all cases. More so, it was observed that the thicker the impermeable barrier, the lower the oil production cumulative and the higher the water production cumulative, contradicting the results presented by Yue
et al. [28]. In scenario 1, highest oil production cumulative was observed in Case 2
(383956.62 sm3) and least in Case 2B (358798.31 sm3) while the highest water production
cumulative was observed in Case 2B (343699.63 sm3) and least in Case 2 (315334.53 sm3).
In scenario 2, highest oil production cumulative was observed in Case 3 (384677.22 sm3)
and least in Case 3B (355229.97 sm3) while the highest water production cumulative was
observed in Case 3B (347722.78 sm3) and least in Case 3 (314521.72 sm3).
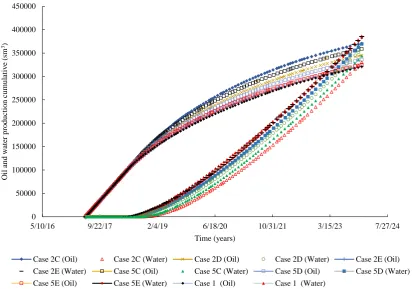
In Figure 9, Cases 1, 2C, 2D, 2E, 5C, 5D, 5E were simulated to determine the effect of
inclined impermeable barrier thickness on oil and water production cumulative. Scenario 3
(Cases 2C, 2D and 2E) and Scenario 4 (Cases 5C, 5D and 5E). A similar trend to Figure 8
was observed in Figure 9. In scenario 3 and 4, highest oil production cumulative was
observed in Cases 2C and 5C respectively while highest water production cumulative was observed in Cases 2E and 5E respectively.
We believe that an impermeable barrier not only minimizes water cresting effect but also negatively affects the mobility of the reservoir oil around the impermeable barrier. Therefore, the thinner the barrier thickness, the better the performance of horizontal wells in reservoirs with strong bottom water.
Figure. 8. Effect of horizontal impermeable barrier thickness on cumulative oil and water production cumulative.
0 50000 100000 150000 200000 250000 300000 350000 400000 450000
5/10/16 9/22/17 2/4/19 6/18/20 10/31/21 3/15/23 7/27/24
O
il
a
n
d
w
at
er
p
ro
d
u
ct
io
n
c
u
mu
la
ti
v
e
(sm
3)
Time (years)
Figure. 9. Effect of inclined impermeable barrier thickness on oil and water production cumulative.
4.2 Effect of impermeable barrier width on oil and water production cumulative
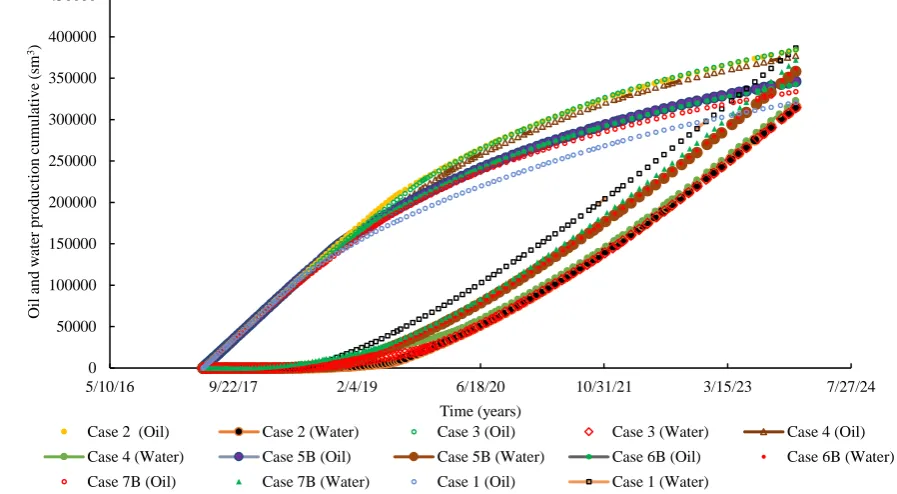
Figures 10 and 11 illustrate the effect of impermeable barrier width on oil and water production cumulative for horizontal and inclined impermeable barriers respectively. In Figure 10, Cases 1, 2, 3, 4, 5B, 6B and 7B were simulated to determine the effect of horizontal impermeable barrier width on oil and water production cumulative. As expected,
Case 1 had the lowest oil production cumulative (320821.41 sm3) and highest water
production cumulative (386515.56 sm3) when compared with all cases. From Table 4 in
section 3, Cases 2, 3, 4 and Cases 5B, 6B and 7B were compared separately in terms of oil
and water production cumulative. As shown in Figure 10, Cases 3 (0.45x the reservoir
width) and 5B had the highest oil production cumulative of 384677.22 sm3 and 345857.25
sm3 respectively while the highest water production cumulative was observed in Cases 4
(322828.44 sm3) and 7B (372022.97 sm3). This inconsistency in results is contrary to that
reported by Yue et al. [27]. Therefore, an increase in impermeable barrier width does not always result in higher oil and lower water production cumulative. We believe the reason for this inconsistent trend is due to an optimum impermeable barrier condition which involves the vertical position of the impermeable barrier in the reservoir and thickness which could influence the mobility of the reservoir phases.
In Figure 11, Cases 2D, 3D, 4D, 5E, 6E, and 7E were simulated to determine the effect of inclined impermeable barrier width on oil and water production cumulative. In Figure 11, Cases 2D, 3D, 4D and Cases 5E, 6E, 7E were compared separately. Cases 2D and 5E had highest oil production cumulative and lowest water production cumulative when compared with the worst cases (4D and 7E). Hence for a reduction of barrier width by 36%
(from 660 ft to 420 ft), an increment of 10579.03 sm3 in oil production cumulative was
`observed between Cases 2D and 4D while an increment of 4959.19 sm3 in oil production
0 50000 100000 150000 200000 250000 300000 350000 400000 450000
5/10/16 9/22/17 2/4/19 6/18/20 10/31/21 3/15/23 7/27/24
O
il
a
n
d
w
at
er
p
ro
d
u
ct
io
n
c
u
mu
la
ti
v
e
(sm
3)
Time (years)
production cumulative (11927.62 sm3) was observed between Cases 2D and 4D while a
decrement of (5591.66 sm3) was observed for oil production cumulative between Cases 5E
and 7E.
Figure. 10. Effect of inclined impermeable barrier width on oil and water production cumulative.
Figure. 11. Effect of inclined impermeable barrier width oil and water production cumulative.
0 50000 100000 150000 200000 250000 300000 350000 400000 450000
5/10/16 9/22/17 2/4/19 6/18/20 10/31/21 3/15/23 7/27/24
O il a n d w at er p ro d u ct io n c u mu la ti v e (sm 3) Time (years)
Case 2 (Oil) Case 2 (Water) Case 3 (Oil) Case 3 (Water) Case 4 (Oil) Case 4 (Water) Case 5B (Oil) Case 5B (Water) Case 6B (Oil) Case 6B (Water) Case 7B (Oil) Case 7B (Water) Case 1 (Oil) Case 1 (Water)
0 50000 100000 150000 200000 250000 300000 350000 400000 450000
5/10/16 9/22/17 2/4/19 6/18/20 10/31/21 3/15/23 7/27/24
O il a n d w at er p ro d u ct io n c u mu la ti v e (sm 3) Time (years)
Case 2D (Oil) Case 2D (Water) Case 3D (Oil) Case 3D (Water) Case 4D (Oil)
Case 4D (Water) Case 5E (Oil) Case 5E (Water) Case 6E (Oil) Case 6E (Water)
[image:12.595.80.529.142.389.2] [image:12.595.82.517.450.708.2]4.3 Effect of impermeable barrier position (vertical) on oil and water production cumulative
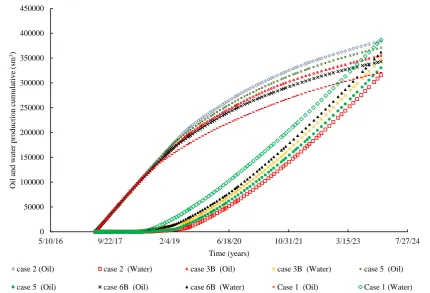
The effect of impermeable barrier vertical position on oil and water production cumulative for horizontal and inclined impermeable barriers are shown in Figures 12 and 13 respectively. In Figure 12, Cases 2, 5 and Cases 3B and 6B were compared separately in terms of oil and water production cumulative. It was observed that Cases 2 and 3B had the
higher oil production cumulative of 383956.62 sm3 and 355229.97 sm3 respectively at lower
water production cumulative.
In Figure 13, Cases 1, 4C, 7C, 4D and 7D were simulated to determine the effect of inclined impermeable barrier vertical position on oil and water production cumulative. At the stop of simulation, Case 1 can be seen to achieve the lowest oil production cumulative and highest water production cumulative when compared with all cases. In Figure 13, Cases 4C, 7C, and Cases 4D, 7D were compared separately. Cases 4C and 5D can be seen to have higher oil production cumulative and lowest water production cumulative when compared with Cases 7C and 7D respectively. Therefore, an increase in depth of both inclined and horizontal impermeable barriers resulted in lower oil production cumulative and higher water production cumulative, which was in good agreement with Yue et al. [27],[28].
Figure 14 illustrates the effect of vertical displacement of the horizontal well to the
inclined impermeable barrier (a1≠a2), simulated between Cases 7C, 7D, and 7E. As shown
in Figure 14, the closer a1 is to a2, the more effective the impermeable barrier. Hence highest
oil production cumulative (352608.41 sm3) and lowest water production cumulative
(350677.97 sm3) was observed compared to Cases 7D and 7E. A similar trend can be seen
to occur between Cases 5C, 5D, and 5E.
Figure. 12. Effect of inclined impermeable position width on oil and water production cumulative.
0 50000 100000 150000 200000 250000 300000 350000 400000 450000
5/10/16 9/22/17 2/4/19 6/18/20 10/31/21 3/15/23 7/27/24
O
il
a
n
d
w
at
er
p
ro
d
u
ct
io
n
c
u
mu
la
ti
v
e
(sm
3)
Time (years)
case 2 (Oil) case 2 (Water) case 3B (Oil) case 3B (Water) case 5 (Oil)
[image:13.595.84.515.412.705.2]Figure. 13. Effect of inclined impermeable barrier position on oil and water production cumulative.
Figure. 14. Effect of the vertical displacement of horizontal well to inclined impermeable barrier oil and water production cumulative. 0 50000 100000 150000 200000 250000 300000 350000 400000 450000
5/10/16 9/22/17 2/4/19 6/18/20 10/31/21 3/15/23 7/27/24
O il a n d w at er p ro d u ct io n c u mu la ti v e (sm 3) Time (years)
Case 4C (Oil) Case 4C (Water) Case 4D (Oil) Case 4D (Water) Case 7C (Oil) Case 7C (Water) Case 7D (Oil) Case 7D (Water) Case 1 (Oil) Case 1 (Water)
0 50000 100000 150000 200000 250000 300000 350000 400000 450000
Case 7C Case 7D Case 7E Case 5C Case 5D Case 5E
[image:14.595.85.527.79.394.2] [image:14.595.84.506.428.686.2]4.3 Comparison on the effects of inclined and horizontal barriers on oil and water production cumulative
Figure 15 illustrates a comparison between inclined and horizontal barriers in terms of oil and water production cumulative. The best cases (Cases 1, 3C, 3, 6, 2A, 5A, 2B, 5B, 6C, 2D, 5D, 2E and 5E) from the effects of impermeable barrier width, thickness, and vertical positions are represented and compared graphically in Figure 15. As shown in Figure 15, Case 1 is seen to have the highest water production cumulative as well as the least oil production cumulative while Case 3 (horizontal impermeable barrier) achieved the highest
oil production cumulative (384677.22 sm3) and least water production cumulative
(314521.72 sm3). Therefore, in all cases, an optimum horizontal impermeable barrier is
recommended in reservoirs with strong bottom water.
Figure. 15. Comparison of inclined and horizontal barriers.
4.4 Effect of impermeable barrier on Reynolds number
Figures 16 and 17 illustrate the effect of impermeable barrier on Reynolds number for horizontal and inclined impermeable barriers respectively. A similar equation (Equation 1)
for estimation of Reynolds number (Re) used by Akangbou et al. [1], was applied in this
study. In Equation 1, the horizontal well diameter specified in Table 1 was assumed to be equal to the inside diameter of the horizontal well. Unlike Akangbou et al. [1], actual (not cumulative) oil flow rates were used and the estimated Reynolds number in Figures 16 and
17 were greater than 2000 (Re > 2000), depicting a turbulent flow regime between
July-2018 and July-2021. As shown in Figures 16 and 17, horizontal and inclined impermeable barriers affect the Reynolds number during cresting. Case 1 can be seen to have lower turbulence compared to Cases 2, 3, 4, 2C, 3C and 4C.
250000 270000 290000 310000 330000 350000 370000 390000 410000
Case 1 Case 3C Case 3 Case 6 Case 2A Case 5A Case 2B Case 5B Case 6C Case 2D Case 5D Case 2E Case 5E
O
il
a
n
d
w
at
er
p
ro
d
u
ct
io
n
c
u
mu
la
ti
v
e
(sm
3)
[image:15.595.82.534.261.540.2]𝑅𝑒=
𝜌𝑜𝐷𝑖𝑄𝑜 𝜇𝑜𝐴
(1)
Where 𝑄𝑜 is the oil flow rate in cubic meter per second, 𝐷𝑖 is the inside diameter of the
horizontal well in meters, 𝜇𝑜 is the viscosity of the oil in Newton-second per square meter,
𝜌𝑜 is the density of the oil in Kilogram per cubic meters, 𝐴 is the cross-sectional area of the
horizontal well in square meters and 𝑅𝑒 is the Reynolds number in dimensionless unit.
Figure. 16. Effect of impermeable barrier on Reynolds number (horizontal impermeable barrier cases).
Figure. 17. Effect of impermeable barrier on Reynolds number (inclined impermeable barrier cases).
3000 5000 7000 9000 11000 13000 15000
4/10/18 10/27/18 5/15/19 12/1/19 6/18/20 1/4/21 7/23/21 2/8/22
R ey n o ld s n u mb er ( D ime n si o n le ss) Time (years)
Case 1 Case 2 Case 3 Case 4
3000 5000 7000 9000 11000 13000 15000
4/10/18 10/27/18 5/15/19 12/1/19 6/18/20 1/4/21 7/23/21 2/8/22
R ey n o ld s n u mb er ( D ime n si o n le ss) Time (years)
[image:16.595.82.451.206.452.2] [image:16.595.85.444.489.709.2]5 Conclusion
A rigorous numerical study was performed on the effects of the orientation of impermeable barriers on bottom water cresting. From the analyses, it can be concluded that:
1. The orientation of an impermeable barrier is important for minimizing bottom water
cresting effect. An optimum horizontally-placed impermeable barrier was found to be more effective when compared with inclined impermeable barriers. For inclined
impermeable barriers, the closer the height of a1 and a2, the more effective the
impermeable barrier.
2. The effectiveness of an impermeable barrier is insensitive to its width. The thinner
the impermeable barrier and the closer the top of the impermeable barrier to the horizontal well the more effective the impermeable barrier. A horizontal
impermeable barrier; 0.08x in thickness to the reservoir height and 0.45x to reservoir
width was found to be most effective.
3. The presence of an impermeable barrier results in an increase in Reynolds number.
Water cresting is independent of Reynolds number and Reynolds number depends on the orientation, thickness, position, and width of an impermeable barrier during cresting.
References
1. Akangbou, H.N., Burby, M., and Nasr, G., "Effectively optimizing production of horizontal wells in homogeneous oil reservoirs", Journal of Petroleum Science and Engineering 2017; 150:128-136.
2. Kromah, M.J. and Dawe, R.A., "Reduction of Oil and Gas Coning Effects by Production Cycling and Horizontal Wells", Petroleum Science and Technology 2008; 26(3):353-367.
3. Makinde, F.A., Adefidipe, O.A., and Craig, A.J., "Water Coning in Horizontal Wells: Prediction of Post-Breakthrough Performance", International Journal of Engineering & Technology 2011; (11)1.
4. Permadi, P., "Fast Horizontal-Well Coning Evaluation Method", Society of Petroleum Engineers 1996.
5. Dai, L.C., et al., "Case Study on Polymer Gel to Control Water Coning for Horizontal Well in Offshore Oilfield", Offshore Technology Conference 2011.
6. Kantzas, A., et al., "Design Strategies For Improved Conformance Using Polymer Gels", Petroleum Society of Canada 1994.
8. Thakur, G.C. and Tachuk, A.R, "Retardation Of Water Coning In Oil Wells Using Polymers - A Reservoir Simulation Application", Petroleum Society of Canada 1974.
9. White, J.L., Goddard, J.E, and Phillips, H.M., "Use of Polymers To Control Water Production in Oil Wells", Society of Petroleum Engineers 1973.
10. Zaitoun, A., Kohler, N., and Montemurro, M.A., "Control of Water Influx in Heavy-Oil Horizontal Wells by Polymer Treatment", Society of Petroleum Engineers 1992.
11. Albonico, P., et al., "New Polymer Gels for Reducing Water Production in High-Temperature Reservoirs", Society of Petroleum Engineers 1994.
12. Lakatos, I., et al., "Restriction of Gas Coning by a Novel Gel/ Foam Technique", Society of Petroleum Engineers 1998.
13. Surguchev, L.M., "Water Shut-Off: Simulation and Laboratory Evaluation", Society of Petroleum Engineers 1998.
14. Shirif, E., "Mobility Control by Polymers Under Bottom-Water Conditions, Experimental Approach", Society of Petroleum Engineers 2000.
15. Zaitoun, A. and Pichery, T., "A Successful Polymer Treatment For Water Coning Abatement in Gas Storage Reservoir", Society of Petroleum Engineers 2001.
16. Ghahfarokhi, R.B., Green, D.W., and Liang, J.T., "Simulation of Gelled Polymer Treatments in the Arbuckle Formation", Society of Petroleum Engineers 2006.
17. Vasquez, J.E., et al., "Organically Crosslinked Polymer System for Water Reduction Treatments in Mexico", Society of Petroleum Engineers 2006.
18. El-karsani, K.S.M., Al-Muntasheri, G.A., and Hussein, I.A., "Polymer Systems for Water Shutoff and Profile Modification: A Review Over the Last Decade", Society of Petroleum Engineers 2014.
19. Al-Muntasheri, G.A., et al., "Water Shut-off with Polymer Gels in A High Temperature Horizontal Gas Well: A Success Story" Society of Petroleum Engineers 2010.
20. Salavatov, T.S. and Ghareeb, A., "Predicting the behaviour of water and gas coning in horizontal wells", Oil and Gas Business 2009.
21. Brown, K.E., "Technology of Artificial Lift Methods", Penn Well Publishing Company, Tulsa, Oklahoma, 1984.
23. Howard, G.C. and Fast, C.R., "Squeeze Cementing Operations", AIME 1950; (189):53-64.
24. Smith, C.R. and Pirson, S.J., "Water Coning Control in Oil Wells by Fluid Injection". Society of Petroleum Engineers 1963.
25. Strickland, R.F., "Artificial barriers may control water coning", 1. Oil Gas J. 1974; (10):61–64.
26. Wojtanowicz, A.K., Hui, X., and Zaki, B., "Segregated production method for oil wells with active water coning", J. Pet. Sci. Eng. 1994; 11(1): 21–35.
27. Yue, P., et al., "The critical parameters of a horizontal well influenced by a semi-permeable barrier considering thickness in a bottom water reservoir", Journal of Petroleum Science and Engineering 2015; 129:88-96.
28. Yue, P., et al., "The critical rate of horizontal wells in bottom-water reservoirs with an impermeable barrier", Pet. Sci. 2012; 9(2): 223–228.
29. Jin, L. and A.K. Wojtanowicz A.K., "Analytical Assessment of Water-free Production in Oil Wells with Downhole Water Loop for Coning Control", SPE Production and operations symposium 2011.
30. Jin, L., A.K. Wojtanowicz, and R.G. Hughes, "An Analytical Model for Water Coning Control Installation in Reservoir with Bottom Water", Journal of Canadian Petroleum Technology 2010; 49(5): 65-70.
31. Yu, H., et al., "Case Study of Blocking Water Coning in Horizontal Well for Steam Stimulation in Heavy Oil Reservoir", SPE Asia Pacific Oil and Gas Conference and Exhibition 2016.
32. Temizel, C., et al., "Production Optimization under Injection of Biopolymer, Synthetic Polymer and Gels in a Heterogeneous Reservoir", SPE Eastern Regional Meeting 2016.
33. Ogienagbon, A., et al., "Experimental Investigation of the Feasibility of Polymer Flooding in a Shallow Niger Delta Oil Reservoir", SPE Nigeria Annual International Conference and Exhibition 2016.
34. Singhal, A.K., "Water And Gas Coning/Cresting - A Technology Overview", Petroleum Society of Canada 1993.
35. Singhal, A.K., "Water And Gas Coning/ Cresting A Technology Overview". Petroleum Society of Canada 1996.
36. Schevchenko, E., "Experimental study of water coning phenomenon in perforated pipes". 2013:1-77.
38. Yue, P., et al., "The critical parameters of a horizontal well influenced by a semi-permeable barrier in bottom water reservoir", Petroleum Science, Springer 2015; (22):1448-1455.