comm
en
t
re
v
ie
w
s
re
ports
de
p
o
si
te
d r
e
se
a
rch
refer
e
e
d
re
sear
ch
interacti
o
ns
inf
o
rmation
Genome mapping and expression analyses of human intronic
noncoding RNAs reveal tissue-specific patterns and enrichment in
genes related to regulation of transcription
Helder I Nakaya, Paulo P Amaral, Rodrigo Louro, André Lopes,
Angela A Fachel, Yuri B Moreira, Tarik A El-Jundi, Aline M da Silva,
Eduardo M Reis and Sergio Verjovski-Almeida
Address: Departamento de Bioquimica, Instituto de Quimica, Universidade de São Paulo, 05508-900 São Paulo, SP, Brazil.
Correspondence: Sergio Verjovski-Almeida. Email: [email protected]
© 2007 Nakaya et al.; licensee BioMed Central Ltd.
This is an open access article distributed under the terms of the Creative Commons Attribution License (http://creativecommons.org/licenses/by/2.0), which permits unrestricted use, distribution, and reproduction in any medium, provided the original work is properly cited.
Expression of human totally intronic noncoding RNAs
<p>An analysis of the expression of 7,135 human totally intronic noncoding RNA transcripts plus the corresponding protein-coding genes using oligonucleotide arrays has identified diverse intronic RNA expression patterns, pointing to distinct regulatory roles.</p>
Abstract
Background: RNAs transcribed from intronic regions of genes are involved in a number of processes related to post-transcriptional control of gene expression. However, the complement of human genes in which introns are transcribed, and the number of intronic transcriptional units and their tissue expression patterns are not known.
Results: A survey of mRNA and EST public databases revealed more than 55,000 totally intronic noncoding (TIN) RNAs transcribed from the introns of 74% of all unique RefSeq genes. Guided by this information, we designed an oligoarray platform containing sense and antisense probes for each of 7,135 randomly selected TIN transcripts plus the corresponding protein-coding genes. We identified exonic and intronic tissue-specific expression signatures for human liver, prostate and kidney. The most highly expressed antisense TIN RNAs were transcribed from introns of protein-coding genes significantly enriched (p = 0.002 to 0.022) in the 'Regulation of transcription' Gene Ontology category. RNA polymerase II inhibition resulted in increased expression of a fraction of intronic RNAs in cell cultures, suggesting that other RNA polymerases may be involved in their biosynthesis. Members of a subset of intronic and protein-coding signatures transcribed from the same genomic loci have correlated expression patterns, suggesting that intronic RNAs regulate the abundance or the pattern of exon usage in protein-coding messages.
Conclusion: We have identified diverse intronic RNA expression patterns, pointing to distinct regulatory roles. This gene-oriented approach, using a combined intron-exon oligoarray, should permit further comparative analysis of intronic transcription under various physiological and pathological conditions, thus advancing current knowledge about the biological functions of these noncoding RNAs.
Published: 26 March 2007
Genome Biology 2007, 8:R43 (doi:10.1186/gb-2007-8-3-r43)
Received: 17 October 2006 Revised: 17 January 2007 Accepted: 26 March 2007 The electronic version of this article is the complete one and can be
Background
The five million expressed sequence tags (ESTs) deposited into public sequence databases probably constitute the best representation of the human transcriptome. Human EST data have been extensively used to identify novel genes in silico
[1,2] and novel exons of protein-coding genes [3-6]. Infor-matics analyses of the EST collection mapped to the human genome have also shown that the occurrence of overlapping sense/antisense transcription is widespread [7-9]. However, the complement of unspliced human transcripts that map exclusively to introns was not appreciated in those reports because the authors selected: transcripts with evidence of splicing [7]; pairs of sense-antisense messages for which at least one exon was colinear on the genome sequence [8]; or only ESTs where both a polyadenylation signal and a poly(A) tail were present [9].
A detailed analysis of the mouse transcriptome based on functional annotation of 60,770 full-length cDNAs revealed that 15,815 are noncoding RNAs (ncRNAs), of which 71% are unspliced/single exon, indicating that ncRNA is a major com-ponent of the transcriptome [10]. The recent completion and detailed annotation of the euchromatic sequence of the human genome has identified 20,000 to 25,000 protein-cod-ing genes [11]; however, noncodprotein-cod-ing messages were not assessed [11]. Extrapolation from the numbers for chromo-some 7 leads to an estimate of 3,700 human ncRNAs [12], and two databases of human and murine noncoding RNAs are available [13,14]. Nevertheless, there has been no compre-hensive count and mapping of human noncoding RNAs.
Examples of long (0.6-2 kb) intronic noncoding RNAs involved in different biological processes are described in the literature; they participate in the transcriptional or post-tran-scriptional control of gene expression [15,16], and in the reg-ulation of exon-skipping [17] and intron retention [18]. In addition, microarray experiments performed by our group have revealed a set of long intronic ncRNAs whose expression is correlated to the degree of malignancy in prostate cancer [19]. Introns are also the sources of short ncRNAs that have been characterized as microRNAs [20] and small nucleolar RNAs (snoRNAs) [21]. Biogenesis and function are better understood for microRNAs than for other ncRNAs; they may regulate as many as one-third of human genes [20], and tis-sue-specific expression signatures have been identified in dif-ferent human cancers [22]. However, the complement and biological functions of most of the complex and diverse ncRNA output, both the short and the long ncRNAs, remain to be determined.
Different types of noncoding RNA genes can be transcribed by either RNA polymerase (RNAP) I, II or III [15]. Recently, a fourth nuclear RNAP consisting of an isoform of the human single-polypeptide mitochondrial RNAP, named spRNAP IV, was found to transcribe a small fraction of mRNAs in human cells [23]. Surprisingly, α-amanitin up-regulates the
tran-scription of protein-coding mRNAs by this polymerase [23]. The role of spRNAP IV in the transcription of ncRNAs has not been investigated.
Here we report a search for hitherto unidentified exclusively intronic unspliced RNA transcripts in the collection of tran-scribed human sequences available at GenBank. The charac-terization comprises the identification and distribution analysis of 55,000 long intronic ncRNAs over the introns of protein-coding genes and the detection of a higher frequency of alternatively spliced exons for genes that undergo intronic transcription. An oligoarray with 44,000 elements represent-ing exons of protein-codrepresent-ing genes and the correspondrepresent-ing actively transcribed introns was employed to assess intronic transcription in different human tissues. Robust tissue signa-tures of exonic and intronic expression were detected in human kidney, prostate and liver. We found that in each tis-sue, the most highly expressed exclusively intronic antisense RNAs were transcribed from a group of protein-coding genes that is significantly enriched in the 'Regulation of transcrip-tion' Gene Ontology (GO) category. A subset of partially intronic antisense ncRNAs and the corresponding overlap-ping protein-coding exons showed a correlated pattern of tis-sue expression, indicating that intronic RNAs may have a role in regulating abundance or alternative exon-splicing events. Finally, we found that a significant fraction of wholly or par-tially intronic ncRNAs is insensitive to RNAP II inhibition by
α-amanitin, and another fraction is even up-regulated when RNAP II transcription is blocked, suggesting that a portion of long ncRNAs may be transcribed by spRNAP IV. We conclude that oligoarray-based gene-oriented analysis of intronic tran-scription is a powerful tool for identifying novel potentially functional noncoding RNAs.
Results
Defining a comprehensive reference dataset of spliced protein-coding genes
comm
en
t
re
v
ie
w
s
re
ports
refer
e
e
d
re
sear
ch
de
p
o
si
te
d r
e
se
a
rch
interacti
o
ns
inf
o
rmation
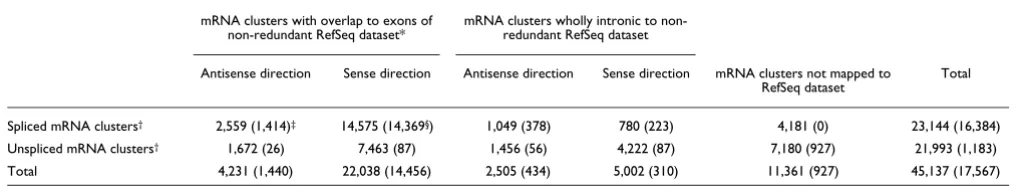
A detailed analysis of the mapping coordinates of these mRNA clusters with respect to the non-redundant RefSeq dataset revealed that 11,361 spliced and unspliced clusters mapped outside the non-redundant RefSeq dataset, repre-senting less well-characterized human transcripts. As expected, most of the mRNA clusters (14,575) were spliced and mapped to exons of RefSeq genes in the sense direction (Table 1). In addition, 2,559 spliced mRNA clusters mapped in the antisense direction with respect to the non-redundant RefSeq dataset, suggesting that 16% of the RefSeq genes have spliced natural antisense transcripts that overlap at least one of their exons. Among these antisense messages, 1,414 are already annotated as RefSeq transcripts. Such genomic organization of sense-antisense gene pairs seems to have been conserved throughout vertebrate evolution [7,8,24,25]. When the unspliced mRNA clusters were included, we found a total of 4,231 antisense messages with overlaps to exons in RefSeq genes, indicating that as many as 27% of the latter have antisense counterparts. A complete list of these sense/ antisense pairs with exon overlapping is given in Additional data file 1. This is in line with the prediction that over 20% of human transcripts might form sense-antisense pairs [9]. As a control, we cross-referenced the previously known sense/ antisense pairs to our dataset (see Materials and methods) and found that essentially 100% of known pairs [8,9] with evidence from RefSeq or mRNA are covered by our set. In addition, we found 1,116 RefSeqs with evidence of antisense exon-overlapping messages not covered by Yelin et al. [8] and 1,573 not covered by Chen et al. [9]. The complete list of sense/antisense pairs identified here is given in Additional data file 1 along with data for the cross-reference to published sense/antisense pairs.
Most interestingly, we found 7,507 spliced and unspliced mRNA clusters that are entirely intronic to the non-redun-dant RefSeq genes (Table 1). While 5,002 (67%) of these mapped in the sense direction and may represent new exons
of the corresponding genes, 2,505 (33%) mapped exclusively to the introns of RefSeq genes in the antisense direction and thus comprise a set of antisense mRNA clusters with no over-lap to exons of sense messages that had not been appreciated in the previous analyses. A complete list of the latter wholly intronic mRNA/RefSeq clusters and the corresponding pro-tein-coding RefSeq is given in Additional data file 1. Although the strandedness of genomic mapping of these mRNAs was taken as preliminary evidence of antisense transcription, direct experimental confirmation was obtained by microarray assays, as described in the following sections. Owing to the fragmented nature of the transcript data in GenBank, some of these intronic antisense messages may originate from the 3' or 5' ends of overlapping sense-antisense transcripts of adja-cent genes. However, most of them could represent inde-pendent antisense transcriptional units, which became more evident when data from the public EST repository were taken into account, as described below.
Identification of long, unspliced, totally intronic transcripts
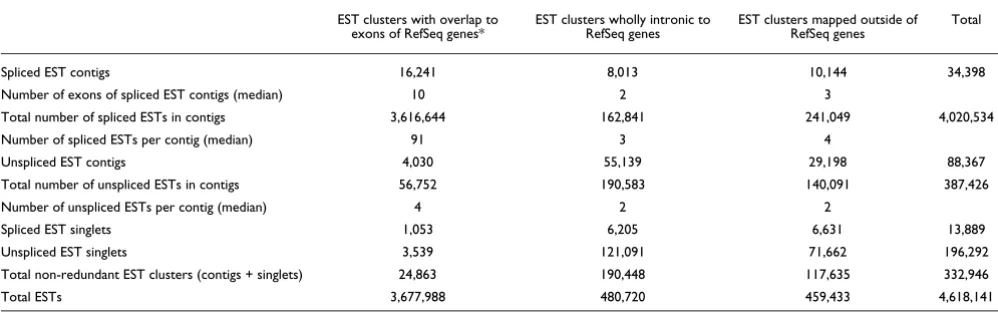
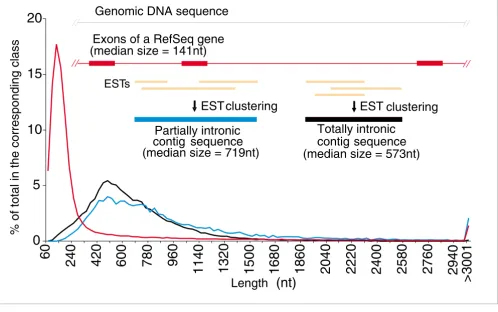
[image:3.612.51.561.121.214.2]We performed an extensive search for evidence of intronic transcription in the human dbEST collection (GenBank) com-prising 5,340,464 ESTs. Ambiguously mapping EST sequences were filtered as described in Materials and meth-ods, and then the genomic coordinates of overlapping EST sequences were used to merge 4,762,523 human ESTs into a set of 332,946 non-redundant EST clusters (Table 2). To avoid sequences that may have been derived from genomic contamination in the EST dataset, 210,181 EST singlets were excluded from further analyses; so only 34,398 spliced and 88,367 unspliced EST clusters were considered (Table 2). For each of these clusters, a consensus contig sequence was derived from the aligned genomic sequence (Figure 1). As expected, most ESTs (3,616,644) were grouped into 16,241 spliced EST contigs mapping to exons of the RefSeq reference dataset (Table 2). In addition, a small number of spliced EST
Table 1
Evidence of intronic transcription in the human mRNA/RefSeq GenBank dataset
mRNA clusters with overlap to exons of non-redundant RefSeq dataset*
mRNA clusters wholly intronic to non-redundant RefSeq dataset
Antisense direction Sense direction Antisense direction Sense direction mRNA clusters not mapped to
RefSeq dataset Total
Spliced mRNA clusters† 2,559 (1,414)‡ 14,575 (14,369§) 1,049 (378) 780 (223) 4,181 (0) 23,144 (16,384)
Unspliced mRNA clusters† 1,672 (26) 7,463 (87) 1,456 (56) 4,222 (87) 7,180 (927) 21,993 (1,183)
Total 4,231 (1,440) 22,038 (14,456) 2,505 (434) 5,002 (310) 11,361 (927) 45,137 (17,567)
*The non-redundant dataset comprises 15,783 spliced RefSeq units. This was defined by mapping to the human genome sequence the total of 22,458 RefSeq sequences from GenBank, excluding 1,184 unspliced RefSeq and 601 RefSeq that were wholly intronic to another RefSeq and merging the remaining 20,673 spliced RefSeq sequences that mapped to the same locus into 15,783 spliced non-redundant RefSeq units (a total of 4,890 RefSeq that represent isoforms of the same gene were thus merged into these units). †mRNA clusters were obtained by mapping to the human genome
sequence a total of 161,993 mRNA sequences followed by merging sequences with exon overlapping coordinates (see Materials and methods for details), resulting in a non-redundant set of 45,137 mRNA clusters. This set was aligned to the non-redundant RefSeq dataset and each mRNA cluster was classified as exonic, wholly intronic or mapping outside of any spliced non-redundant RefSeq unit. Sense/antisense orientation was annotated.
‡For each class, the number of mRNA clusters containing at least one RefSeq is shown in parentheses. §Excluding from the 15,783 spliced
clusters mapped to introns of the RefSeq genes. They may constitute fragments of novel exons in these genes, since the median exon length in these spliced EST contigs is 233 nucleotides (nt), similar to the median length of exons in the RefSeq reference dataset (141 nt).
The most interesting finding was that 55,139 unspliced EST contigs formed by grouping 190,583 ESTs mapped entirely to the introns of genes in the RefSeq dataset (Table 2). A marked feature of these unspliced, wholly intronic EST contigs is their low protein-coding potential; in silico analysis of the coding potential using the normalized ESTScan2 score [26] pre-dicted that 98% of them are probably noncoding transcripts, supporting the idea that they represent a separate class of noncoding RNAs. To check whether ESTScan2 predicted the coding potential of such a fragmented sequence dataset cor-rectly, we created a virtual dataset in silico composed of 55,139 exonic fragments from RefSeq genes with exactly the same lengths as the 55,139 wholly intronic EST contigs. ESTScan2 correctly predicted that 70% of these in silico -gen-erated virtual exonic fragments have coding potential. This supports the inference that since only a very few (approxi-mately 2%) of the wholly intronic EST contigs are predicted by ESTScan2 to have a protein-coding potential, most of the RNAs in this class (98%) are indeed noncoding messages.
Inspection of the length distribution curves (Figure 1) of the wholly intronic EST contigs reveals messages with lengths well over 1,000 nt. The median length (573 nt) is 4.1 times greater than the median length of exons (141 nt) in the RefSeq reference dataset. On the basis of these findings, we call these transcriptional units long totally intronic noncoding (TIN) transcripts.
Most mammalian snoRNAs [21] and a large fraction of micro-RNAs [27] are derived from introns in protein-coding and
noncoding genes transcribed by RNAP II. To address the pos-sibility that some of the TIN transcripts are the sources of these known small RNAs, we compared the human genomic coordinates of TIN sequences to those of 346 snoRNAs [28] and 383 microRNAs [29]. We found that 98 snoRNA or microRNA transcripts (14%) mapped to 86 TIN EST contigs, which may well be the sources of these small RNAs. The 86 TIN EST contigs comprise a very small portion (0.2%) of the TIN transcript dataset. We postulate that the large remaining set could be the source of new snoRNAs and microRNAs as well as of new types of ncRNAs.
Identification of long, unspliced, partially intronic transcripts
[image:4.612.57.556.131.287.2]A set of unspliced partially intronic noncoding (PIN) EST contigs was identified. A PIN contig was defined as a contig that overlaps an exon of a RefSeq gene and extends at least 30 bases over both ends of the exon (Figure 1). In total, 12,592 PIN EST contigs (median length 719 nt) were identified. An estimated 90% of PIN transcripts have no or limited protein-coding potential as determined by ESTScan2 analysis. By matching the PIN contig sequences to ESTs from high-quality directionally cloned EST libraries [7], to transcriptionally active regions (TARs) in whole-genome strand specific tiling arrays [30], and to the publicly available unspliced full-length mRNA dataset from GenBank we found that 5,992 PIN con-tigs (48%) have evidence of being transcribed antisense to the corresponding RefSeq gene. It should be noted that the above EST and tiling array information was not taken as definite evidence of antisense PIN transcription. Sense/antisense PINs were determined experimentally by oligoarray hybridi-zation as described in the following sections, using a pair of separate reverse complementary probes for each PIN in the array, and the strand information was obtained by mapping the actual 60-mer oligonucleotide single-stranded probe to the genomic sequence and recording its strand direction.
Table 2
Classification of GenBank ESTs with respect to their genome mapping coordinates in relation to the set of non-redundant spliced Ref-Seq sequences
EST clusters with overlap to
exons of RefSeq genes* EST clusters wholly intronic to RefSeq genes EST clusters mapped outside of RefSeq genes Total
Spliced EST contigs 16,241 8,013 10,144 34,398
Number of exons of spliced EST contigs (median) 10 2 3
Total number of spliced ESTs in contigs 3,616,644 162,841 241,049 4,020,534
Number of spliced ESTs per contig (median) 91 3 4
Unspliced EST contigs 4,030 55,139 29,198 88,367
Total number of unspliced ESTs in contigs 56,752 190,583 140,091 387,426
Number of unspliced ESTs per contig (median) 4 2 2
Spliced EST singlets 1,053 6,205 6,631 13,889
Unspliced EST singlets 3,539 121,091 71,662 196,292
Total non-redundant EST clusters (contigs + singlets) 24,863 190,448 117,635 332,946
Total ESTs 3,677,988 480,720 459,433 4,618,141
comm
en
t
re
v
ie
w
s
re
ports
refer
e
e
d
re
sear
ch
de
p
o
si
te
d r
e
se
a
rch
interacti
o
ns
inf
o
rmation
Most RefSeq genes have intronic transcription
Overall, we found that at least 11,679 RefSeq genes, corre-sponding to 74% of all spliced human genes in the reference dataset, have transcriptionally active introns to which TIN or PIN EST contigs were mapped. If we were to consider TIN or PIN EST singlets, the fraction of RefSeq genes with intronic transcription would increase to 86% of all RefSeq genes.
TIN and PIN transcripts are potential alternative splicing regulators
We found that the average frequency of exon skipping for genes in the RefSeq reference dataset that show evidence of PIN transcripts is 0.23, and the average frequency of exon skipping for exons immediately 3' to TIN transcripts is 0.22. These frequencies are significantly (p < 0.0001) higher than the average frequency of exon skipping (0.14) in the overall set of RefSeq genes (data not shown).
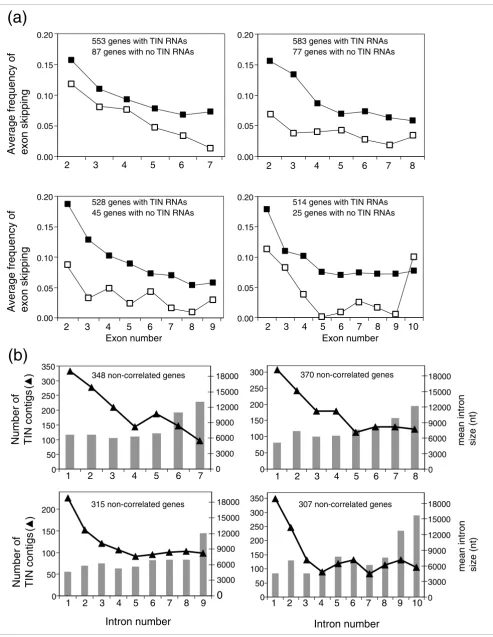
Next, we examined both the distribution of exon-skipping fre-quency across the different exons of protein-coding genes (Figure 2a) and the abundance of unspliced TIN EST contigs across the different introns of the same genes (Figure 2b). A higher frequency of exon skipping was detected closer to the
[image:5.612.57.555.89.401.2]5' ends of protein-coding genes (Figure 2a), and a concomitantly higher abundance of unspliced TIN EST con-tigs was detected in the first two introns of these genes (Fig-ure 2b). It is known that the average size of first introns is larger than that of other introns when all human genes are considered together. To determine if the higher abundance of TIN contigs in the first introns (Figure 2b) is predominantly due to the longer size of first introns, we separated the genes according to first intron sizes. To that end, we split in two the population of genes with a given number of introns; those where the size of the first intron is similar to the average size of all other introns and those where the first intron is longer than the remaining ones. We found that for the majority of genes with 6 to 12 introns, the average length of the first intron is very similar to the average length of all other introns in the same genes (for example, for genes with 7 introns the fraction is 348/553 = 0.63; Figure 2a,b). For this set of genes, one would expect a random distribution of TIN EST contigs across the different introns if TINs were transcribed by spuri-ous RNAP II transcription. In contrast, we found an uneven distribution of TIN contigs (Figure 2b), which suggests that TIN transcription may frequently be influenced by proximity to the gene promoter and might be regulated and driven by a Length distribution of exons from RefSeq genes and of partially (PIN) and totally (TIN) intronic noncoding transcripts
Figure 1
Length distribution of exons from RefSeq genes and of partially (PIN) and totally (TIN) intronic noncoding transcripts. The curves show the length distribution of three different classes of transcripts reconstructed from genomic mapping and assembly of RefSeq and ESTs from GenBank. Exons of protein-coding RefSeq (red line), TIN (black line) and PIN (blue line) contig sequences. TIN and PIN contigs resulted from assembly of all GenBank unspliced ESTs (in gold) that cluster to a given intronic region in a genomic locus, as shown in the scheme above the curves.
0
5
10
15
20
60
240
420
600
780
960
1140
1320
1500
1680
1860
2040
2220
2400
2580
2760
2940
>3001
Length
(nt)
% of total in the corresponding class
EST clustering
ESTclustering
Partially intronic
contig sequence
(median size = 719nt)
Totally intronic
contig sequence
Exons of a RefSeq gene
(median size = 141nt)
ESTs
Genomic DNA sequence
so far uncharacterized mechanism favoring the first introns. It should be noted that for another fraction of genes with any given number of introns, the first intron is longer than the other introns (for example, for genes with 7 introns the frac-tion is 168/553 = 0.30), resulting in a significant correlafrac-tion between frequency of TIN contigs and average intron length (Additional data file 2). The hypothesis is that more informa-tion is conveyed in the longer intronic regions of these partic-ular genes (see Discussion).
Design and overall performance of a gene-oriented intron-exon oligoarray platform
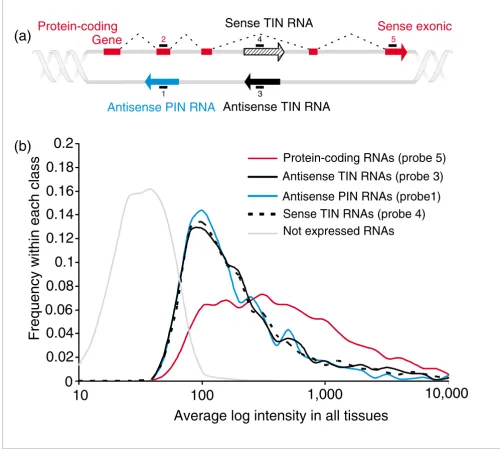
The analyses described so far have indicated the presence of active sites of totally and partially intronic transcription of noncoding messengers (TIN and PIN transcription) within protein-coding genes. Guided by this information, we designed a 44 k intron-exon oligoarray combining randomly selected protein-coding genes along with the corresponding intronic transcripts. This permitted large-scale detection of human intronic expression in a strand-specific, gene-ori-ented manner. A total of 8,780 probes from the commercially available set of Agilent 60-mer probes (Figure 3a, probe 5) were used, representing different exons in 6,954 unique ran-domly selected protein-coding genes, along with custom-designed intronic probes for the antisense or sense strand, as shown in Figure 3a. A pair of reverse complementary probes for each of 7,135 TIN transcripts (Figure 3a, probes 3 and 4) was designed, thus independently detecting sense and sense transcription in a given locus. Probes for 4,439 anti-sense PIN transcripts (Figure 3a, probe 1) were also designed. A probe representing each PIN-overlapped protein-coding exon was included (Figure 3a, probe 2).
We opted to use the 60-mer Agilent oligoarray technology to construct this custom-designed array because the probe char-acteristics and the hybridization and washing protocols in this platform have been optimized to attain reproducible results [31]. Therefore, probe design followed Agilent recom-mendations with respect to GC content and melting tempera-ture (Tm), as detailed in Materials and methods, to ensure a homogeneous and effective hybridization of fluorescent tar-gets. In fact, the reproducibility of expression in our experi-ments was fairly high, as evaluated by the correlation coefficients obtained for the two-color raw intensities within
each slide and the correlation coefficients of inter-slide com-parisons. These correlation coefficients ranged from 0.914 to 0.981 for intra-slide and from 0.915 to 0.949 for inter-slide comparisons.
Probe specificity was ensured by selecting 60-mer sequences with a homopolymeric stretch no longer than 6 bases; in addi-tion, probes should not have 8 or more bases derived from repetitive regions of the genome. The selected probes have a low probability of cross-hybridization, as estimated by a BLAST search against the sequences of all transcribed human messages using the following criteria. All probes have 100% matches to the transcript sequences they represent, which translates into a best-match BLAST score of 119. A bit-score high-end cutoff for the second-best match of each selected probe was set at 42.1, which would correspond to cross-hybridization with a maximum match of 21 bases with no gaps. This high-end cutoff level was determined from the bit-scores of the second-best hits for all the Agilent-designed commercial probes for protein-coding genes included in our platform; it is a conservative cutoff that includes 90% of the Agilent-optimized probes (Additional data file 3). Commer-cial probes with bit-score cross-hybridization matches higher than 42.1 were included because Agilent have tested each of their probes individually for absence of cross-hybridization [31]. Since we did not test individual probes, we opted to use this conservative high-end cutoff parameter for the intronic probes.
Negative controls in the oligoarray (1,198 Agilent commercial control probes, see Materials and methods) included sequences from adenovirus E1A transcripts, synthetically generated mRNAs, Arabidopsis genes and control probes designed not to hybridize to targets because of secondary structure. The hybridization and washing stringency condi-tions optimized by Agilent ensured that the raw signal inten-sities for these negative controls (median 34.3) in our experiments were low. For each experiment, the average neg-ative control intensity plus 2 standard deviations (SD) was used as a low-limit cutoff to call the expressed and not-expressed genes.
Figure 3b shows the distribution of average intensities in the
Frequency of exon skipping and abundance of wholly intronic noncoding transcription in RefSeq genes
Figure 2 (see following page)
comm
en
t
re
v
ie
w
s
re
ports
refer
e
e
d
re
sear
ch
de
p
o
si
te
d r
e
se
a
rch
interacti
o
ns
inf
o
[image:7.612.56.549.83.720.2]rmation
Figure 2 (see legend on previous page)
(b)
(a)
Average fre
quency of
exon skipping
Exon number Exon number
0.20
0.15
0.10
0.05
0.00
0.20
0.15
0.10
0.05
0.00
0.20
0.15
0.10
0.05
0.00
0.20
0.15
0.10
0.05
0.00
2 3 4 5 6 7 8
348 non-correlated genes
0 50 100 150 200 250 300 350
0 3000 6000 9000 12000 15000 18000
Numbe
r of
TIN contigs
()
0 50 100 150 200 250 300
1 2 3 4 5 6 7 8 0
3000 6000 9000 12000 15000 18000
0 50 100 150 200
1 2 3 4 5 6 7 8 9
Intron number
0
3000 6000 9000 12000 15000 180000 50 100 150 200 250 300 350
0 3000 6000 9000 12000 15000 18000
mean intron size (nt)
553 genes with TIN RNAs 583 genes with TIN RNAs 87 genes with no TIN RNAs 77 genes with no TIN RNAs
528 genes with TIN RNAs 45 genes with no TIN RNAs
514 genes with TIN RNAs 25 genes with no TIN RNAs
Average frequency of
exon skipping
Number
of
TIN contigs
()
370 non-correlated genes
315 non-correlated genes 307 non-correlated genes
Intron number
mean intron size (nt)
1 2 3 4 5 6 7 8 9 10
1 2 3 4 5 6 7
2 3 4 5 6 7
microarray experiments for genes called not-expressed (below the low-limit cutoff) and for protein-coding, antisense or sense TIN and antisense PIN expressed transcripts. The distribution is skewed towards higher intensities for protein-coding transcripts and the median intensity is 351. The distri-bution of intensities is very similar for all types of intronic
[image:8.612.55.555.90.543.2]transcripts, and is skewed towards lower intensities when compared to that of protein-coding genes (Figure 3b). Never-theless, the median intensities (134 for antisense TIN, 126 for antisense PIN and 135 for sense TIN transcripts) were suffi-ciently above that of the negative controls to permit a consid-erable number of expressed intronic transcripts to be Design and overall performance of the 44 k gene-oriented intron-exon expression oligoarray
Figure 3
Design and overall performance of the 44 k gene-oriented intron-exon expression oligoarray. (a) Schematic view of the 44 k combined intron-exon expression oligoarray 60-mer probe design. Probe 1 is for the antisense PIN transcripts (blue arrow). Probes 3 and 4 are a pair of reverse complementary sequences designed to detect antisense or sense TIN transcripts (black and hashed black arrows, respectively) in a given locus. Sense exonic probes 2 and 5 are for the protein-coding transcripts (red block and red arrow). Note that the latter were not systematically designed for an exon near the TIN message; in most instances a distant, 3' exon of the gene has been probed instead. (b) Average signal intensity distribution for antisense TIN (solid black line), sense TIN (dashed line), antisense PIN (blue line), or sense protein-coding exonic (red line) probes. Average intensities from six different
hybridization experiments with three different human tissues, namely liver, prostate and kidney, are shown. Only probes with intensities above the average negative controls plus 2 SD were considered. The average intensity distribution for probes below this low-limit detection cutoff is shown in the curve marked as 'Not expressed RNAs' (gray line).
2 4 5
3
1
Antisense PIN RNA
Antisense TIN RNA
Sense TIN RNA
Protein-coding
Gene
Sense exonic
(a)
(b)
0
0.02
0.04
0.06
0.08
0.1
0.12
0.14
0.16
0.18
0.2
10
100
1,000
10,000
Average log intensity in all tissues
Frequency within each class
Protein-coding RNAs (probe 5)
Antisense TIN RNAs (probe 3)
comm
en
t
re
v
ie
w
s
re
ports
refer
e
e
d
re
sear
ch
de
p
o
si
te
d r
e
se
a
rch
interacti
o
ns
inf
o
rmation
detected in all tissues. Discrimination between expressed and not-expressed transcripts may be more critical for intronic messages than for protein-coding ones, and a larger fraction of false-negatives may be present in the intronic data. Our results corroborate previous tiling array measurements in chromosomes 21 and 22 that showed that ncRNAs were generally expressed at lower levels than protein-coding ones [32].
Partially and totally intronic noncoding transcripts expressed in three human tissues
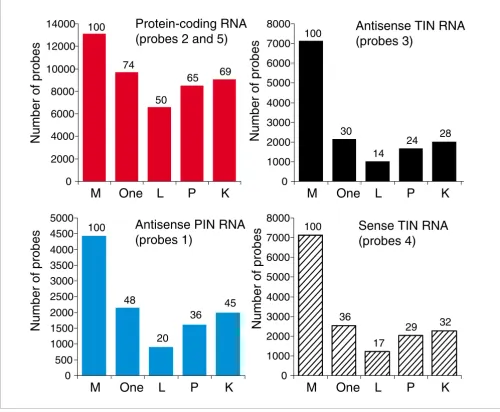
Gene expression profiles for human prostate, kidney and liver were obtained with the 44 k intron-exon oligoarrays. Arrays were hybridized with amplified Cy3- and Cy5-labeled cRNA obtained by in vitro linear amplification of poly(A)-contain-ing RNAs uspoly(A)-contain-ing T7-RNA polymerase. Figure 4 shows the number of protein-coding, TIN and PIN probes with signals greater than the negative control average plus 2 SD in at least one of the three tissues examined, and in each separate tissue. It can be seen that while 74% of protein-coding messages were expressed, only 30% of antisense TIN and 48% of anti-sense PIN transcripts were expressed in at least one tissue. A similar fraction of sense TIN transcription (36%) was observed, underscoring the natural transcription of sense intronic transcriptional units that has been observed else-where [30,33].
It can be seen that 50% to 69% of protein-coding transcripts were expressed in each individual tissue, while 14% t o 32% antisense and sense TIN and 20% to 45% antisense PIN tran-scripts were detected (Figure 4). This reveals that the abun-dance of intronic transcripts was lower than that of protein-coding messages, in terms of both the diversity of messages per tissue (Figure 4) and the relative distribution of signal intensities (Figure 3b).
The distribution along human chromosomes of the number of TIN RNA transcriptional units expressed in liver (Figure 5, gray bars) clearly agreed with the distribution computed by informatics analysis based on the entire GenBank EST data-set (Figure 5, black bars). Both distributions generally follow that of the number of RefSeq genes in each chromosome (Fig-ure 5, red bars). There are a few exceptions; for example, chromosomes 10 and 13 seem to contain a higher fraction of expressed TIN RNA transcriptional units than protein-coding RefSeq genes, and chromosomes 19 and X have lower ratios of intronic transcriptional units to protein-coding genes. Interestingly, X chromosome inactivation (XCI) depends on a single noncoding sense-antisense transcript pair, Xist and
Tsix, transcribed from a single locus on chromosome X. At the onset of XCI, Xist RNA accumulates on one of the two Xs, coating and silencing the chromosome in cis, a phenomenon controlled by a transient heterochromatic state that regulates transcription [34].
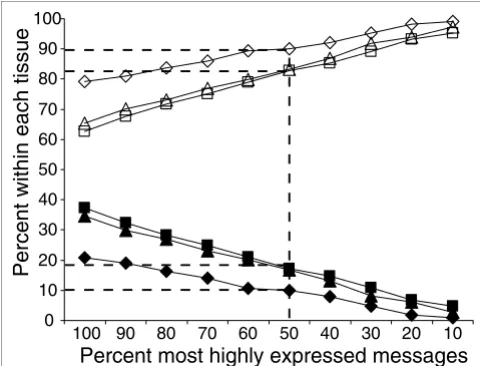
Figure 6 shows the distribution of sense and antisense TIN transcripts simultaneously expressed from the same locus as a function of the fraction of transcripts expressed in each of the three tissues. Considering only the top 10% most highly expressed sense and antisense TIN transcripts (the top 10%) in each tissue, only 1% to 5% were detected simultaneously from both strands of the same introns in protein-coding genes. Among the top 50% of intensities, over 83% to 90% of intronic transcription events are specific to one strand. Even when 100% of the expressed transcripts were considered, 63% to 79% were found to be expressed exclusively from one strand. This suggests that most of the sense and antisense messages are independent transcriptional units. It is appar-ent that the most highly expressed intronic transcripts are strand-specific, which again suggests a regulated cellular process.
Antisense TIN transcripts are enriched in introns of genes related to regulation of transcription
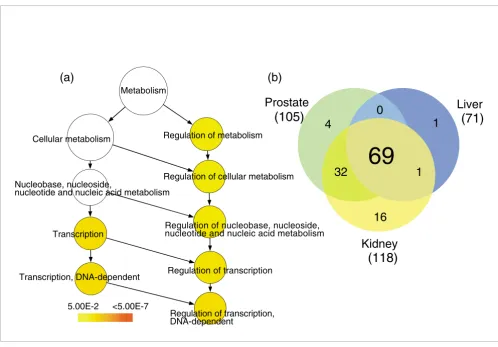
We selected the top 40% most highly expressed antisense TIN transcripts in each tissue and identified the protein-coding genes to which these transcripts map. The GO annotation of these protein-coding genes was compared with the BiNGO tool [35] to the entire list of protein-coding genes in the array that showed evidence of antisense TIN transcription. The GO category 'Regulation of transcription, DNA-dependent' (GO: 006355) was found to be significantly enriched in prostate (p
= 0.002), kidney (p = 0.002) and liver (p = 0.022). A typical GO enrichment analysis is shown for prostate in Figure 7a; similar results for kidney and liver are shown in Additional data file 4. The exact p values for all significantly enriched GO categories can be found in Additional data file 4.
Among the top 40% most highly expressed antisense TIN transcripts mapping to 678 protein-coding genes in the prostate, 105 (16%) belong to 'Regulation of transcription, DNA-dependent' (Figure 7b). Analogous results were obtained for liver and kidney, where 71 out of 409 (17%) and 118 out of 812 (15%) of the genes, respectively, belong to 'Reg-ulation of transcription, DNA-dependent'. A total of 123 unique genes related to 'Regulation of transcription' were found in common among the 40% most highly expressed antisense TIN transcripts in prostate, kidney or liver. Most of these (69 genes, 56%) were expressed in all three tissues (Fig-ure 7b), while some were shared between two tissues and a few were only expressed in one. The 'Regulation of transcrip-tion' GO category includes genes encoding various DNA-binding proteins such as transcription factors, zinc fingers and nuclear receptors. The entire list of genes identified in Figure 7b can be found in Additional data file 5. Similar analyses with the top 40% highly expressed sense TIN and antisense PIN transcripts did not identify any enriched GO category.
sig-nificantly (p < 0.05) enriched GO categories; between 10 and 15 significantly enriched categories were detected in each tis-sue, and none was related to 'Regulation of transcription' (Additional data file 6). The most significantly enriched GO categories in all three tissues include genes involved in RNA and protein biosynthesis, ribosome biosynthesis, mRNA processing and initiation of translation.
Many TIN and PIN RNAs are insensitive to RNAP II inhibition or are even up-regulated by α-amanitin
We treated human prostate cancer-derived LNCaP cells with the RNAP II inhibitor α-amanitin for 24 hours, and used the 44 k oligoarray to assess its effect on the expression of
pro-tein-coding and noncoding intronic RNA. Differentially expressed transcripts (Figure 8) were identified by combining two statistical approaches, the significance analysis of micro-array (SAM) method with a false discovery rate (FDR) <2% [36] and a signal-to-noise ratio (SNR) analysis with bootstrap permutation (p < 0.05) [37]. About 39% (3,604) of the expressed protein-coding messages were significantly affected by RNAP II inhibition, while the remaining presum-ably more stable mRNAs were not. As expected, most (96%) of the affected protein-coding messages were down-regu-lated, but 4% were up-regulated. We found that 129 protein-coding RNAs were up-regulated at least two-fold. Kravchenko
[image:10.612.57.557.91.503.2]et al. [23] found that a similar number of protein-coding Number of protein-coding, TIN and PIN transcripts expressed in three human tissues
Figure 4
Number of protein-coding, TIN and PIN transcripts expressed in three human tissues. Different types of transcripts are shown in each panel, and are color-coded as in Figure 3: protein-coding exonic (red bars), antisense TIN (black bars), antisense PIN (blue bars) or sense TIN transcripts (hashed black bars). The total number of probes present in the microarray for each type of transcript is shown with bars marked as 'M'. The number of transcripts expressed in at least one of the three tissues tested is shown with bars marked as 'One'. Transcripts exclusively expressed in each of the three tissues are shown with bars marked as 'L' for liver; 'P' for prostate; or 'K' for kidney. The percentage of expressed transcripts relative to the total number of transcripts probed in the array is indicated at the top of each bar.
100
74
50
65
69
Protein-coding RNA
(probes 2 and 5)
Antisense TIN RNA
(probes 3)
Antisense PIN RNA
(probes 1)
Sense TIN RNA
(probes 4)
0
2000
4000
6000
8000
10000
12000
14000
M
One
L
P
K
0
1000
2000
3000
4000
5000
6000
7000
8000
M
One
L
P
K
0
500
1000
1500
2000
2500
3000
3500
4000
4500
5000
M
One
L
P
K
Number of probes
0
1000
2000
3000
4000
5000
6000
7000
8000
M
One
L
P
K
100
30
14
24
28
100
48
20
36
45
100
36
17
29
32
Number of probes
Numbe
r of probes
comm
en
t
re
v
ie
w
s
re
ports
refer
e
e
d
re
sear
ch
de
p
o
si
te
d r
e
se
a
rch
interacti
o
ns
inf
o
rmation
RNAs (70 transcripts) were up-regulated two-fold or more by
α-amanitin in HeLa cells in experiments with Affymetrix oli-goarrays representing approximately 20,000 protein-coding transcripts.
Markedly fewer of the expressed TIN antisense (12%) and sense (14%) transcripts were affected by α-amanitin. Similar fractions of antisense (16%, 42/265) and sense (15%, 49/326) TIN transcripts were up-regulated in α-amanitin treated cells (Figure 8). PIN antisense transcript levels exhibited an expression pattern rather different from that of protein-cod-ing transcripts when RNAP II was inhibited: only 15% were affected, of which 12% (39/339) were up-regulated. Interest-ingly, 3 to 4 times as many TIN and PIN RNAs as protein-cod-ing messages (4%) were up-regulated by α-amanitin (Figure 8).
Intriguingly, the intronic messages (both TIN and PIN tran-scripts) with significantly increased abundance in cells with blocked RNAP II transcription were transcribed from the introns of protein-coding genes that are again enriched in the 'Regulation of transcription' GO category (p = 0.02; Figure 9). A complete list of the noncoding intronic and protein-coding
transcripts that were up-regulated upon exposure to α -aman-itin and the exact p values for all significantly enriched GO categories are shown in Additional data file 7.
We consider that the stringent criteria used, combining two statistical methods to identify the differentially expressed transcripts, may be conservative. Therefore, the proportion of intronic messages that are up-regulated following α-amanitin treatment may be even greater than those reported here. In any case, the number of intronic ncRNAs insensitive to inhi-bition, or up-regulated upon α-amanitin treatment, is likely to be in the thousands when extrapolated to all the intronic transcripts found in human cells. Considering only the 55,139 wholly intronic EST clusters, over a thousand are predicted to be up-regulated if at least 13% are affected by 24 hours of RNAP II inhibition.
Tissue signatures of TIN and PIN expression
[image:11.612.57.553.84.403.2]Tissue-specific signatures of intronic expression were deter-mined for prostate tumor, normal kidney and normal liver. A total of 419 antisense TIN (Figure 10a), 567 sense TIN (Figure 10b) and 431 antisense PIN (Figure 10c) transcripts were identified, using a combination of two statistical approaches Genomic distribution of intronic RNAs
Figure 5
Genomic distribution of intronic RNAs. Relative chromosome sizes (blue bars) and the fractional number of GenBank Refseq genes (red bars) mapped per chromosome are shown. The distribution along the chromosomes of wholly intronic sequence contigs resulting from mapping and assembly of all ESTs in GenBank relative to the RefSeq reference dataset is shown (black bars). The distribution along the chromosomes of intronic RNAs expressed in human liver, as detected by oligoarray hybridizations, is shown as gray ears. The numbers on the y-axis refer to the fractional distribution in each chromosome.
0
0.02
0.04
0.06
0.08
0.1
0.12
Chromosome number
Fractional distribution
Chromosome size
Number of GenBank RefSeq genes
Number of GenBank TIN RNAs
Number of expressed TIN RNAs
(see Materials and methods for details). A complete list of the intronic transcripts identified in tissue signatures, and the corresponding spliced protein-coding genes mapping to the same genomic loci, is provided in Additional data files 8-10. These tissue signatures comprise hundreds of different transcripts (Figure 10a-c) mapping to introns of genes with diverse functions, and no particular GO category enrichment could be detected.
A tissue signature containing 2,809 protein-coding tran-scripts was also identified (Figure 10d). Analysis of GO enrichment (not shown) revealed that in liver the protein-coding tissue signature is enriched in GO categories related to urea cycle (GO: 006594), cysteine metabolism (GO: 006534), cholesterol biosynthesis (GO: 008203) and prostaglandin metabolism (GO: 006693), while in kidney it is enriched in the GO categories related to sodium and potassium ion transport (GO: 006834 and GO: 006813, respectively). In the prostate, no relevant GO categories were enriched, but pros-tate-specific genes such as KLK3 and TMEPAI were found. We searched for co-regulated intronic and protein-coding pairs of messages that were simultaneously expressed from the same genomic locus in the same tissue, in order to identify noncoding RNAs potentially involved in modulating gene expression in a cis-acting manner. For this purpose, we initially cross-referenced the tissue signature of antisense PIN RNAs (Figure 10c) with the protein-coding signature
(Figure 10d) to determine whether both signatures contained PIN-overlapped exons of the protein-coding gene transcribed from the opposite strand in the same genomic locus (Figure 3, probe 2). Considering all three tissues, we found 64 gene loci in which antisense PIN RNAs and PIN RNA-overlapped protein-coding exon pairs were simultaneously detected in both tissue signatures (Figure 11). The tissue expression pat-terns of PIN RNA and PIN RNA-overlapped exon pairs were similar in a subset of 49 loci (Additional data file 11; Figure 11a, left and central panels). Interestingly, the 3' exon of the protein-coding transcript in this subset (Figure 11a, right panel) follows the same pattern. This is the predominant pat-tern in the tissue signature. Conceivably, the similar relative levels of antisense PIN RNA and protein-coding exons indicate that the intronic RNA has a functional role in modu-lating the transcription or transcript stability of the corre-sponding protein-coding gene. Alternatively, the levels of antisense PIN RNA and protein-coding message in each tis-sue may be similar because a common factor simultaneously modulates the transcription of both types of message from the same locus.
In a smaller subset of nine loci, the 3' exon of the protein-cod-ing transcript (Figure 11b, right panel) does not follow the pattern of tissue expression of the PIN RNA and the corre-sponding PIN-overlapped exon of the protein-coding gene (Additional data file 11; Figure 11b, left and central panels). In addition, the PIN RNA (Additional data file 11; Figure 11c, left panel) in six loci has an inverted expression pattern relative to that of the PIN RNA-overlapped exon (Figure 11c, central panel). In some tissues, there is an inverted pattern in the relative levels of PIN-overlapped exon and the 3' exon of the protein-coding gene for these two sets (Figure 11b,c, central and right panels), suggesting that the protein-coding message is alternatively spliced in a tissue-dependent manner. The similar levels of PIN RNAs and PIN-overlapped exons in Fig-ure 11b (central and right panels) suggest that, in these cases, the PIN RNA may be involved in exon retention of the pro-tein-coding gene, whereas the inverted pattern observed in Figure 11c (central and right panels) suggests that the PIN RNA may favor skipping of the overlapped exon. The effect of intronic RNAs on splicing has been documented in a recent report, where overexpression of a naturally occurring anti-sense PIN RNA (Saf transcript) mapping to the first intron of
Fas caused the retention of an alternative Fas exon that was complementary to the antisense PIN transcript [17].
An analogous cross-reference of tissue signatures from intronic and protein-coding messages (Figure 10d) was per-formed using the antisense and sense TIN RNA tissue signatures (Figures 10a,b). Among the three tissues, we com-piled 140 gene loci in which pairs of antisense or sense TIN RNAs and the 3' protein-coding exon were simultaneously detected in the tissue signatures (Figure 12). A similar tissue expression pattern of antisense TIN RNA and the 3' protein-coding exon pair was detected in a subset of 38 loci (Addi-Sense-antisense TIN transcript pairs simultaneously detected at different
[image:12.612.57.297.87.270.2]ranges of signal intensities for each of three different tissues
Figure 6
Sense-antisense TIN transcript pairs simultaneously detected at different ranges of signal intensities for each of three different tissues. The percentages of TIN transcript pairs simultaneously transcribed from the same genomic locus in both the sense and antisense orientations (full symbols), and detected at different ranges of signal intensities, are shown for each of three different tissues: liver (diamonds), prostate (triangles) and kidney (squares). The percentages of TIN messages transcribed in each tissue from only one of the two DNA strands (sense or antisense) are shown as open symbols.
0 10 20 30 40 50 60 70 80 90 100
100 90 80 70 60 50 40 30 20 10
Percent most highly expressed messages
Percent within each t
comm
en
t
re
v
ie
w
s
re
ports
refer
e
e
d
re
sear
ch
de
p
o
si
te
d r
e
se
a
rch
interacti
o
ns
inf
o
rmation
tional data file 12; Figure 12a). For 16 pairs of antisense TIN/ 3' exon an inverted expression pattern was observed (Figure 12b). Similar direct or inverted expression patterns were found for 64 (direct) or 22 (inverted) pairs when sense TIN and 3' protein-coding exons from the same locus were cross-referenced (Figure 12c,d, respectively). The slightly higher proportion (64/86 = 0.74) of directly correlated sense TIN/3' exon pairs compared to antisense TIN/3' exon pairs (38/54 = 0.70) may have resulted from internal priming of intronic segments of premature mRNAs containing stretches of poly(A) during cRNA amplification when the target was being prepared. As for co-regulated PIN RNAs, the correlated expression of TIN RNAs and the 3' exons of protein-coding transcripts may suggest that these noncoding RNAs have a role in modulating the transcription rate or the stability of the corresponding protein-coding RNA.
Discussion
Long intronic unspliced transcripts in humans
[image:13.612.54.552.82.428.2]In this work we have evaluated the contribution of introns in the human genome to the production of noncoding RNAs by gathering data on expressed intronic sequences from public databases, and in parallel by measuring expression with com-bined intron-exon oligoarrays. We focused on the unspliced messages that map totally (TIN) or partially (PIN) to intronic regions and found that most of the genes defined by RefSeq sequences (74%) undergo intronic transcription. This frac-tion is likely to prove even greater since intronic expression has not yet been assessed in different developmental stages and physiological conditions. While some of the unspliced intronic ESTs (mapping to the sense strand) may represent hitherto-overlooked exons of alternatively spliced forms of known genes, a significant number of the sense and antisense transcripts in this dataset is likely to derive from novel inde-pendent transcriptional units. This is supported by the low Most highly expressed TIN transcripts map to genes related to regulation of transcription
Figure 7
Most highly expressed TIN transcripts map to genes related to regulation of transcription. TIN RNA expression data from three different human tissues (prostate, liver and kidney) were used to select the protein-coding genes to which the top 40% most highly expressed TIN transcripts map. The BiNGO program was used to identify significantly (p ≤ 0.05) enriched GO terms within the set of selected protein-coding genes. (a) GO-enriched categories for prostate are shown in color, which is related to the p value as indicated by the color-code bar. The exact p values for all significantly enriched GO categories are shown in Additional data file 4. GO category 'Regulation of transcription, DNA-dependent' (GO:006355) is the most significantly enriched (p = 0.002). Similar results were obtained for liver and kidney (see Additional data file 4). (b) Venn diagram for the 123 unique protein-coding genes belonging to GO:006355 category 'Regulation of transcription, DNA-dependent'. The number of genes in each tissue for which intronic transcription was detected is shown in parenthesis; the numbers of coincident and dissimilar genes among kidney, prostate and liver are shown in the circles.
(a)
Pr
(105)
5.00E-2 <5.00E-7
(b)
Liver
(71)
Kidney
(118)
4
1
0
69
16
32
1
Regulation of cellular metabolism
Transcription Nucleobase, nucleoside,
nucleotide and nucleic acid metabolism
Regulation of transcription
Regulation of nucleobase, nucleoside, nucleotide and nucleic acid metabolism Cellular metabolism Regulation of metabolism
Metabolism
Regulation of transcription, DNA-dependent
Transcription, DNA-dependent
protein-coding potential and long length of the TIN and PIN EST contig sequences (medians of 573 nt and 719 nt, respectively), well above the typical lengths of exons of pro-tein-coding genes (median 141 nt).
The median length of the 55,000 TIN RNAs identified in all chromosomes in our analysis is in line with the lengths observed in previous reports by RACE analysis of non-anno-tated transcripts from 10 human chromosomes (average length 680 nt, range 173 to 4,650 [38]). Almost none of the TIN EST sequences (0.2%) matched known snoRNAs or microRNAs. Nevertheless, it remains possible that some long TIN messages are precursors of yet-undiscovered small RNAs.
We found no correlation between intron size and the abun-dance of mapped TIN unspliced EST contigs for most of the genes (approximately 60%) that showed evidence of intronic transcription, suggesting that most intronic transcription does not occur by chance. In addition, the consistent correla-tion between approximately 30% of TIN contigs and intron length might support the 'genomic design' hypothesis [39,40], in the sense that transcription of the longer introns in tissue and development-specific genes could carry regula-tory information [39,40]. In effect, we see a more abundant
expression of intronic antisense messages in genes with regu-latory functions (see discussion below).
[image:14.612.58.557.87.341.2]We have shown that long TIN RNAs were correlated to the degree of malignancy in prostate cancer [19]. To investigate if there is a preferential contribution of ESTs from tumor librar-ies to the set of TINs identified in this work, we compiled the information regarding normal or neoplastic tissue origin that is documented in the Cancer Genome Anatomy Project (CGAP) database [41], and assigned it to the set of five million ESTs analyzed in this work. We found that 43% and 57% of the 5 million ESTs are derived from tumor or normal librar-ies, respectively. Interestingly, we found that the same distribution (43% and 57%) was present in the set of 190,583 ESTs included in the TIN contig dataset. Therefore, there is no biased contribution from tumor EST libraries to the TIN dataset. Moreover, we found that 49% of the 55,139 TIN con-tigs contained at least one EST from a tumor library, suggest-ing that TIN transcription is equally present in normal and tumor tissues. These results corroborate the notion that TIN transcription is not an exclusive feature of neoplastic tissues, but rather part of the normal transcriptional output of the cells that may be partially dysfunctional in cancer disease. Effect of RNAP II inhibitor α-amanitin on the abundance of protein-coding, antisense TIN, sense TIN and antisense PIN RNAs
Figure 8
Effect of RNAP II inhibitor α-amanitin on the abundance of protein-coding, antisense TIN, sense TIN and antisense PIN RNAs. Lines on each panel represent various transcripts for which the expression levels differed significantly between α-amanitin-treated prostate cells and untreated control cells. Each sample replica is shown in one column. Transcripts were selected by a SAM two-class test (FDR <0.2% to 2%) combined with a signal-to-noise test (p
≤ 0.05). For each line, expression intensities were normalized between the two conditions and colored as a function of the number of standard deviations from the mean value; (a) 3,604 significantly affected protein-coding transcripts; (b) 265 significantly affected antisense TIN transcripts; (c) 326 significantly affected sense TIN transcripts; (d) 339 significantly affected antisense PIN transcripts.
3,604 Protein-coding RNAs 265 AntisenseTIN RNAs 326 Sense TIN RNAs 339 Antisense PIN RNAs
Mock
α
-amanitin
Mock
α
-amanitin
Mock
α
-amanitin
Mock
α
-amanitin
st. dev. fr om mean
2
-2
comm
en
t
re
v
ie
w
s
re
ports
refer
e
e
d
re
sear
ch
de
p
o
si
te
d r
e
se
a
rch
interacti
o
ns
inf
o
rmation
Intronic transcripts may stabilize protein-coding transcripts or regulate their alternative splicing
Most of the PIN and TIN RNAs selected in the tissue-specific signatures have the same tissue expression patterns as the corresponding protein-coding genes. This might indicate that transcription of some PIN and TIN RNAs is linked to a cis -acting stabilization of the corresponding protein-coding tran-script [42-44]. Intronic trantran-scripts may also act in trans, for example, by controlling regional chromatin architecture as demonstrated for some specific long ncRNAs [34,45,46]. Overexpression of complete introns in the CFTR gene affects the expression of a large number of protein-coding messages in trans, many of them related to CFTR function [47].
[image:15.612.56.556.86.477.2]A few PIN RNAs selected in the tissue-specific signatures showed tissue expression patterns that correlated with the corresponding protein-coding exon overlapped by the PIN transcript. However, the expression pattern of an exon closer to the 3' end of the same protein-coding gene was not corre-lated, suggesting that alternatively spliced isoforms of the protein-coding transcripts were tissue-specific. Splicing is known to be modulated by the binding of intronic splicing enhancer (ISE) and silencer (ISS) elements to regulatory fac-tors, favoring or blocking spliceosome formation [48]. Some PIN RNAs might regulate the skipping or retention of exons by interacting either with splice signals or with ISE and ISS elements in pre-mRNAs. In fact, there are examples of control of exon skipping by artificially introduced oligonucleotides in human cells [49], and some promising therapeutic strategies Genes with increased intronic transcription in the presence of the RNAP II inhibitor α-amanitin are enriched in the 'Regulation of transcription' GO category
Figure 9
Genes with increased intronic transcription in the presence of the RNAP II inhibitor α-amanitin are enriched in the 'Regulation of transcription' GO category. Gene ontology analysis was performed on protein-coding genes that were shown in the experiment illustrated in Figure 8 to have up-regulated expression of antisense PIN transcripts and sense and antisense TIN transcripts upon exposure to α-amanitin. Significantly (p ≤ 0.05) enriched GO terms are shown in color, which is related to the p value as indicated by the color-code bar. The exact p values for all significantly enriched GO categories are shown in Additional data file 7.
Regulation of cellular metabolism
Cellular metabolism
Metabolism
Regulation of metabolism
Transcription
Nucleobase, nucleoside, nucleotide
and nucleic acid metabolism
Regulation of transcription
Regulation of nucleobase, nucleoside,
nucleotide and nucleic acid metabolism
Regulation of transcription,
DNA-dependent
Transcription, DNA-dependent
rely on antisense oligonucleotides that modulate exon-skip-ping [50]. As for exon retention, a recent report has identified a long antisense noncoding transcript named Saf, which maps as a partially intronic transcript to the first intron of
Fas, a gene encoding an apoptotic protein [17]. Overexpres-sion of Saf in Jurkat cells induced the expression of different alternatively spliced Fas isoforms, in which an alternative exon overlapped by Saf was retained and non-adjacent 3' exons were skipped, indicating that cis-acting antisense intronic RNAs have a regulatory function [17].
Our present microarray analysis is conservative, in that we only selected transcripts that had correlated patterns of intronic and protein-coding messages and were also simulta-neously present in tissue-signatures. A more direct experi-mental approach, for example, over-expressing or suppressing specific PIN transcripts and measuring their effect on the splicing pattern of the overlapped exons, might reveal novel candidates for antisense RNA regulators of exon usage that possibly contribute to a ubiquitous and under-appreciated mechanism of alternative splicing regulation.
Alternative splicing affects more than 70% of human protein-coding genes [51], in which exon skipping is the most frequent event [52]. We found in silico evidence that cis-acting intronic transcription influences alternative splicing, that is, a higher incidence of noncoding transcription in the first introns along with higher skipping frequency of the first exons in the pro-tein-coding genes. In addition, the frequency of skipping for exons close to or overlapped by intronic transcripts was sig-nificantly higher than the average frequency of exon skipping in the overall set of human genes. In fact, exon skipping can be artificially induced by introducing antisense oligonucle-otides that map to intron/exon junctions [49,50] or to wholly intronic regions [48].
The higher incidence of transcription in the first intron, closer to the gene promoter, might have other functional implications, such as the impairment of transcription by tran-scriptional interference [53,54], regulation of gene promoter usage [55], or regulation of the initiation of RNAP II tran-scription [15]. In the latter case, ncRNAs are known to func-tion as co-activators; protein-binding ncRNAs are expected to provide a broad and diverse way of controlling mRNA transcription [15,56]. We speculate that a high fraction of the intronic transcripts, especially the sense TIN RNAs, may act in trans, being parts of multi-component RNA-protein
com-plexes that regulate gene expression. There are thousands of potential RNA regulators, which may effectively amplify the complexity of a human genome with a limited number of protein-coding genes [11,57] through RNA-RNA, RNA-DNA, or RNA-protein interactions.
Biogenesis of TIN and PIN transcripts
We evaluated the contribution of RNAP II to the biosynthesis of intronic ncRNAs in human cells by blocking its activity with α-amanitin and measuring the levels of protein-coding and noncoding intronic messages. Remarkably, a considera-ble fraction (12% to 16%) of the wholly intronic or partially intronic antisense transcripts was up-regulated, a fraction 3-to 4-fold higher than that observed for protein-coding mes-sages (4%). In addition, fewer intronic (12% to 15%) than pro-tein-coding (39%) transcripts were sensitive to RNAP II inhibition. Importantly, the sense TIN RNAs responded quite similarly to antisense TIN RNAs with respect to RNAP II inhi-bition, suggesting that these ncRNAs share similar properties that are different from protein-coding messages. The refrac-tory behavior of intronic transcript expression after α -aman-itin treatment, and the apparent up-regulation of many intronic transcripts, suggests that a different transcriptional system may be involved in the biosynthesis of these long wholly intronic ncRNAs. A reasonable candidate is spRNAP IV, which is activated by α-amanitin [23], though the mecha-nism involved remains elusive. Further experimentation is warranted to verify this hypothesis.
Advantages of a gene-oriented combined intron/exon expression array platform
Experimental analysis using genome tiling arrays has permit-ted unbiased probing of transcribed regions in the human genome [32,33,38,58,59]. Probing chromosomes 21 and 22 revealed 5.3 kb of novel transcribed sequences within or over-lapping the intronic regions of well-characterized genes, of which 2.7 kb (51%) are antisense to the protein-coding genes [32]. Tiling arrays of the whole human genome have extended these analyses, detecting messages in liver that map to 1,529 and 1,566 novel intronic transcriptionally active regions (TARs) arising, respectively, from the antisense or the sense strands of the corresponding gene [30]. Genome tiling arrays for 10 human chromosomes revealed interlaced networks of both poly A+ and poly A- annotated transcripts and unanno-tated transcripts of unknown function [38]. It has become apparent that introns as well as intergenic regions constitute major sources of non-protein-coding RNAs [44], and tiling
Expression signature of intronic and protein-coding transcripts in human liver, prostate and kidney
Figure 10 (see following page)
comm
en
t
re
v
ie
w
s
re
ports
refer
e
e
d
re
sear
ch
de
p
o
si
te
d r
e
se
a
rch
interacti
o
ns
inf
o
[image:17.612.54.558.76.713.2]rmation
Figure 10 (see legend on previous page)
(a)
(b)
(c)
419 Antisense TIN RNAs
567 Sense TIN RNAs
431 Antisense PIN RNAs
Prostate Kidney
Liver
Prostate Kidney
Liver
Prostate Kidney
Liver
Prostate Kidney
Liver
(d)
2,809 Protein -coding RNAs
2 st. dev. from mean