S O F T W A R E
Open Access
Quake: quality-aware detection and correction of
sequencing errors
David R Kelley
1*, Michael C Schatz
2, Steven L Salzberg
1Abstract
We introduce Quake, a program to detect and correct errors in DNA sequencing reads. Using a maximum likeli-hood approach incorporating quality values and nucleotide specific miscall rates, Quake achieves the highest accu-racy on realistically simulated reads. We further demonstrate substantial improvements inde novoassembly and SNP detection after using Quake. Quake can be used for any size project, including more than one billion human reads, and is freely available as open source software from http://www.cbcb.umd.edu/software/quake.
Rationale
Massively parallel DNA sequencing has become a promi-nent tool in biological research [1,2]. The high-through-put and low cost of second-generation sequencing technologies has allowed researchers to address an ever-larger set of biological and biomedical problems. For example, the 1000 Genomes Project is using sequencing to discover all common variations in the human genome [3]. The Genome 10K Project plans to sequence and assemble the genomes of 10,000 vertebrate species [4]. Sequencing is now being applied to a wide variety of tumor samples in an effort to identify mutations asso-ciated with cancer [5,6]. Common to all of these projects is the paramount need to accurately sequence the sample DNA.
DNA sequence reads from Illumina sequencers, one of the most successful of the second-generation technolo-gies, range from 35 to 125 bp in length. Although sequence fidelity is high, the primary errors are substitu-tion errors, at rates of 0.5-2.5% (as we show in our experiments), with errors rising in frequency at the 3’ ends of reads. Sequencing errors complicate analysis, which normally requires that reads be aligned to each other (for genome assembly) or to a reference genome (for detection of mutations). Mistakes during the overlap computation in genome assembly are costly: missed over-laps may leave gaps in the assembly, while false overover-laps
may create ambiguous paths or improperly connect remote regions of the genome [7]. In genome re-sequen-cing projects, reads are aligned to a reference genome, usually allowing for a fixed number of mismatches due to either SNPs or sequencing errors [8]. In most cases, the reference genome and the genome being newly sequenced will differ, sometimes substantially. Variable regions are more difficult to align because mismatches from both polymorphisms and sequencing errors occur, but if errors can be eliminated, more reads will align and the sensitivity for variant detection will improve.
Fortunately, the low cost of second-generation sequen-cing makes it possible to obtain highly redundant coverage of a genome, which can be used to correct sequencing errors in the reads before assembly or alignment. Various methods have been proposed to use this redundancy for error correction; for example, the EULER assembler [9] counts the number of appearances of each oligonucleotide of sizek(hereafter referred to ask-mers) in the reads. For sufficiently largek, almost all single-base errors alter
k-mers overlapping the error to versions that do not exist in the genome. Therefore,k-mers with low coverage, parti-cularly those occurring just once or twice, usually repre-sent sequencing errors. For the purpose of our discussion, we will refer to high coveragek-mers astrusted, because they are highly likely to occur in the genome, and low cov-eragek-mers asuntrusted. Based on this principle, we can identify reads containing untrustedk-mers and either cor-rect them so that allk-mers are trusted or simply discard them. The latest instance of EULER determines a coverage cutoff to separate low and high coveragek-mers using a mixture model of Poisson (low) and Gaussian (high) * Correspondence: [email protected]
1Center for Bioinformatics and Computational Biology, Institute for Advanced Computer Studies, and Department of Computer Science, University of Maryland, College Park, MD 20742, USA
Full list of author information is available at the end of the article
distributions, and corrects reads with low coveragek-mers by making nucleotide edits to the read that reduce the number of low coveragek-mers until allk-mers in the read have high coverage [10]. A number of related meth-ods have been proposed to perform this error correction step, all guided by the goal of finding the minimum num-ber of single base edits (edit distance) to the read that make allk-mers trusted [11-14].
In addition, a few alternative approaches to error correc-tion should be mencorrec-tioned. Past methods intended for San-ger sequencing involve multiple sequence alignments of reads rendering them infeasible for short read datasets [15-17]. More recently, a generalized suffix tree of the reads was shown to be an effective data structure for detecting and correcting errors in short reads [18,19]. De Bruijn graph-based short read assemblers [10,11,13,20,21] perform substantial error correction of reads in the de Bruijn graph. For example, short dead end paths are indi-cative of a sequencing error at the end of a read and can be removed, and‘bubbles’where a low coverage path briefly diverges from and then reconnects to high coverage nodes are indicative of sequencing errors at the middle of a read and can be merged. Finally, a number of methods have been proposed to cluster reads and implicitly correct sequencing errors in data where the targets vary in abun-dance such as sequencing of small RNAs or 16 s rRNA [22-25].
Although methods that search for the correct read based on minimizing edit distance will mostly make the proper corrections, edit distance is an incomplete mea-sure of relatedness. First, each position in a sequencing read is assigned a quality value, which defines the prob-ability that the basecall represents the true base. Though questions have been raised about the degree to which quality values exactly define the probability of error [26], newer methods for assigning them to base calls demon-strate substantial improvements [27-31], and for our pur-pose of error correction, the quality values can be useful even if they only rank one base as more likely to be an error as another. We should prefer to edit a read at these lower quality bases where errors are more likely, but edit distance treats all bases the same regardless of quality. Furthermore, specifics of the Illumina technology cause certain miscalls to be more likely than others. For exam-ple, bases are called by analysis of fluorescent output from base-incorporating chemical reactions, and A and C share a red detection laser while G and T share a green detection laser. Thus, A and C are more likely to be mis-taken for each other than for G or T [26]. Edit distance treats all error substitutions as equally likely.
In this paper, we introduce a new algorithm called Quake to correct substitution errors in sets of DNA sequencing reads produced as part of >15× coverage sequencing projects, which has become commonplace
thanks to the efficiency of second-generation sequencing technologies. Quake uses thek-mer coverage framework, but incorporates quality values and rates of specific mis-calls computed from each sequencing project. In addi-tion, Quake incorporates a new method to choose an appropriate coverage cutoff between trusted k-mers (those that are truly part of the genome) and erroneous
k-mers based on weighting k-mer counts in the reads using the quality values assigned to each base. On simu-lated data using quality values from real reads, Quake is more accurate than previous methods, especially with relatively long Illumina reads. Correcting reads guided by edit distance alone, without the use of quality values, results in many more improperly corrected reads. These reads are then chimeric, containing sequence from two distinct areas of the genome, which can be a major pro-blem for assembly software.
Finally, we explore the impact of error correction with Quake on two important bioinformatics applications -de novoassembly and detection of variations with respect to a reference genome. Even a sophisticated assembler such as Velvet [20], which performs its own error correction using the assembly graph, benefits from pre-processing the reads with Quake. SOAPdenovo [13], a parallel assembler capable of assembling mammalian-size data-sets, also produces better assemblies after error correc-tion. For variant detection, correcting errors before mapping reads to a reference genome results in more reads aligned to SNP locations and more SNPs discov-ered. Note that Quake and other correction methods that rely on coverage ofk-mers are inappropriate for applica-tions where low coverage does not necessary implicate a sequencing error such as metagenomics, RNA-Seq, and ChIP-Seq.
Quake is freely available as open source software from our website [32] under the Perl Artistic License [33].
Results and discussion Accuracy
the reference genome, using the quality values from an actual Illumina sequencing read, and changing the nucleotides according to the probabilities defined by those quality values. Dohmet al. measured the bias in Illumina specific nucleotide to nucleotide miscall rates by sequencing reads fromHelicobacter acinonychisandBeta vulgaris, aligning them to high quality reference gen-omes, and counting the number of each type of mis-match in the alignments [26]. At simulated errors, we changed the nucleotide according to these frequencies.
To compare Quake’s accuracy to that of previous error correction programs, we corrected the reads using EULER [10], Shrec [18], and SOAPdenovo [13] on a four core 2.4 GHz AMD Opteron machine. Quake and the other k-mer based correction tools used k = 15. SOAPdenovo’s error correction module does not con-tain a method to choose the cutoff between trusted and untrustedk-mers, so we tried a few appropriate values and report the best results. We similarly tried multiple values for Shrec’s strictness parameter that is used to help differentiate true and error reads via coverage. These are very sensitive parameters, and leaving them to the user is a critical limitation of these programs. Alter-natively, EULER and Quake determine their parameters automatically using the data.
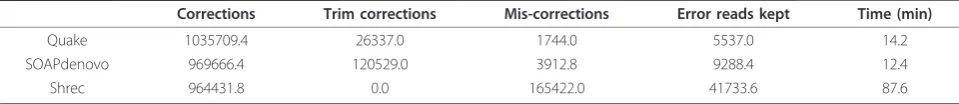
Table 1 displays the average of the accuracy statistics after five iterations of simulated 36 bp reads to 40× cov-erage (5.5 M reads) from E. coli 536 [GenBank: NC_008253]. Quality value templates were taken from the sequencing ofE. coliK12 substrain MG1655 [SRA: SRX000429]. The datasets contained an average of 1.17 M reads with errors. Of the reads that Quake tried to correct, 99.83% were corrected accurately to the true sequence. Quake properly corrected 88.3% (90.5% including trims) of error reads, which was 6.9% more reads than the second best program SOAPdenovo, made 2.3× fewer mis-corrections than SOAPdenovo, and allowed 1.8× fewer reads with errors. The 5265.4 error reads that Quake keeps have errors that only affect a few k-mers (at the end of the read), and thesek-mers happen to exist elsewhere in the genome. We could not successfully run EULER on these short reads.
We performed the same test using five iterations on 40× coverage (1.6 M reads) of 124 bp reads fromE. coli 536. Most of these reads had very low quality suffixes
expected to contain many errors. Quake handled these reads seamlessly, but the other programs produced very poor results. Thus, we first trimmed every readr to the length
l t q
x i x i
r
= −
=
∑
arg max
| |
(1)
By settingt= 3, we mainly trim nucleotides with qual-ity value 2 off the ends of the reads, but will trim past a higher quality base call if there are a sufficient number of nucleotides with quality≤2 preceding it. On this data (where full results are displayed in Table 2), Quake is 99.9% accurate on reads that it tries to correct. Of the 297 K error reads, Quake corrected 95.6% (97.9% including trims), 2.5% more than SOAPdenovo, the sec-ond most effective program. However, SOAPdenovo makes many more mistakes on the longer reads by mis-correcting 28.9× more reads and keeping 11.9× more reads with errors in the set. Shrec and EULER correct far fewer reads and mis-correct more reads than Quake.
To demonstrate Quake’s ability to scale to larger gen-omes, we simulated 325 million 124 bp reads from the 249 Mbp human chromosome 1 (version hg19), which provided 34× coverage after trimming. Due to the larger size of the sequencing target, we counted and corrected 18-mers in the reads. Of the 15.23 M reads containing errors, Quake corrected 12.83 M (84.2%) and trimmed to a correct prefix another 0.82 M (5.4%). Because we could not successfully run SOAPdenovo using 18-mers, we corrected using 17-mers, a reasonable choice given that the authors of that software chose to correct reads using 17-mers for the entire human genome [13]. Quake corrected 11% more reads than SOAPdenovo, reduced mis-corrections by 64%, and kept 15% fewer error reads. EULER produced very poor correction results, for example, correcting less than half as many reads as Quake with more mis-corrections and error reads kept. On a dataset this large, Shrec required more memory than our largest computer (256 GB).
[image:3.595.58.538.653.705.2]Relative to the 124 bp simulated reads from E. coli, Quake’s attempted corrections were accurate at a lower rate (99.02%) and Quake kept more error reads in the dataset (1.11 M, 7.27%). This is caused by the fact that
Table 1 Simulated 36 bp E. coli
Corrections Trim corrections Mis-corrections Error reads kept Time (min)
Quake 1035709.4 26337.0 1744.0 5537.0 14.2
SOAPdenovo 969666.4 120529.0 3912.8 9288.4 12.4
Shrec 964431.8 0.0 165422.0 41733.6 87.6
the human genome contains far more repetitive ele-ments than E. coli, such as the LINE and SINE retro-transposon families [35]. The more repetitive the genome is, the greater the chance is that a sequencing error will merely change one trustedk-mer to another trusted k-mer, hiding the error. To quantify this prop-erty of the two genomes, we computed the percentage of all possible single base mutations to k-mers in each genome which create k-mers that also exist in the gen-ome. In E. coli 536, this is true for 2.25% of 15-mer mutations, and in chromosome 1 of the human genome, it is true for 13.8% of 18-mer mutations. Increasing the
k-mer size does little to alleviate the problem as still 11.1% of 19-mer mutations are problematic. Neverthe-less, allowing a small percentage of error reads may not be terribly problematic for most applications. For exam-ple, genome assemblers will notice the lower coverage on the paths created by these reads and clean them out of the assembly graph.
Genome assembly
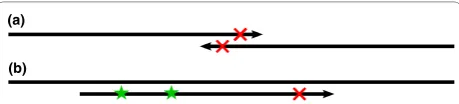
Inde novogenome assembly, the goal is to build contig-uous and unambigcontig-uous sequences called contigs from overlapping reads. The traditional formulation of the assembly problem involves first finding all overlaps between reads [36], taking care to find all true overlaps between reads sequenced from the same genome loca-tion and avoid false overlaps between reads sequenced from remote regions [7]. Because of sequencing errors, we must allow mismatches in the overlap alignments to find all true overlaps, but we cannot allow too many or false overlaps will be found and fragment the assembly. With short reads, we must allow a short minimum over-lap length, but in the presence of sequencing errors, particularly when these errors tend to occur at the ends of the reads, we may frequently overlook true overlaps (see Figure 1). A de Bruijn graph formulation of the assembly problem has become very popular for short reads [10,11,13,20], but is very sensitive to sequencing errors. A substantial portion of the work performed by these programs goes towards recognizing and correcting errors in the graph.
Having established the accuracy of Quake for error correction on simulated data, we measured the impact of Quake on genome assembly by assembling the reads
before and after error correction. One assembly is better than another if it is more connected and more accu-rately represents the sequenced genome. To measure connectedness, we counted the number of contigs and scaffolds in the assembly larger than 50 bp as well as the N50 and N90 for each, which is the contig/scaffold size for which 50% (90%) of the genome is contained in contigs/scaffolds of equal or larger size. Fewer contigs/ scaffolds and larger N50 and N90 values signify that the reads have been more effectively merged into large genomic sequences. In addition, we counted the number of reads included in the assembly because greater cover-age generally leads to better accuracy in consensus call-ing. When a reference genome was available, we used it to validate the correctness of the assembly. We aligned all scaffolds to the reference using MUMmer [37] and considered scaffolds that did not align for their entire length (ignoring 35 bp on each end) at >95% identity to be mis-assembled. We also counted the number of sin-gle base differences between the reference and otherwise properly assembled scaffolds. Finally, we computed the percentage of reference nucleotides covered by some aligning scaffold.
[image:4.595.56.538.102.163.2]Velvet is a widely used de Bruijn graph-based assem-bler that performs error correction by identifying graph motifs that signify sequencing errors [20], but does not use a stand-alone error correction module like EULER [10] or SOAPdenovo [13]. Thus, we hypothesized that Quake would help Velvet produce better assemblies. To test this hypothesis, we corrected and assembled 152× Table 2 Simulated 124 bp E. coli
Corrections Trim corrections Mis-corrections Error reads kept Time (min)
Quake 283769.4 6581.2 243.0 393.6 11.8
SOAPdenovo 276770.4 2942.6 7019.4 5490.2 16.9
Shrec 165942.7 0.0 33140.3 96626.7 97.1
EULER 228316.4 16577.4 3763.0 414.8 6.9
SimulatedE. coli124 bp reads at 40× coverage averaged over five runs. Column descriptions are the same as Table 1. Quake corrects more reads while mis-correcting far fewer reads and keeping fewer reads with errors than all programs.
(a)
(b)
[image:4.595.307.537.572.624.2](20.8 M reads) coverage of 36 bp reads from E. coliK12 substrain MG1655 [SRA:SRX000429]. We used Velvet’s option for automatic computation of expected coverage and chose the de Bruijn graphk-mer size that resulted in the best assembly based on the connectedness and correctness statistics discussed above.
Table 3 displays the assembly statistics forE. coliwith Velvet. Quake corrected 2.44 M (11.7%) and removed 0.57 M (2.8%) reads from the dataset. After correction, 0.75 M (3.8%) more reads were included in the assem-bly, which contained 13% fewer contigs and 13% fewer scaffolds. Though this significant increase in connected-ness of the assembly does not manifest in the N50 values, which are similar for both assemblies, the contig N90 increases by 47% and the scaffold N90 increases by 11%. With respect to correctness, the corrected read assembly contained one fewer mis-assembled scaffold and 31% fewer mis-called bases, and still covered slightly more of the reference genome. This improvement was consistent in experiments holding out reads for lesser coverage of the genome (data not shown). As the cover-age decreases, the distributions of error and truek-mers blend together and the choice of cutoff must carefully balance making corrections and removing useful reads from low coverage regions. On this dataset, the mini-mum coverage at which the assembly improved after correction using Quake was 16×.
We also measured Quake’s impact on a larger assembly with longer reads by assembling 353.7 M Illumina reads, all of them 124 bp in length, from the alfalfa leafcutting beeMegachile rotundata, with an estimated genome size of 300 Mbp. (Contact the corresponding author for details on data access.) Assembly was performed with SOAPdenovo [13] using a de Bruijn graphk-mer size of 31 and the‘-R’option to resolve small repeats. Assembly
of the raw uncorrected reads was quite poor because of the very low quality suffixes of many of the 124 bp reads. Thus, we compare assembly of quality trimmed reads (performed as described above), reads corrected using Quake, and trimmed reads corrected with SOAPdenovo’s own error correction module. Quake and SOAPdenovo corrected using 18-mers and a coverage cutoff of 1.0.
Correcting errors in the reads had a significant affect on the quality of the assembly as seen in Table 4. In the Quake assembly, >123 K fewer contigs were returned as contig N50 grew by 71% and contig N90 more than doubled compared to the standard approach of only trimming the reads before assembly. Similarly to the simulated reads, Quake is able to correct more reads than SOAPdenovo, which leads to 1.5% more reads included in the assembly than SOAPdenovo and slightly more than the assembly of uncorrected reads. Improve-ments to the connectedness statistics compared to SOAPdenovo were modest. Surprisingly, although nearly 2.5× fewer scaffolds were returned after error correction with Quake, scaffold N50 remained virtually the same and N90 slightly decreased. We investigated a few possi-ble explanations for this with inconclusive results; for example, scaffold sizes did not improve substantially after adding back mate pairs 8 excluded due to uncor-rectable errors. Because N50 and N90 can be somewhat volatile and the scaffolds in the E. coli assembly above did improve after error correction, this is potentially an artifact of this particular dataset, that is the library sizes used with respect to the repeat structure of the genome.
SNP detection
[image:5.595.56.541.101.139.2]A second application of short reads that benefits from error correction is detection of variations, such as single nucleotide polymorphisms (SNPs). In such experiments, Table 3 Velvet E. coli assembly
Contigs N50 N90 Scaffolds N50 N90 Breaks Miscalls Cov
Uncorrected 398 94,827 17,503 380 95,365 23,869 5 456 0.9990
Corrected 345 94,831 25,757 332 95,369 26,561 4 315 0.9992
[image:5.595.56.544.644.696.2]Velvet assemblies ofE. coli36 bp paired end reads at 152× coverage. After correcting the reads, more reads are included in the assembly into fewer contigs and scaffolds. N50 and N90 values were computed using the genome size 4,639,675 bp. The N50 value was similar for both assemblies, but N90 grew significantly with corrected reads. Correcting the reads also improved the correctness of the assembly producing fewer mis-assembled scaffolds (Breaks) and miscalled bases (Miscalls) and covering a greater percentage of the reference genome (Cov).
Table 4 SOAPdenovo bee assembly
Assembly Trimmed Only Corrected Removed Contigs N50 N90 Scaffolds N50 N90 Reads Uncorrected Corrected 146.0 M - 12.9 M 312,414 2,383 198 90,201 37,138 9,960 167.3 M SOAPdenovo Corrected 134.4 M 15.7 M 15.6 M 188,480 4,051 515 36,525 36,525 9,162 164.8 M Quake 146.9 M 16.5 M 13.0 M 189,621 4,076 514 37,279 37,014 9,255 167.3 M
the genome from which the reads are sequenced differs from a reference genome to which the reads are com-pared. The first step is to align the reads to the refer-ence genome using specialized methods [8] that will only allow a few mismatches between the read and reference, such as up to two mismatches in a recent study [38]. A read containing a SNP will start with one mismatch already, and any additional differences from the reference due to sequencing errors will make align-ment difficult (see Figure 1). Furthermore, the distribu-tion of SNPs in a genome is not uniform and clusters of SNPs tend to appear [39]. Reads from such regions may contain multiple SNPs. If these reads contain any sequencing errors, they will not align causing the highly polymorphic region to be overlooked.
To explore the benefit that error correction with Quake may have on SNP detection, we randomly sampled reads representing 35× from theE. coliK12 reads used above. To call SNPs, we aligned the reads to a related reference genome (E. coli 536[GenBank: NC_008253]) with Bowtie [40] using two different modes. We first mapped reads allowing up to two mismatches to resemble the SNP call-ing pipeline in a recent, large study [38]. We also mapped reads using Bowtie’s default mode, which allows mis-matches between the reference and read until the sum of the quality values at those mismatches exceeds 70 [40]. We called SNPs using the SAMtools pileup program [41], requiring a Phred-style base call quality≥40 and a coverage of≥3 aligned reads. Having a reliable reference genome for both strains ofE. coliallowed us to compare the SNPs detected using the reads to SNPs detected by performing a whole genome alignment. To call SNPs using the reference genomes, we used the MUMmer uti-litydnadiff which aligns the genomes with MUMmer, identifies the optimal alignment for each region, and enu-merates SNPs in aligning regions [37]. We treat these SNPs as the gold standard (though there may be some false positives in improperly aligned regions) in order to compute recall and precision statistics for the read-based SNP calls.
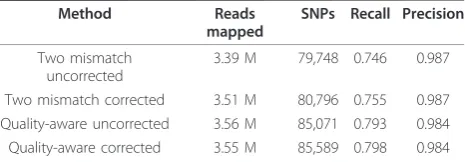
In the first experiment, 128 K additional reads of 4.12 M aligned after correcting with Quake, of which 110 K (85.8%) aligned to SNPs, demonstrating the major bene-fit of error correction before SNP calling. As seen in Table 5 with these reads mapped, we discovered more SNPs and recall increased at the same level of precision. Supporting the hypothesis that many of these newly dis-covered SNPs would exist in SNP-dense regions, we found that 62% of the new SNPs were within 10 bp of another SNP, compared to 38% for the entire set of SNPs. On the uncorrected reads, Bowtie’s quality-aware alignment policy mapped 165 K (4.9%) more reads than a two mismatch policy. Similarly, many of these new alignments contained SNPs, which led to more SNPs
discovered, increasing recall with only a slight drop in precision. Using the quality-aware policy, slightly fewer reads mapped to the reference after error correction because some reads that could not be corrected and were removed could still be aligned. However, 33.7 K new read alignments of corrected reads were found, which allowed the discovery of 518 additional SNPs at the same level of precision. Thus, error correction of the reads using Quake leads to the discovery of more true SNPs using two different alignment policies.
In order to demonstrate the ability of Quake to scale to larger datasets and benefit re-sequencing studies of humans, we corrected 1.7 billion reads from a Korean individual [SRA:SRA008175] [42]. This set includes 1.2 B 36 bp reads and 504 M 75 bp reads. Quake corrected 206 M (11.9%) of these reads, trimmed an additional 75.3 M (4.4%), and removed 344 M (19.9%). Before and after error correction, we aligned the reads to the human genome (NCBI build 37) and called SNPs with Bowtie allowing two mismatches and SAMtools as described above (though requiring the diploid genotype to have quality ≥40 implicitly requires coverage ≥4). Because some putative SNPs had read coverage indica-tive of a repeat, we filtered out locations with read cov-erage greater than three times the median covcov-erage of 19, leaving 3,024,283 SNPs based on the uncorrected reads. After error correction, we found 3,083,481 SNPs, an increase of 2.0%. The mean coverage of these SNPs was 20.1 reads, an increase of 4.8% over the coverage of these locations in the alignments of uncorrected reads, which should provide greater accuracy. Thus, Quake helps detect more SNPs in larger diploid genomes as well.
Data quality
[image:6.595.306.539.100.181.2]Our experiences correcting errors in these datasets allowed us to assess the quality of the sequencing data used in a number of interesting ways. First, as has pre-viously been established, nucleotide-specific error rates in Illumina sequencing reads are not uniform [26]. For Table 5 E. coli SNP calling
Method Reads mapped
SNPs Recall Precision
Two mismatch uncorrected
3.39 M 79,748 0.746 0.987
Two mismatch corrected 3.51 M 80,796 0.755 0.987 Quality-aware uncorrected 3.56 M 85,071 0.793 0.984 Quality-aware corrected 3.55 M 85,589 0.798 0.984
example, adenines were miscalled far more often as cytosine than thymine or guanine inMegachile rotun-data(see Figure 2). As exemplified in the figure, error rates also differ significantly by quality value. While mis-calls at adenines were highly likely to be cytosines at low quality, errors were closer to uniform at high quality positions in the read. Finally, error rates varied from lane to lane within a sequencing project. For example, the multinomial samples of nucleotide to nucleotide miscall rates for every pair of six lanes from the Mega-chile rotundatasequencing reads differed with unques-tionably significant P-values using two sample chi square tests.
As sequencing becomes more prevalent in biological research, researchers will want to examine and compare the quality of an instance (single lane, machine run, or whole project) of data generation. Error correction with Quake provides two simple measures of data quality in the number of reads corrected and the number of reads removed. Furthermore, Quake allows the user to search for biases in the data like those described above using bundled analysis scripts on the log of all corrections made. Thus, researchers can detect and characterize problems and biases in their data before downstream analyzes are performed.
Conclusions
The low cost and high throughput of second-generation sequencing technologies are changing the face of gen-ome research. Despite the many advantages of the new technology, sequencing errors can easily confound ana-lyzes by introducing false polymorphisms and fragment-ing genome assemblies. The Quake system detects and corrects sequencing errors by using the redundancy inherent in the sequence data. Our results show that Quake corrects more reads more accurately than pre-vious methods, which in turn leads to more effective downstream analyzes.
One way Quake improves over prior corrections methods is by q-mer counting, which uses the quality values assigned to each base as a means of weighting eachk-mer. The coverage distributions of error and true
k-mers cannot be separated perfectly according to their number of appearances due to high coverage errors and low coverage genomic regions. Yet, the choice of a cut-off to determine which k-mers will be trusted in the correction stage can have a significant affect on down-stream applications like genome assembly.
Weighting k-mer appearances by quality puts more distance between the two distributions because erro-neous k-mers generally have lower quality than true
k-mers. Furthermore, with q-mers, the cutoff value separating the two distributions no longer needs to be an integer. For example, at low coverage we might use 0.95 as a cutoff, such that k-mers that appear once with high quality bases would be trusted, but those with lower quality would not. Such fine-grained cutoff selec-tion is impossible with simplek-mer counting.
Quake includes a sophisticated model of sequencing errors that allows the correction search to examine sets of corrections in order of decreasing likelihood, thus cor-recting the read more accurately. The model also helps to better identify reads with multiple sets of equally good corrections, which allows the system to avoid mis-correcting and creating a chimeric read. At a minimum, quality values should be included in error correction as a guide to the likely locations of sequencing errors. In each dataset we examined, the rates at which each nucleotide was mis-called to other nucleotides were not uniform and often varied according to quality. Adjusting for these rates provides further improvements in error correction, and distinguishes our method.
We expect Quake will be useful to researchers inter-ested in a number of downstream applications. Correct-ing reads with Quake improves genome assembly by producing larger and more accurate contigs and scaf-folds using the assemblers Velvet [20] and SOAPdenovo [13]. Error correction removes many of the false paths in the assembly graphs caused by errors and helps the Instances 0
4000
10000
0 5 10 15 20 25 30 35
0.0
0.2
0.4
0.6
0.8
1.0
Quality
Probability
Observed Regressed
[image:7.595.56.292.396.632.2]C G T
Figure 2 Adenine error rate. The observed error rate and predicted error rate after nonparametric regression are plotted for adenine by quality value for a single lane of Illumina sequencing of
assembler to detect overlaps between reads that would have been missed. Eliminating erroneous k-mers also significantly reduces the size of the assembly graph, which for large genomes may be the difference between being able to store the graph in a computer’s memory or not [13]. In a re-sequencing application, correcting reads with Quake allows Bowtie [40] to align many more reads to locations in the reference genome where there is one or more SNPs. Reads containing variants already have differences from the reference genome; correcting additional differences caused by sequencing errors makes these reads easier to align and then avail-able as input for the SNP calling program. Finally, Quake offers a unique perspective into the quality of the data from a sequencing experiment. The proportion of reads corrected, trimmed, and removed are useful statis-tics with which experiments can be compared and data quality can be monitored. The output log of corrections can be mined for troubling biases.
On microbial sized genomes, error correction with Quake is fast and unobtrusive for the researcher. On lar-ger datasets, such as a human re-sequencing, it is compu-tationally expensive and requires substantial resources. For the Korean individual reads, we countedk-mers on a 20-core computer cluster running Hadoop [43], which required from two to three days. For error correction, the data structure used to store trustedk-mers requires 4k bits, which is 32 GB for human ifk= 19. Thus, the cor-rection stage of Quake is best run on a large shared memory machine, where correction is parallelized across multiple threads using OpenMP [44]. Running on 16 cores, this took a few days for the Korean individual data-set. Future work will explore alternative ways to perform this step that would require less memory. This way cor-rection could be parallelized across a larger computer cluster and made more accessible to researchers without a large shared memory machine.
k-mer based error correction programs are affected significantly by the cutoff separating true and error
k-mers. Improvements in k-mer classification, such as theq-mer counting introduced by Quake, improve the accuracy of error correction. Coverage biases in second-generation sequencing technologies, which are largely inexplicable outside of the affect of local GC content, add to the difficulty [26]. Further characterization of these biases would allow better modeling ofk-mer cov-erage and better classification ofk-mers as true or error. In more repetitive genomes, the probability increases that ak-mer that is an artifact of an error actually does occur in the genome. Such k-mers are not really mis-classified, but may cause Quake to ignore a sequencing error. To improve error correction in these cases, the local context of thek-mer in the sequencing reads must be taken into account. Though this was done for Sanger
read error correction [15-17], it is not currently compu-tationally and algorithmically feasible for high through-put datasets containing many more reads.
Quake’s model for sequencing errors takes into account substantial information about which types of substitution errors are more likely. We considered using Quake to re-estimate the probability of a sequencing error at each quality value before using the quality values for correction. Doing so is difficult because Quake detects many reads that have errors for which it cannot find a valid set of corrections and pinpoint the errors’ locations. If Quake re-estimated quality value error probabilities without considering these reads, the error probabilities would be underestimated. Addition-ally, the benefit of re-estimation is minimal because quality values are mainly used to determine the order in which sets of corrections are considered. Alternatively, passing on more information from the base calling stage, such as the probability that each individual nucleotide is the correct one, would be very helpful. Quake’s error model could be made more specific, the need to learn nucleotide specific error rates would be alleviated, and more accurate error correction could be expected.
Methods
Quake detects and corrects errors in sequencing reads by usingk-mer coverage to differentiate k-mers trusted to be in the genome and k-mers that are untrustworthy artifacts of sequencing errors. For reads with untrusted
k-mers, Quake uses the pattern of trusted and untrusted
k-mers to localize the errors and searches for the set of corrections with maximum likelihood that make all
k-mers trusted. The likelihood of a set of corrections to a read is defined by a probabilistic model of sequencing errors incorporating the read’s quality values as well as the rates at which nucleotides are miscalled as different nucleotides. Correction proceeds by examining changes to the read in order of decreasing likelihood until a set of changes making all k-mers trusted is discovered and found to be sufficiently unambiguous.
Countingk-mers
such that the probability that a randomly selectedk-mer
from the space of 4
2
k
(for oddk considering reverse
complements as equivalent) possiblek-mers occurs in a random sequence of nucleotides the size of the sequenced genome Gis ~0.01. That, is we want ksuch that
2
4 0 01
G
k . (2)
which simplifies to
klog4200G (3)
For an approximately 5 Mbp such asE. coli, we setk
to 15, and for the approximately 3 Gbp human genome, we set kto 19 (rounding down for computational rea-sons). For the human genome, counting all 19-mers in the reads is not a trivial task, requiring >100 GB of RAM to store the k-mers and counts, many of which are artifacts of sequencing errors. Instead of executing this computation on a single large memory machine, we harnessed the power of many small memory machines working in parallel on different batches of reads. We execute the analysis using Hadoop [43] to monitor the workflow, and also to sum together the partial counts computed on individual machines using an extension of the MapReduce word counting algorithm [45]. The Hadoop cluster used in these experiments contains 10 nodes, each with a dual core 3.2 gigahertz Intel Xeon processors, 4 GB of RAM, and 367 GB local disk (20 cores, 40 GB RAM, 3.6 TB local disk total).
In order to better differentiate truek-mers and error
k-mers, we incorporate the quality values into k-mer counting. The number of appearances of low coverage truek-mers and high copy errork-mers may be similar, but we expect the error k-mers to have lower quality base calls. Rather than increment ak-mer’s coverage by one for every occurrence, we increment it by the pro-duct of the probabilities that the base calls in thek-mer are correct as defined by the quality values. We refer to this process as q-mer counting.q-mer counts approxi-mate the expected coverage of a k-mer over the error distribution specified by the read’s quality values. By counting q-mers, we are able to better differentiate between truek-mers that were sequenced to low cover-age and errork-mers that occurred multiple times due to bias or repetitive sequence.
Coverage cutoff
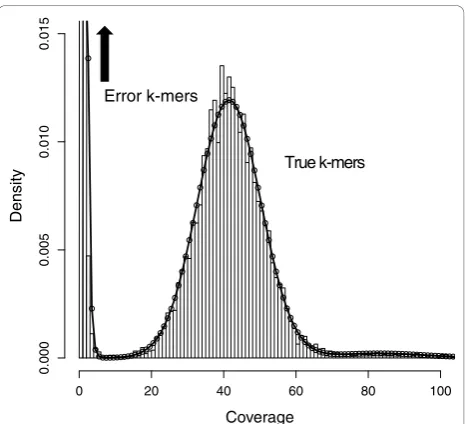
A histogram of q-mer counts shows a mixture of two distributions - the coverage of truek-mers, and the cov-erage of error k-mers (see Figure 3). Inevitably, these
distributions will mix and the cutoff at which true and errork-mers are differentiated must be chosen carefully [46]. By defining these two distributions, we can calcu-late the ratio of likelihoods that ak-mer at a given cov-erage came from one distribution or the other. Then the cutoff can be set to correspond to a likelihood ratio that suits the application of the sequencing. For instance, mistaking low coverage k-mers for errors will remove true sequence, fragmenting ade novogenome assembly and potentially creating mis-assemblies at repeats. To avoid this, we can set the cutoff to a point where the ratio of errork-mers to truek-mers is high, for example 1,000:1.
In theory, the truek-mer coverage distribution should be Poisson, but Illumina sequencing has biases that add variance [26]. Instead, we model truek-mer coverage as Gaussian to allow a free parameter for the variance.
k-mers that occur multiple times in the genome due to repetitive sequence and duplications also complicate the distribution. We found thatk-mer copy number in var-ious genomes has a ‘heavy tail’(meaning the tail of the distribution is not exponentially bounded) that is
Coverage
D
ens
ity
0 20 40 60 80 100
0.000
0.005
0.010
0.015
[image:9.595.306.540.87.299.2]True k-mers Error k-mers
Figure 3 k-mer coverage. 15-mer coverage model fit to 76× coverage of 36 bp reads fromE. coli. Note that the expected coverage of ak-mer in the genome using reads of lengthLwill be
L k L
− +1 times the expected coverage of a single nucleotide
approximated well by the Zeta distribution [47], which has a single shape parameter. Our full model for truek -mer coverage is to sample a copy number from a Zeta distribution, and then sample a coverage from a Gaus-sian distribution with mean and variance proportional to the chosen copy number.
The errork-mer coverage distribution has been pre-viously modeled as Poisson [10]. In data we examined, this distribution also has a heavy tail, which could plausi-bly be explained if certain sequence motifs were more prone to errors than others due to sequence composition or other variables of the sequencing process. Addition-ally, by countingq-mers, we have real values rather than the integers that Poisson models. We examined a few options and chose the Gamma distribution with free shape and scale parameters to model errorq-mer counts.
Finally, we include a mixture parameter to determine which of the two distributions ak-mer coverage will be sampled from. We fit the parameters of this mixture model by maximizing the likelihood function over theq -mer counts using the BFGS algorithm, implemented as theoptimfunction in the statistical language R [48]. Fig-ure 3 shows an example fit to 76× coverage ofE. coli. Using the optimized model, we compute the likelihood ratio of errork-mer to truek-mer at various coverages and set the cutoff to correspond to the appropriate ratio.
Localizing errors
Once a cutoff to separate trusted and untrustedk-mers has been chosen, all reads containing an untrusted
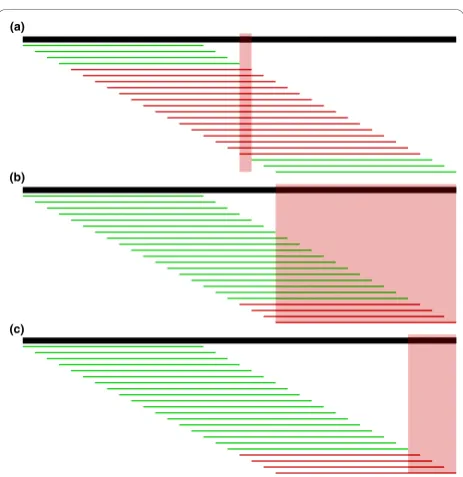
k-mer become candidates for correction. In most cases the pattern of untrustedk-mers will localize the sequen-cing error to a small region. For example, in Figure 4a, a single base substitution causes 15 adjacent untrusted 15-mers. To find the most likely region for the sequen-cing error(s), we take the intersection of a read’s untrustedk-mers. This method is robust to a few mis-classified errork-mers, but not to true k-mers with low coverage that are classified as untrusted. Thus, if the intersection of the untrusted k-mers is empty (which also occurs when there are multiple nearby errors) or a valid correction cannot be found, we try again localizing to the union of all untrustedk-mers.
A few more complications are worth noting. If the untrustedk-mers reach the edge of the read, there may be more sequencing errors at the edge, so we must extend the region to the edge, as in Figure 4b. In this case and in the case of multiple nearby sequencing errors, we may also benefit from considering every base covered by the right-most trustedk-mer and left-most trustedk -mer to be correct, and trimming the region as in Figure 4c. Because this heuristic is sensitive to misclassifiedk -mers, we first try to correct in the region shown in Figure 4c, but if no valid set of corrections is found, we try again
with the larger region in Figure 4b. Finally, in longer reads we often see clusters of untrustedk-mers that do not overlap. We perform this localizing procedure and correction on each of these clusters separately. Alto-gether, these heuristics for localizing the error in a read vastly decrease the runtime of the algorithm compared to considering corrections across the entire read.
Sequencing error probability model
After finding a region of the read to focus our correction efforts on, we want to search for the maximum likelihood set of corrections that makes allk-mers overlapping the region trusted. First, we must define the likelihood of a set of corrections. LetO=O1,O2,...,ONrepresent the
observed nucleotides of the read, andA=A1,A2,...,AN
the actual nucleotides of the sequenced fragment of DNA. Given the observed nucleotides we would like to evaluate the conditional probability of a potential assign-ment toA. Assuming independence of sequencing errors at nucleotide positions in the read and using Bayes theo-rem, we can write
P A a O o P O o A a P A a P O o
i i i i i i i i
i N
( | ) ( | ) ( )
( )
= = = = = =
=
=
∏
1 (4)(b)
[image:10.595.306.538.85.324.2](c) (a)
Because we compare likelihoods for a single observed read Oat a time, P(Oi=oi) is the same for all
assign-ments to Aand is ignored.P(Ai =ai) is defined by the
GC% of the genome, which we estimate by counting Gs
and Cs in the sequencing reads. Let pi
qi
= −1 10−10 be the probability that the nucleotide at positioniis accu-rate, whereqi is the corresponding quality value. Also,
let Eq(x, y) be the probability that the base call y is made for the nucleotidexat quality value qgiven that there has been a sequencing error. ThenP(Oi=oi|Ai=ai)
can be specified as
P Oi oi Ai ai pi p E a o oi ai i qi i i
( = | = )=⎧⎨⎪( − ) ( , ) = ⎩⎪
if otherwise
1 (5)
Modeling sequencing errors withEallows for biases in base substitution that are known to exist for the Illu-mina platform. For example, one study found A to C was the most frequent error, likely because A and C are detected by one laser while G and T are detected by another [26]. Making the substitution distribution con-ditional upon the quality value allows this substitution bias to vary at different qualities, which was found to occur for Sanger sequencing [49] and here for Illumina (see Figure 2). Although some work has modeled error distributions conditionally on the position of the nucleo-tide in the read [50], we assume that quality values cap-ture this sequencing cycle effect. Recent base-calling algorithms incorporate this effect on fluorescence inten-sity measurements explicitly in some way and generate quality values that satisfy our assumption [27-31].
The error matricesEare estimated from the sequencing
reads as follows. First we initially set E x yq( , )=31 ∀q x y, , and run the algorithm, counting the corrections by quality value and nucleotide to nucleotide type. During this initial pass, we only make simple, unambiguous corrections by abandoning low quality reads more aggressively and using a greater ambiguity threshold (described below). In order to reduce the variance of our estimate ofE, we perform kernel smoothing across the qualityqusing a Gaussian kernel [51] with standard deviation two. LetCq(x,y) be
the number of times actual nucleotidexwas observed as error nucleotideyat quality valueq,Cq(x) be the number
of times actual nucleotidexwas observed as an error at quality valueq, andN(q;u,s) be the probability ofqfrom a Gaussian distribution with meanuand standard devia-tions. ThenEis defined by
E x y C x y N q q
C x N q q q
q i
i
q i
i
i
i
( , ) ( , ) ( ; , )
( ) ( ; , )
=
∑
∑
2
2 (6)
Correction search
Once we can assign a likelihood to a set of corrections and localize the error(s) to a specific region of the read, we must search for the set with maximum likelihood such that all k-mers in the corrected read are trusted. We refer to a set of corrections asvalid if all resulting
k-mers are trusted. In order to limit the search space, we consider only sets of corrections for which the ratio of the likelihood of the corrected read to the original is above a fixed threshold (default 10-6).
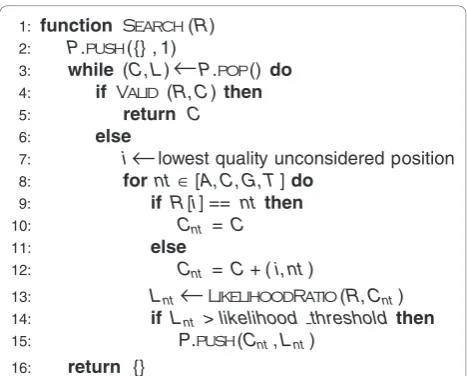
Figure 5 outlines the algorithm. To consider sets of corrections in order of decreasing likelihood, the algo-rithm maintains a heap-based priority queueP where each element contains a set of corrections Cand the ratio of their likelihood to the original read’s likelihood
L. In each iteration through the main loop, the algo-rithm pops the maximum likelihood set of correctionsC
from the queueP. If Cmakes allk-mers in the region trusted, then it returns C. Otherwise, it examines the next lowest quality read position that has not yet been considered, which we track with minor additional book-keeping. For each nucleotide substitution at this posi-tion, we compute a new likelihood and add the updated set of corrections to the priority queue if its likelihood ratio is above the threshold. If the queue empties with-out finding a valid set of corrections, we abandon the read. This procedure could alternatively be viewed as searching a tree where nodes are corrected reads and branches represent corrections (see Figure 6).
1: function Search(R)
2: P.push({} , 1)
3: while (C, L) P.pop() do
4: if Valid(R, C)then
5: return C
6: else
7: i lowest quality unconsidered position
8: for nt[A, C, G, T]do
9: if R[i] == nt then
10: Cnt = C
11: else
12: Cnt = C+ (i, nt)
13: Lnt LikelihoodRatio(R, Cnt)
14: if Lnt > likelihood threshold then
15: P.push(Cnt, Lnt)
16: return {}
k
k
[image:11.595.305.539.464.652.2]k
Figure 5 Correction search algorithm. Pseudocode for the algorithm to search for the most likely set of corrections that makes all k-mers in the read trusted.Pis a heap-based priority queue that sorts sets of correctionsCby their likelihood ratioL. The algorithm examines sets of corrections in decreasing order of their likelihood until a set is found that converts allk-mers in the read to trusted
In practice, we make a few adjustments to this proce-dure. Reads from repeats may have multiple sets of valid corrections separated by a small likelihood difference so that the true correction is ambiguous. Therefore, we actually continue past the point of finding a valid set of corrections to ensure that another valid set does not exist within a certain likelihood threshold (default 0.1). As described, the algorithm will devote a large majority of its computation effort to the lowest quality reads, which have many potential sets of corrections to con-sider. In order to balance correction sensitivity with speed, we pre-screen the error region and immediately abandon a read if its error region is filled with low qual-ity base calls. More specifically, in our experiments we found that regions containing≥13 positions with a prob-ability of error >1% were difficult or impossible to cor-rect quickly, and these reads are abandoned without further effort. For regions containing≥9 such positions, we increase the likelihood ratio threshold to 10-3so that we only consider a limited number of corrections before giving up.
In order to run Quake on very large datasets (for exam-ple, containing billions of reads), we must be able to determine very quickly whether a set of corrections makes allk-mers trusted. We accomplish this by map-ping all 4kk-mers to an index in a bit array that is set to one if thek-mer is trusted and zero otherwise. For
15-mers this bit array uses just 128 MB of space, while it requires 32 GB for 19-mers, which are needed for larger genomes. If memory usage must be reduced, a Bloom fil-ter could be used to hash the trustedk-mers in <4 GB at the expense of occasional false positive queries [12].
Abbreviations
bp: base pair; Gbp: gigabases; Mbp: megabases; SNP: single nucleotide polymorphism.
Acknowledgements
Thanks to Gene Robinson at the University of Illinois for permission to use preliminary sequence data fromMegachile rotundata. Thanks to Héctor Corrada Bravo and Darryl Reeves for helpful discussion and feedback. This work was supported by NIH grants R01-LM006845 and R01-GM083873.
Author details 1
Center for Bioinformatics and Computational Biology, Institute for Advanced Computer Studies, and Department of Computer Science, University of Maryland, College Park, MD 20742, USA.2Simons Center for Quantitative Biology, Cold Spring Harbor Laboratory, 1 Bungtown Road, Cold Spring Harbor, NY 11724, USA.
Authors’contributions
DRK conceived and implemented the method and carried out the experiments. MCS assisted with Hadoop. MCS and SLS provided helpful discussion at all stages. DRK, MCS, and SLS wrote the manuscript.
Competing interests
The authors declare that they have no competing interests.
Received: 7 September 2010 Revised: 20 October 2010 Accepted: 29 November 2010 Published: 29 November 2010
ACGGCCTATTTA ACGGCCTAATTA
ACGGCCTACTTA ACGTCCTATTTA
ACGTCCTAATTA ACGTCCTACTTA
ACGGCCTAGTTA
ACGCCCTAGTTA
ACGACCTAGTTA
ACGTCCTAGTTA
AC
C
G
ATT G
AAT G
CT
AA
ATT
Likelihood
observed read:
corrected reads:
actual read:
ACGGCCTACTTAG AC
actual read:
likelihood threshold:
[image:12.595.59.538.91.341.2]quality:
References
1. Shendure J, Ji H:Next-generation DNA sequencing.Nat Biotechnol2008, 26:1135-1145.
2. Hawkins R, Hon G, Ren B:Next-generation genomics: an integrative approach.Nat Rev Genet2010,11:476-486.
3. Siva N:1000 Genomes project.Nat Biotechnol2008,26:256.
4. Haussler D, O’Brien S, Ryder O, Barker F, Clamp M, Crawford A, Hanner R, Hanotte O, Johnson W, McGuire J, Miller W, Murphy R, Murphy W, Sheldon F, Sinervo B, Venkatesh B, Wiley E, Allendorf F, Amato G, Baker C, Bauer A, Beja-Pereira A, Bermingham E, Bernardi G, Bonvicino C, Brenner S, Burke T, Cracraft J, Diekhans M, Edwards S,et al:Genome 10K: a proposal to obtain whole-genome sequence for 10 000 vertebrate species.
J Hered2009,100:659-674.
5. Mardis E:Cancer genomics identifies determinants of tumor biology.
Genome Biol2010,11:211.
6. Robison K:Application of second-generation sequencing to cancer genomics.Brief Bioinform2010,11:524-534.
7. Palmer L, Dejori M, Bolanos R, Fasulo D:Improving de novo sequence assembly using machine learning and comparative genomics for overlap correction.BMC Bioinformatics2010,11:33.
8. Trapnell C, Salzberg S:How to map billions of short reads onto genomes.
Nat Biotechnol2009,27:455-7.
9. Pevzner P, Tang H, Waterman M:An Eulerian path approach to DNA fragment assembly.Proc Natl Acad Sci USA2001,98:9748.
10. Chaisson M, Brinza D, Pevzner P:De novo fragment assembly with short mate-paired reads: does the read length matter?Genome Res2009, 19:336.
11. Butler J, MacCallum I, Kleber M, Shlyakhter IA, Belmonte MK, Lander ES, Nusbaum C, Jaffe DB:ALLPATHS: de novo assembly of whole-genome shotgun microreads.Genome Res2008,18:810-820.
12. Shi H, Schmidt B, Liu W, Muller-Wittig W:A parallel algorithm for error correction in high-throughput short-read data on CUDA-enabled graphics hardware.J Comput Biol2010,17:603-615.
13. Li R, Zhu H, Ruan J, Qian W, Fang X, Shi Z, Li Y, Li S, Shan G, Kristiansen K, Li S, Yang H, Wang J, Wang J:De novo assembly of human genomes with massively parallel short read sequencing.Genome Res2010, 20:265-272.
14. Yang X, Dorman K, Aluru S:Reptile: representative tiling for short read error correction.Bioinformatics2010,26:2526-2533.
15. Gajer P, Schatz M, Salzberg S:Automated correction of genome sequence errors.Nucleic Acids Res2004,32:562.
16. Batzoglou S, Jaffe D, Stanley K, Butler J, Gnerre S, Mauceli E, Berger B, Mesirov J, Lander E:ARACHNE: a whole-genome shotgun assembler.
Genome Res2002,12:177.
17. Tammi MT, Arner E, Kindlund E, Andersson B:Correcting errors in shotgun sequences.Nucleic Acids Res2003,31:4663-4672.
18. Schroder J, Schroder H, Puglisi SJ, Sinha R, Schmidt B:SHREC: a short-read error correction method.Bioinformatics2009,25:2157-2163.
19. Salmela L:Correction of sequencing errors in a mixed set of reads.
Bioinformatics2010,26:1284.
20. Zerbino D, Birney E:Velvet: algorithms for de novo short read assembly using de Bruijn graphs.Genome Res2008,18:821.
21. Simpson J, Wong K, Jackman S, Schein J, Jones S, Birol I:ABySS: a parallel assembler for short read sequence data.Genome Res2009,19:1117. 22. Qu W, Hashimoto Si, Morishita S:Efficient frequency-based de novo
short-read clustering for error trimming in next-generation sequencing.
Genome Res2009,19:1309-1315.
23. Wijaya E, Frith M, Suzuki Y, Horton P:Recount: expectation maximization based error correction tool for next generation sequencing data.
Genome Inform2009,23:189-201.
24. Zagordi O, Geyrhofer L, Roth V, Beerenwinkel N:Deep sequencing of a genetically heterogeneous sample: local haplotype reconstruction and read error correction.J Comput Biol2010,17:417-428.
25. Quince C, Lanzen A, Curtis T, Davenport R, Hall N, Head I, Read L, Sloan W: Accurate determination of microbial diversity from 454 pyrosequencing data.Nat Methods2009,6:639-641.
26. Dohm JC, Lottaz C, Borodina T, Himmelbauer H:Substantial biases in ultra-short read data sets from high-throughput DNA sequencing.
Nucleic Acids Res2008,36:e105+.
27. Bravo H, Irizarry R:Model-based quality assessment and base-calling for second-generation sequencing data.Biometrics2010,66:665-674.
28. Kao W, Stevens K, Song Y:BayesCall: a model-based base-calling algorithm for high-throughput short-read sequencing.Genome Res2009, 19:1884.
29. Erlich Y, Mitra P, de la Bastide M, McCombie W, Hannon G:Alta-Cyclic: a self-optimizing base caller for next-generation sequencing.Nat Methods
2008,5:679.
30. Kircher M, Stenzel U, Kelso J:Improved base calling for the Illumina Genome Analyzer using machine learning strategies.Genome Biol2009, 10:R83.
31. Rougemont J, Amzallag A, Iseli C, Farinelli L, Xenarios I, Naef F:Probabilistic base calling of Solexa sequencing data.BMC Bioinformatics2008,9:431. 32. Quake.[http://www.cbcb.umd.edu/software/quake].
33. Perl Artistic License..[http://www.perl.com/pub/a/language/misc/Artistic. html].
34. Li H, Ruan J, Durbin R:Mapping short DNA sequencing reads and calling variants using mapping quality scores.Genome Res2008,18:1851. 35. Cordaux R, Batzer M:The impact of retrotransposons on human genome
evolution.Nat Rev Genet2009,10:691-703.
36. Myers E:Toward simplifying and accurately formulating fragment assembly.J Comput Biol1995,2:275-290.
37. Kurtz S, Phillippy A, Delcher A, Smoot M, Shumway M, Antonescu C, Salzberg S:Versatile and open software for comparing large genomes.
Genome Biol2004,5:R12.
38. Pleasance ED, Cheetham RK, Stephens PJ, McBride DJ, Humphray SJ, Greenman CD, Varela I, Lin MLL, Ordonez GR, Bignell GR, Ye K, Alipaz J, Bauer MJ, Beare D, Butler A, Carter RJ, Chen L, Cox AJ, Edkins S, Kokko-Gonzales PI, Gormley NA, Grocock RJ, Haudenschild CD, Hims MM, James T, Jia M, Kingsbury Z, Leroy C, Marshall J, Menzies A,et al:A comprehensive catalogue of somatic mutations from a human cancer genome.Nature
2010,463:191-196.
39. Kendal W:An exponential dispersion model for the distribution of human single nucleotide polymorphisms.Mol Biol Evol2003,20:579. 40. Langmead B, Trapnell C, Pop M, Salzberg S:Ultrafast and memory-efficient
alignment of short DNA sequences to the human genome.Genome Biol
2009,10:R25.
41. Li H, Handsaker B, Wysoker A, Fennell T, Ruan J, Homer N, Marth G, Abecasis G, Durbin R, Subgroup GPDP:The sequence alignment/Map format and SAMtools.Bioinformatics2009,25:2078.
42. Ahn SM, Kim TH, Lee S, Kim D, Ghang H, Kim DS, Kim BC, Kim SY, Kim WY, Kim C, Park D, Lee YS, Kim S, Reja R, Jho S, Kim CG, Cha JY, Kim KH, Lee B, Bhak J, Kim SJ:The first Korean genome sequence and analysis: full genome sequencing for a socio-ethnic group.Genome Res2009, 19:1622-1629.
43. Hadoop.[http://hadoop.apache.org].
44. Dagum L, Menon R:Open MP: an industry-standard API for shared-memory programming.IEEE Comput Sci Eng1998,5:46-55.
45. Dean J, Ghemawat S:MapReduce: simplified data processing on large clusters.Commun ACM2008,51:107-113.
46. Chin F, Leung H, Li W, Yiu S:Finding optimal threshold for correction error reads in DNA assembling.BMC Bioinformatics2009,10 Suppl 1:S15. 47. Johnson N, Kemp A, Kotz S:Univariate Discrete DistributionsNew York:
Wiley-Interscience; 2005.
48. R: A Language and Environment for Statistical Computing.[http://www. R-project.org].
49. Li M, Nordborg M, Li LM:Adjust quality scores from alignment and improve sequencing accuracy.Nucleic Acids Res2004,32:5183-5191. 50. Li R, Li Y, Fang X, Yang H, Wang J, Kristiansen K, Wang J:SNP detection for
massively parallel whole-genome resequencing.Genome Res2009, 19:1124.
51. Hastie T, Tibshirani R, Friedman J:The Elements of Statistical LearningBerlin: Springer; 2009.
doi:10.1186/gb-2010-11-11-r116