The Impact of sample scale on the compressibility
parameters of saturated fine-grained soils
TEPONDJOU NGUEDIA ROSINE LARISSA
School of Computing, Science and Engineering
University of Salford, Salford, UK
Submitted in Partial Fulfilment of the Requirements of the
Degree of Doctor of Philosophy in Civil Engineering
Table of Contents
LIST OF TABLES ...VI LIST OF FIGURES ... VIII ACKNOWLEDGEMENT ... XII AFFIRMATION ... XIII LIST OF SYMBOLS WITH THEIR UNITS ... XIV ABSTRACT ... XIX
CHAPTER 1 ... 1
INTRODUCTION ... 1
1.1 Background ... 1
1.2 Research Gap... 1
1.2.1 The coefficient of consolidation (cv) using different tests methods ... 1
1.2.2 Effect of sample diameter on the value of cv ... 3
1.2.3 Effect of sample height on the value of cv ... 3
1.2.4 Effect of sample diameter to height (D/H) scale on cv ... 4
1.2.5 Effect of initial moisture content on cv ... 4
1.2.6 Effect of sample scale on the compression index (cc) and coefficient of volume compressibility (mv) ... 5
1.3 Aims and objectives ... 6
1.3.1 Aims of research ... 6
1.3.2 Research Objectives ... 6
1.4 Research limitations ... 7
1.5 Thesis Outline ... 8
CHAPTER 2 ... 10
LITERATUREREVIEW ... 10
2.1 Overview ... 10
2.2 Basic properties of fine-grained soils fractions ... 10
2.2.1 Clay mineralogy ... 10
2.2.1.1 Kaolinite group ... 10
2.2.1.2 Illite group ... 11
2.2.1.3 Montmorillonite group ... 11
2.2.1.4 Vermiculite group ... 11
2.2.2 Clay structure ... 12
2.2.2.1 Macro-structure ... 12
2.2.2.2 Micro-structure ... 13
2.3 Soil physics related to saturated soils ... 14
2.4 Theory of consolidation ... 15
2.4.1 Terzaghi’s theory ... 16
2.4.2 Biot’s theory ... 17
2.5 Consolidation drainage theory ... 17
2.5.1 Vertical and horizontal drainage theory ... 20
2.6 Consolidation (Oedometer) test ... 21
2.6.1 Incremental Loading ... 22
2.6.2 Single Oedometer test ... 23
2.6.3 Double Oedometer test ... 23
2.7 Factors affecting data analysis ... 23
2.7.1 The effect of the coefficient of consolidation (cv) using different tests methods ... 23
2.7.2 Effect of sample diameter on the value of cv ... 26
2.7.3 Effect of sample height on the value of cv ... 27
2.7.4 Effect of Diameter to height (D/H) ratio on cv ... 28
2.7.5 Effect of initial moisture content on compressibility parameters ... 29
2.7.6 Effect of sample scale on the compression index (cc) and volume compressibility (mv) ... 31
2.8 Chapter Summary ... 33
CHAPTER 3 ... 34
EXPERIMENTALSETUP ... 34
3.1 Introduction ... 34
3.2 Characteristic of material ... 34
3.3 Experimental test programme ... 36
3.3.1 Sample preparation ... 36
3.3.1.1 One-dimensional test sample ... 37
3.3.1.2 Vane test sample ... 37
3.3.2 Loading Increments ... 38
3.3.3 Dial gauge calibration ... 39
3.3.4 Cell Calibration ... 39
3.3.5 Pressure regulator Calibration ... 40
3.3.6 Bellofram membrane calibration ... 41
3.4 Sample Scale Terminology ... 43
3.4.1 Sample scale Range Oedometer Test ... 44
3.4.1.1 Single Oedometer test ... 44
3.4.1.2 Double Oedometer test ... 45
3.5 Variability and uncertainty of data ... 46
3.6 Chapter Summary ... 47
CHAPTER 4 ... 48
EFFECTOFSAMPLESCALEONTHECOMPRESSIBILITYBEHAVIOUROF FINE-GRAINEDSOILS ... 48
4.1 Introduction ... 48
4.2 Scales at University of Salford ... 48
4.3 Statistical analysis ... 49
4.4 Results ... 50
4.4.1 Void ratio versus stress ... 50
4.4.2 Time-deformation characteristics ... 52
4.4.3 Series of single Oedometer tests ... 54
4.5 EVALUATION OF FINDINGS... 54
4.5.1 Normality and significance of the cv values using different methods ... 54
4.5.2 Effect of sample thickness on the coefficient of consolidation (cv) ... 56
4.5.3 Effect of sample diameter on the coefficient of consolidation (cv) ... 57
4.5.4 Effect of sample scale on the compression index (cc) and coefficient of volume compressibility (mv) ... 58
4.5.5 Effect of diameter to height (D/H) ratio on cv ... 59
4.5.6 Effect of initial moisture content on the compressibility parameters ... 62
4.5.7 Effect of time factor on cv with sample scale ... 64
4.6CHAPTER SUMMARY ... 66
CHAPTER 5 ... 67
NUMERICALMODELLING ... 67
5.1 Introduction ... 67
5.2 Background ... 67
5.3 Finite Difference Method ... 68
5.3.1 Theoretical application ... 70
5.3.1.1 Taylor series ... 70
5.3.1.2 Forward difference approximation ... 70
5.3.1.3 Backward difference approximation ... 71
5.3.1.4 Central difference approximation ... 71
5.3.2 Finite difference method for one-dimensional consolidation tests under loading at double drainage conditions ... 72
5.3.3 Finite difference solution ... 73
5.4 Finite Element Method ... 76
5.4.1 Basic Mohr-Coulomb model ... 77
5.4.2 Model uncertainties ... 77
5.4.2.1 Coefficient of permeability ... 78
5.4.2.2 Coefficient of consolidation ... 78
5.4.2.3 Void ratio ... 78
5.5 Chapter Summary ... 79
CHAPTER 6 ... 80
FINITEELEMENTMODELANDCOMPARISONWITHEXPERIMENTAL STUDY ... 80
6.1 Overview ... 80
6.2 Modelling Strategy ... 81
6.3 Excess pore pressure ... 84
6.4 Mesh Geometry ... 85
6.4.1 Background ... 85
6.4.2 Mesh generation ... 86
6.5 Calculation stages ... 91
6.5.1 Plastic-consolidation analysis ... 92
6.5.2 Consolidation analysis ... 95
6.5.3 Calculation error solution ... 97
6.6 Model calibration ... 99
6.7 Sample height scale ... 101
6.8 Sample D/H ratio scale ... 102
6.9 Sample diameter scale ... 104
6.9.1 Vertical drainage... 104
6.9.2 Horizontal drainage ... 105
6.9.3 Vertical and horizontal drainage... 108
6.9.4 Calculated coefficient of permeability drainage scenarios ... 110
6.10 Summary ... 114
CHAPTER 7 ... 117
DISCUSSIONOFFINDINGS ... 117
7.1 Overview: ... 117
7.2 Effect of different curve-fitting methods on cv ... 117
7.3 Effect of sample height scale on cv ... 118
7.4 Effect of sample diameter scale on cv ... 119
7.4.1 Limitation of tests ... 120
7.4.2 Vertical drainage... 121
7.4.3 Vertical and Horizontal drainage ... 122
7.5 Effect of sample D/H on cv ... 123
7.6 Effect of initial moisture content on the compressibility parameters... 124
7.7 Effect of time factor on the compressibility parameters ... 124
7.8 Summary ... 125
CHAPTER 8 ... 126
CONCLUSIONSANDRECOMMENDATIONS ... 126
8.1 Conclusions ... 126
8.2 Recommendations for Future work ... 130
REFERENCES ... 131
APPENDICES ... 150
A – COLLECTION OF FREQUENTLY USED SOIL PARAMETERS ... 151
A - 1 Moisture content ... 152
A – 2 Degree of saturation ... 152
A – 3 Void ratio ... 153
A – 4 Specific gravity and density ... 153
A – 5 Shear strength ... 154
A – 6 Atterberg Limit ... 156
A – 7 Permeability... 156
A – 8 Compressibility parameters ... 158
A – 9 Consolidation settlement ... 160
B – LABORATORY PROCEDURE TO DETERMINE THE COEFFICIENT OF CONSOLIDATION ... 162
B.1 Data Analysis ... 163
In this section, various methods to obtain cv is presented. The methods are described in reference to previous researchers. ... 163
B.1.1 Primary consolidation ... 163
B.1.1.1 Taylor’s method ... 163
B.1.1.2 Casagrande’s method ... 164
B.1.1.3 Inflection point method ... 165
B.1.1.4 Rectangular Hyperbola method ... 166
B.1.1.5 Early stage log t method ... 167
B.1.1.6 The slope method ... 168
B.1.2 Secondary consolidation ... 169
C - SOIL MINERALOGY ... 171
D – VOID RATIO CONSOLIDATION CURVES ... 174
E – TIME-DEFORMATION CHARACTERISTICS ... 188
F – FEM EXCESS PORE PRESSURE ... 202
List of Tables
Table3-1: Detail soil properties ... 35
3-2: Soil Properties summary ... 35
3-3: Mineralogy of the fine-grained soil studied ... 36
3-4: Summary of maximum pressure for each Oedometer cell ... 38
3-5: Cell measured valued ... 40
3-6: Summary of the bellofram membrane (Diaphragm) pressure calibration with the respective loading use in this study for each Oedometer cell ... 42
3-7: Sample scale ranges for single Oedometer test ran over 24hours (Diameter scale) ... 43
3-8: Sample scale ranges for single Oedometer test ran over 24hours (Height scale) ... 43
3-9: Diameter to Height ratio scale tests ... 44
3-10: Double Oedometer test ... 44
3-11: Series of consolidation testing programme at different sample scale using samples of China Clay ... 45
3-12: Series of consolidation testing programme at different sample scale - double Oedometer test on China clay ... 46
4-1: Magnitude of Pearson correlation coefficient as provided by Cohen (1988) (Laerd Statistics, 2013) ... 49
4-2: Test 3 – Effect of sample height scale on cv at 55kPa ... 54
4-3: Output of Normality and Significance of cv values obtained using Casagrande, Taylor’s and Inflection methods ... 56
5-1: Forward Central approximation pore pressure hand calculation ... 74
5-2: Central approximation pore pressure hand calculation ... 74
5-3: Calculated coefficient of permeability for D/H ratio scale ... 78
6-1: Sample Height and Diameter scale parameters for the finite element model ... 83
6-2: Sample D/H ratio scale properties used in the finite element model (Rosine and Sabbagh, 2015) ... 84
6-3: Mesh properties ... 87
6-4: Calculation error in PLAXIS using Plastic calculation phase with kc1 parameter ... 93
6-5: Calculation error using Plastic calculation phase with PLAXIS ke parameter ... 94
6-6: Calculation error using Plastic calculation phase with PLAXIS kc2 parameter ... 95
6-7: Calculation error in PLAXIS using consolidation analysis phase ... 97
6-8: Corrected error within PLAXIS ke parameter ... 99
A-1: States of saturation of soils (Wilun and Starzewski, 1975) ... 152
A-2: Summary of the undrained shear strength formulation using the Vane shear test ... 155
A-3: Undrained shear strength gained by previous researchers ... 156
A-4: Typical Atterberg limits for soils (Liu and Evett, 2005) ... 156
A-5: Ranges of the coefficient of permeability (Whitlow, 2001) ... 157
A-6: Summary of the compressibility parameters with their respective equations and units ... 158
A-7: Typical value of the compression index for fine-grained soil (Reeves et al., 2006) ... 159
A-8: Typical values for the coefficient of volume compressibility after Head (1998) in Reeves et al. (2006) ... 159
A-9: Typical values of the coefficient of consolidation (cv) after Lambe and Whitman (1979) in Reeves et al. (2006) ... 160
E-1: Test 1 and 2 – Sample diameter scale (which also corresponds to sample D/H ratio) effect on cv ... 189
E-2: Test 3 and 4 – Sample diameter scale effect (which also corresponds to sample D/H ratio) on cv ... 190
E-3: Test 5 – Sample height effect (which also corresponds to sample D/H ratio) on cv ... 191
E-4: Test 6 – Sample height scale effect (which also corresponds to sample D/H ratio) on cv ... 192
E-5: Test 1 and 2 – Sample diameter effect on the value cc and mv ... 193
E-6: Test 3 and 4 – Sample diameter effect of cc and mv ... 194
E-7: Test 5 – Sample height effect cc and mv ... 195
E-8: Test 6 – Sample height effect cc and mv ... 196
E-9: Test 17 - D/H 6.5 effect on compressibility parameters at initial moisture content 67.5% .... 197
E-10: Test 18 – D/H 6.5 effect on cv with moisture content 67.5% at 24 hours and 7 days ... 198
E-11: Test 19 – D/H 2(a) effect on cv with moisture content 65% at 24 hours ... 199
E-12: Test 20 – D/H 0.5 effect on cv with initial moisture content 91% at 24 hours and 7 days ... 200
E-13: Test 21 – D/H 2 effect on cv with different moisture content at duration of 24 hours ... 201
List of Figures
Figure2-1: Schematic diagram of clay mineral group a) kaolinite group, b) illite group, c) montmorillonite
group and d) vermiculite group (Lambe and Whitman, 1979) ... 12
2-2: Micro-structure representation of clay structures; a) Flocculated structure, b) dispersed structure and c) natural clay structure (Berry and Reid, 1987) ... 14
2-3: Fully saturated soil ... 15
2-4: Drainage condition of a soil at a) single drainage and b) double drainage (Head, 1998) ... 17
2-5: Drainage and loading conditions for consolidation in an Oedometer apparatus: a), c), e), g) with free strain loading, b), d), f), h) with equal strain loading (Head, 1998) ... 19
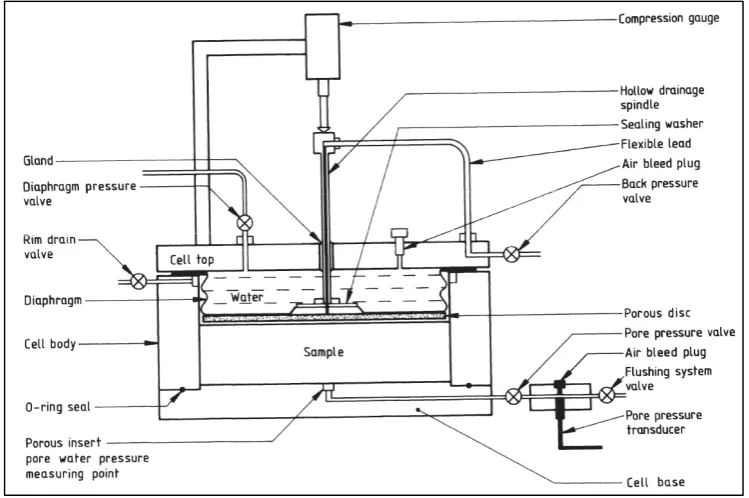
2-6: Oedometer apparatus from British Standard BS1377 Part 6 (BS, 1990) ... 21
2-7: Terzhagi’s square root time method as proposed by Feng and Lee (2001) ... 25
2-8: Distribution of pore pressure, mean vertical stress (p) and friction stress (τ) with depth in consolidation test (Sivrikaya and Togrol, 2006) ... 29
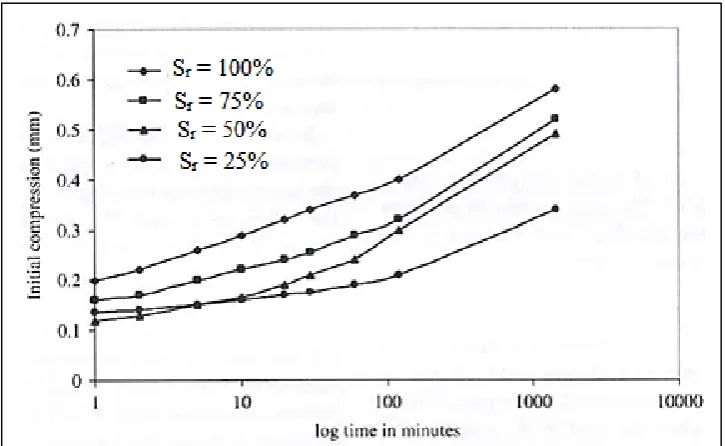
2-9: Rate of initial compression at different degree of saturation (Sr) at a pressure of 25kPa (Phanikumar and Amrutha, 2014) ... 30
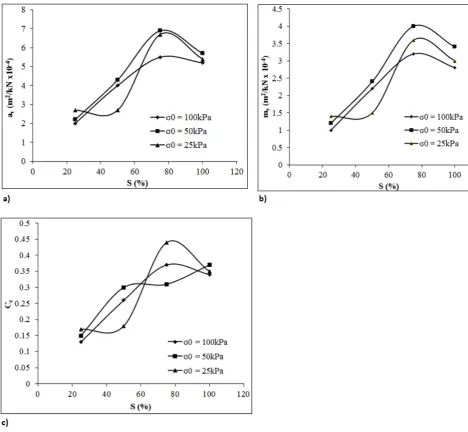
2-10: Variation in the compressibility parameters with change in degree of saturation as presented by Phanikumar and Amrutha (2014) ... 31
2-11: Variation of mv with consolidation pressure at different clay mineralogy (Retnamony and Mether, 1998) ... 32
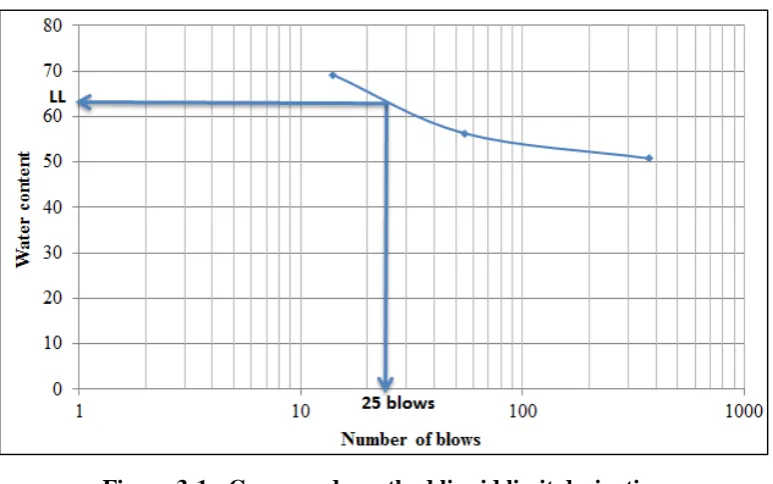
3-1: Casagrande method liquid limit derivation ... 35
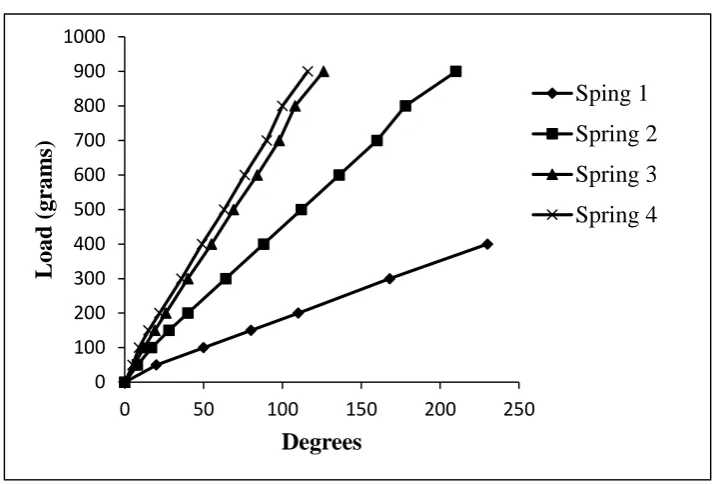
3-2: Torque spring calibration ... 38
3-3: Dial gauge calibration; a) Coventry Gauge Limited Grade 1, b) Dial indicator set at zero with 20mm Coventry Gauge limited and c) Gauge moved 7.5mm corresponding to the thickness of Coventry Gauge Limited ... 39
3-4: Relationship between actual and applied pressure at various pressure regulators ... 41
4-1: Various Oedometer cell sizes at the University of Salford ... 49
4-2: Relationship of void ratio against stress at loading 55kPa at a) Diameter scale, b) Height Scale and c) D/H ratio scale (Rosine and Sabbagh, 2015) ... 51
4-3: Casagrande method 110kPa±3.7kPa ... 52
4-4: Inflection method at 110kPa±3.7kPa ... 53
4-5: Taylor's method at 110kPa±3.7kPa ... 53
4-6: Summary of current study and previous work on the effect of soil sample thickness on the coefficient of consolidation (cv) (using Taylor’s method) ... 57
4-7: Effect of diameter scale of the coefficient of consolidation (cv) ... 58
4-8: Effect of sample scale (D/H ratio) on some compressibility parameters: a) cc and b) mv (Rosine
and Sabbagh, 2015) ... 59
4-9: Frictional stresses at various D/H ratios (Rosine and Sabbagh, 2015) ... 60
4-10: cv relationship with applied pressure obtained at a) Casagrande method, b) Taylor’s method and c) Inflection method (Rosine and Sabbagh, 2015) ... 61
4-11: Effect of moisture content on cv: a) Taylor’s method, b) Casagrande and c) Inflection method ... 63
4-12: Effect of initial moisture content on a) cc and b) mv ... 64
4-13: Effect of time factor of the coefficient of consolidation cv; a) Taylor’s method, b) Casagrande method and c) Inflection method ... 65
5-1: Element within a clay layer (Naser, 2013)... 69
5-2: Point numbering on finite difference grid (Tandjiria, 1999) ... 70
5-3: Node points used in the FDM calculations ... 74
5-4: FDM hand calculated excess pore pressure using; a) Forward central approximation and b) central approximation ... 76
6-1: PLAXIS screen shot of loading directions; a and b) negative pressure and c and d) positive pressure ... 85
6-2: Position of nodes and stress points in a soil element (PLAXIS, 2011) ... 86
6-3: Effect of mesh size on sample height scale ... 88
6-4: Effect of mesh size on sample diameter scale ... 90
6-5: Effect of mesh size on sample diameter scales (Figure 6.4 continued) ... 91
6-6: PLAXIS phases calculation ... 92
6-7: Excess pore pressure at 55kPa under D/H 0.5 estimated coefficient of permeability at; a) Plastic-Consolidation analysis and b) Plastic-Consolidation analysis ... 96
6-8: Excess pore pressure at 55kPa under D/H 1 estimated coefficient of permeability at; a) Plastic-Consolidation analysis and b) Plastic-Consolidation analysis ... 96
6-9: Excess pore pressure at 55kPa under D/H 1.2 estimated coefficient of permeability at; a) Plastic-Consolidation analysis and b) Plastic-Consolidation analysis ... 96
6-10: Comparison between experimental and numerical model at 110kPa for D/H 1 to 2(a); a, c, e) normalised FEM and b, d, f) experimental model. ... 100
6-11: Variation of excess pore pressure using external load 55kPa under sample height scale; a and c) general representation, b and d) representation without HS130D150 and c) experimental data 102 6-12: D/H ratio results compared with FEM at 55kPa; a) normalised FEM and b) experimental observation where: uo is the initial pore pressure ... 103
6-13: Variation of excess pore pressure using external load 55kPa under sample diameter scale; a) Normalised FEM model and b) experimental result where: uo is the initial pore pressure ... 105
6-14: Schematic drainage representation of the FEM for DS at horizontal drainage (case 1) (Head,
1998) ... 106
6-15: Comparison between vertical and case 1 at various sample diameter scale at 55kPa (Where: case 1 is the horizontal drainage scenario) ... 107
6-16: Comparison between vertical and case 1 at various sample diameter scales at 55kPa (Figure 6.15 continued) ... 108
6-17: Drainage representation of the FEM for DS under vertical and horizontal drainage (case 2) ... 109
6-18: Comparison between vertical, case 1 and case 2 at various sample diameter scales at 55kPa (Where: case 1 is the horizontal drainage scenario and case 2 is combined vertical and horizontal drainage) ... 109
6-19: Comparison between vertical, case 1 and case 2 at various sample diameter scales at 55kPa (Figure 6.18 continued) (Where: case 1 is the horizontal drainage scenario and case 2 is combined vertical and horizontal drainage) ... 110
6-20: Effect of different drainage scenarios under the calculated coefficient of permeability (kc1) at 55kPa (Where: case 1 is the horizontal drainage scenario and case 2 is combined vertical and horizontal drainage) ... 111
6-21: Effect of different drainage scenarios under the calculated coefficient of permeability (kc1) at 55kPa (Figure 6.20 continued) (Where: case 1 is the horizontal drainage scenario and case 2 is combined vertical and horizontal drainage) ... 112
6-22: Effect of various drainage scenarios under the calculated coefficient of permeability (kc2) at 55kPa (Where: case 1 is the horizontal drainage scenario and case 2 is combined vertical and horizontal drainage) ... 113
6-23: Effect of various drainage scenarios under the calculated coefficient of permeability (kc2) at 55kPa (Figure 6.22 continued) (Where: case 1 is the horizontal drainage scenario and case 2 is combined vertical and horizontal drainage) ... 114
B-1: Determination of cv using Taylor's method (Taylor, 1942)... 164
B-2: Determination of cv by Casagrande's method (Casagrande and Fadum, 1940) ... 165
B-3: Determination of cv by the inflection method (Fang and Daniels, 2006) ... 166
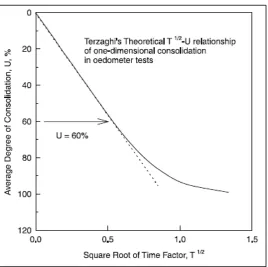
B-4: Terzaghi’s theoretical one-dimensional consolidation hyperbolic curve (Al-Shamrani, 2005) ... 167
B-5: Early stage log t method (Muntohar, 2009) ... 168
B-6: Determination of the rate of secondary consolidation from consolidation curve after Casagrande (Holtz and Kovacz, 1981) ... 170
C-1: X-Ray diffraction for Kaolin clay ... 172
C-2: SEM images of the studied soil sample for Kaolin clay with particle length: a) 30µm, b) 3µm and c) 100µm ... 173
D-1: Change in void ratio at DS100H23 (or D/H 4) (loading is different due to smaller soil sample
diameter) ... 176
D-2: Change in void ratio at sample scale DS150H23 (or D/H 6.5) ... 177
D-3: Change in void ratio at sample scale DS250H23 (or D/H 11) ... 178
D-4: Change in void ratio at sample scale DS100H200 (or D/H 0.5) ... 179
D-5: Change in void ratio at sample scale DS250H200 (or D/H 1.2 and HS200D250) ... 180
D-6: Change in void ratio at sample scale DS250H80 (or D/H 3 and HS80D250) ... 181
D-7: Change in void ratio at sample scale DS150H80 (or D/H 2(a) and HS80D150) ... 182
D-8: Change in void ratio at sample scale DS150H130 (or D/H 1 and HS130D150) ... 183
D-9: Change in void ratio at sample scale DS250H130 (or D/H 2(b) and HS130D250) ... 184
D-10: Change in void ratio at sample scale D/H 5 ... 185
D-11: Logarithm of change in void ratio at various initial moisture content ... 186
D-12: Effect of time factor on change in void ratio at D/H 6.5 (DS150H23) 7 days loading ... 187
D-13: Effect of time factor on void ratio at D/H 0.5 (DS100H200) 7days loading ... 188
F-1: Excess pore pressure at sample D/H ratio scale 2(a) at; a and c) Plastic-Consolidation simulation model at 55kPa and 110kPa and b and d) Consolidation simulation model at 55kPa and 110kPa respectively ... 203
F-2: Excess pore pressure at sample D/H ratio scale 2(b) at; a and c) Plastic-Consolidation simulation model at 55kPa and 110kPa and b and d) Consolidation simulation model at 55kPa and 110kPa respectively ... 204
F-3: Excess pore pressure at sample D/H ratio scale 3 at; a and c) Plastic-Consolidation simulation model at 55kPa and 110kPa and b and d) Consolidation simulation model at 55kPa and 110kPa respectively ... 205
F-4: Excess pore pressure at sample D/H ratio scale 4 at; a and c) Plastic-Consolidation simulation model at 55kPa and 110kPa and b and d) Consolidation simulation model at 55kPa and 110kPa respectively ... 206
F-5: Excess pore pressure at sample D/H ratio scale 5 at; a and c) Plastic-Consolidation simulation model at 55kPa and 110kPa and b and d) Consolidation simulation model at 55kPa and 110kPa respectively ... 207
F-6: Excess pore pressure at sample D/H ratio scale 6.5 at; a and c) Plastic-Consolidation simulation model at 55kPa and 110kPa and b and d) Consolidation simulation model at 55kPa and 110kPa respectively ... 208
F-7: Excess pore pressure at sample D/H ratio scale 11 at; a and c) Plastic-Consolidation simulation model at 55kPa and 110kPa and b and d) Consolidation simulation model at 55kPa and 110kPa respectively ... 209
Acknowledgement
This thesis is submitted in partial fulfilment of the requirements for the PhD degree at the
University of Salford. This work has been conducted at the school of Computer, Science and
Engineering from April 2012 to April 2015 under the supervision of Dr Gareth Swift, Dr
Wayne Yu Wang and Dr Tahsin Toma Sabbagh.
I would like to thank my first supervisor, Dr Gareth Swift for guiding me through thorough
experimental work and challenging project before leaving in December 2014. Special thanks
to Dr Wayne Yu Wang for his continual assistance and support and his huge enthusiasm
during my research. Great thanks to Dr Tahsin Toma Sabbagh, who took over Dr Gareth
Swift for guiding me towards the modelling aspect of my research. Also in this regards, I
will like to thank Mr Andy Gibbon for his assistance in operating the apparatus mainly used
for my research and Mr Philip Latham and Mr Antony Burrage for their close collaboration
in my experimental project. Additionally, I greatly appreciate the help from the Salford
Analytical Service Enterprise staff for their assistance in assessing some soil specimens.
Also, I would like to thanks my friends for their continued support and encouragement
during my degree.
At the end but not the least, I am grateful to my parents. Words cannot express how thankful
I am for their continuous support throughout my research. It was not easy for them to sponsor
me but with dedication and belief they brought me here, and I am forever thankful.
Affirmation
Journal paper
Rosine T.N. & Sabbagh T.T. 2015. The impact of the diameter to height ratio on the
compressibility parameters of saturated fine-grained soils. International Journal of Research
and Engineering Technology, 4(5): 8 - 19
Conference paper accepted for publication
Rosine T.N. & Sabbagh T.T. Effect of initial moisture content and scale on the compression
behaviour of fine-grained soils. 4th GeoChina International Conference 2016 July25-27, Shandong, China.
Journals under consideration
Rosine T.N. & Sabbagh T.T. Modelling of the effect of scale on the compressibility
parameters of fine-grained soils. Geomechanics and Geoengineering international journal.
Rosine T.N. & Sabbagh T.T. Modelling of the effect of calculated coefficient of permeability
on the scale effect of saturated fine-grained soils. Soils and Foundation.
List of symbols with their units
Annotations Comments Units
A Cross-sectional area mm2
β and α Slope intercepts ---
av Coefficient of compressibility m2/KN
cc Compression Index ---
ch Coefficient of horizontal consolidation m2/yr
cr Recompression index ---
cv Coefficient of consolidation m2/yr
cαε Rate of secondary consolidation m2/yr
cα Axial rate of consolidation ---
cs Swelling index ……
cu Undrained shear strength kN/m2
cuh Undrained horizontal shear strength kN/m2
cuv Undrained vertical shear strength kN/m2
d Average particle size mm
dv Vane diameter mm
dV Change in volume m3
d10 Average particle size where 10% of the particles
are finer
mm
D Diameter of sample mm
D0 Deformation at zero consolidation ---
D1 and D2 Dial reading at t1 and t2 ---
D90 Deformation at 90% consolidation ---
D50 Deformation at 50% consolidation ---
D100 Deformation at 100% consolidation ---
DS Diameter Scale ---
D/H Diameter to height ratio ---
e Void ratio ---
e0 Initial void ratio ---
ef Final void ratio ---
e1 Void ratio at σ1 ---
e2 Void ratio at σ2 ---
Δe Change in void ratio ---
F Measured force N
Gs Specific gravity ---
hv Vane height mm
HD Drainage path length mm
H Soil height mm
HS Height Scale ---
ho Initial height mm
Δh Change in height mm
i Hydraulic gradient ---
k Coefficient of permeability m/s
LL Liquid Limit %
Mw Mass of water g
Ms Mass of dry soil g
mv Coefficient of volume compressibility m2/MN
m Mass of rigid plate/porous stone g
M Slope of the initial segment ---
n Porosity ---
PL Plastic Limit %
PI Plasticity Index %
P Actual pressure kPa
Pd Diaphragm pressure kPa
Po Initial pressure kPa
∆P Change in pressure kPa
δp Pressure correction kPa
ρ Bulk density Mg/m3
ρw Density of water Mg/m3
Q Flow rate m3/sec
r Radial distance to the centre of a drain well mm
SEM Scanning Electron Microscope …….
SPSS Statistical Package for the Social Sciences ……
Sr Degree of saturation %
SL Shrinkage Limit %
t Consolidation time Seconds
T Transmitted load N
Tv Time factor ---
t1 Consolidation time at D1 Seconds
t2 Consolidation time at D2 Seconds
tp and ts Time at primary and secondary consolidation Seconds
t50 Consolidation time at 50% consolidation Seconds
t90 Consolidation time at 90% consolidation Seconds
u Pore water pressure kPa
uexcess Excess pore pressure kPa
∂u Change in excess pore pressure kPa
Uav Average degree of consolidation %
V Total soil volume m3
Vw Volume of water m3
Vv Volume of void m3
Vs Volume of dry soil m3
w Moisture content %
Ws Weight of solid N
wi Initial moisture content %
XRD X-Ray Diffraction …….
∂z Change in soil depth mm
γw Unit weight of water kN/m3
σ1' Effective initial pressure kPa
σ2' Effective final pressure kPa
Δσ’ Change in effective stress kPa
Δσ Change in stress kPa
ε Strain …….
δ Settlement mm
δT Total ultimate settlement mm
δi Immediate settlement mm
δc Consolidation settlement mm
δs Secondary settlement mm
τs Frictional stress kPa
τ Torque Kgcm
τh Torque in the horizontal cylindrical surface Kgcm
τv Torque in the vertical cylindrical surface Kgcm
Dedicated to my parents Mr and Mrs Tepondjou and all my brothers and sisters
ABSTRACT
The need for an improved understanding of the influence of sample scale on the
compressibility behaviour of fine-grained soils is crucial in many applications, such as roads,
embankments and foundations. The effect of sample scale represents a challenge when
obtaining engineering parameters in the laboratory compared to those obtained in the field.
This research therefore aimed at contributing to existing knowledge through both
experimental and numerical studies. The experimental study was completed via a series of
consolidation tests on fully saturated fine-grained soil (i.e. kaolin clay) at various sample
scales, which were subsequently explored analytically using the finite element software
PLAXIS 2D. This type of clay was chosen as it is easily sourced and well known. A
Scanning Electron Microscope (SEM) and X-Ray Diffractometer (XRD) were employed in
studying the micro-structure of the soil.
The Oedometer apparatus was used to obtain the combined effect of sample scale and initial
moisture content on the compressibility parameters of kaolin clay. Compressibility
parameters such as coefficient of consolidation (cv), compression index (cc) and coefficient
of volume compressibility (mv) were also investigated in this study. Three different methods
were used to obtain cv: Casagrande, Taylor’s and Inflection methods. The sample scales
were divided into three categories: soil sample height, diameter and diameter to height (D/H)
ratio scale. Particular attention was given to the D/H ratio effect on the compressibility
parameters due to the frictionless boundary conditions, and sample diameter scale due to
drainage path length.
Based on the experimental data, Taylor’s method was considered more reliable in deriving
cv as compared to the Casagrande and Inflection methods, due to the end of primary
consolidation (EOP) observed at all sample scales. It was also observed that on average,
sample scale has an effect on cv with a correlation factor of 0.451 and that friction was
reduced by 35%. The effect of sample scale on cc and mv was found to be insignificant. The
investigation also showed a correlation factor between the initial moisture content and cv of
0.546 and, 0.162 and 0.026 for cc and mv respectively. The new proposed model developed
in PLAXIS 2D was found to show no significant difference with the laboratory data except
where the calculated coefficient of permeability was used. A new proposed model was
developed in PLAXIS to further study the effect of sample diameter scale on the behaviour
of fine-grained soils.
CHAPTER 1
INTRODUCTION
1.1 Background
One of the uncertainties that arise when attempting to predict settlement of structures
founded on fine-grained soils is in the laboratory determination of the soil design parameters
using small soil samples, the behaviour of which may not correspond to the in situ (in the
field) response of the soil mass. Larger soil samples may be more representative, particularly
where the soil mass may contain micro- or macro- structural features. Some researchers have
attempted to investigate the influence of sample scale on soil behaviour. These studies were
conducted on the shear strength, bearing capacity, settlement, compaction-stress relationship
and coefficient of consolidation with sample scale (Healy and Ramanjaneya, 1970; Grisso
et al., 1984; Ortega, 1996; Cerato and Lutenegger, 2007 and Dirgeliene et al., 2007).
1.2 Research Gap
Over the past few decades, various methods have been developed to obtain the
compressibility parameters, such as the coefficient of consolidation (cv). cv relates to the
assessment of the time rate of settlement of a soil undergoing deformation under loading.
Reviews of the consolidation variables discussed by previous researchers are as follows:
1. The coefficient of consolidation using different methods
2. Effect of soil sample diameter scale on cv
3. Effect of soil sample height scale on cv
4. Effect of soil sample diameter to height ratio scale on cv
5. Effect of initial moisture content on compressibility parameters
6. Effect of soil sample scale on the compression index (cc) and coefficient of volume
compressibility (mv)
1.2.1 The coefficient of consolidation (cv) using different test methods
The value of cv is obtained in the laboratory from the one-dimensional consolidation test
using the curve-fitting procedures and based on Terzaghi’s one-dimensional theory (Powrie,
2004). The value of cv has been obtained from the observations of settlement under
embankments and compared with values obtained in the laboratory (Leroueil, 1988 and
Almeida and Marques, 2002). Leroueil (1988) collected data from 16 sites and showed the
ratio of cv (in situ) to cv (laboratory) to vary between 3 and 200 (Tan, 2003). On the other
hand, Almeida and Marques (2002) reported similar ratio values ranging from 20 to 30 for
Sarapui clay deposits. The discrepancies between the in situ and laboratory values are due
to various factors. These factors include the validity of assumptions underlying the
consolidation theory, methods of evaluation of cv using laboratory consolidation test data,
and the difference between the laboratory testing conditions and those in the field.
(Alshernawy, 2007). In the field, the value of cv is affected by a number of factors: drainage
conditions, soil layer thickness, applied load and macro- structural characteristics of the soil
layer (Cortellazzo, 2002).
Some of the methods from which consolidation test data can be evaluated to obtain cv
include: Taylor’s method (Taylor, 1942), Casagrande’s method (Casagrande and Fadum,
1940), the velocity method (Parkin 1978, 1981, 1984), the rectangular hyperbola method
(Sridharan et al., 1987), the inflection method (Mesri et al., 1999), the log(HD2/t) – U method (Sridharan et al., 1995) where U is the average degree of consolidation in percentage, HD is
the drainage path length (mm) and t is the consolidation time in minutes and the slope and
settlement rate method (Al-Zoubi, 2013).
Taylor’s method is affected by the initial compression and in some cases by secondary
compression (Cortellazzo, 2002). The former increases the value of cv while the latter
decreases the value of cv (this is shown in more detail in Chapter 2). The velocity method is
also affected by the secondary compression but is less sensitive. The rectangular hyperbola
method generates values that tend to be greater than the previous two methods but lower
than those obtained with Taylor’s method (Cortellazzo, 2002). The value of cv obtained
using the log (HD2/t) – U method was found to be closer to the value obtained in the laboratory (Sridharan et al., 1995). The inflection methods used only the inflection point of
the compression versus log time curve to obtain the value of cv. Its value was found to be
similar to that of the Casagrande value (Mesri et al., 1999; Prakash et al., 2011; and
Al-Zoubi, 2013). Al-Zoubi (2013) developed a new method of obtaining cv using slope and
settlement rate based on a direct analytical solution of Terzaghi’s theory. The method utilises
two consolidation points to back calculate the initial compression. The value of cv was found
to be comparable to that obtained by the Casagrande method but lower than by Taylor’s
method (Al-Zoubi, 2013).
1.2.2 Effect of sample diameter on the value of cv
Limited research has been completed on the effect of sample diameter on the value of cv.
Healy and Ramanjaneya (1970) looked at various sample scales under constant D/H = 3 on
the value of cv on Varved Clay with no emphases on sample diameter scale. During the
investigation, the value of cv was obtained using the Casagrande method, taking into account
both vertical and horizontal (or radial) water flow within the soil sample. The value of cv
obtained under radial flow was found to be independent of sample scale (i.e. there was no
significant difference in the value of cv with a change in scale). Under vertical flow, the
value of cv obtained was found to differ greatly from that gained in the radial flow. The
variation in cv was due to the loading conditions, where loading on the Varved clay was
applied either vertically or horizontally.
On the other hand, researchers such as Cerato and Lutenegger (2007), Al-Khuzaie (2011)
and Dixit and Patil (2013) investigated the effect of sample diameter on soil behaviour. The
sample diameter was studied on foundation footing sizes where various plate load tests were
conducted at various sample diameters. This refers to the footing size and its effect on:
friction angle and bearing capacity was investigated. The findings revealed that footing size
has a significant influence on internal friction (between soil and foundation footing) and
bearing capacity.
1.2.3 Effect of sample height on the value of cv
Healy and Ramanjaneya (1970), Berry and Reid (1987), Ortega (1996), and Khan et al.
(2012) carried out separate investigations into the relationship between soil thickness and
cv. cv was found to increase with an increase in thickness. Berry and Reid (1987) carried
out consolidation tests on samples prepared under two thicknesses; both tested under single
drainage conditions. Findings revealed that the value of cv obtained using the conventional
size (75mm diameter by 20mm thickness according to the British Standard BS1377 Part 5
(BS, 1990)), ranges between 1 to 10 m2/yr. However, as the soil thickness was increased, the value of cv tended to exceed the upper limit, which confirms findings by Healy and
Ramanjaneya (1970) and Ortega (1996). This relationship is examined in detail in this study.
1.2.4 Effect of sample diameter to height (D/H) scale on cv
The diameter to height ratio (D/H) plays a significant role in obtaining accurate engineering
properties. The American standard and British Standard recommend a minimum value of
2.5 and 4 respectively to minimise friction between the soil and the apparatus. However,
there is little or no justification for these values given in the Standards, and there is very
little supporting data in the literature to help explain how these ratios were derived. The
British Standard 1377 Part 5 (BS, 1990) recommends a sample scale in terms of diameter
and thickness and makes no reference to diameter-height (D/H) ratio; whereas the American
Standard D2435 (ASTM, 2003) makes explicit reference to a limiting D/H ratio. Both the
American and British Standard investigations were based on Terzaghi’s theory. Previous
investigations by Grisso et al. (1984), Dirgeliene et al. (2007), and Kotiya and Vanza (2013)
reveal the effect of sample scale on certain engineering parameters. These parameters
include shear strength, modulus of elasticity and stress-strain relationship, which were
investigated using the Triaxial test. Dirgeliene et al. (2007) proposed a reduction in the
standard D/H ratio in the Triaxial test from 2 to 1 to eliminate friction, while Grisso et al.
(1984) showed that the D/H ratio of a Triaxial soil sample has little effect on the compacted
soil as compared to a smaller D/H ratio. On the other hand, during Triaxial testing, it was
observed that at constant cell pressure, the modulus of elasticity decreases with an increase
in the D/H ratio (Kotiya and Vanza, 2013). However, the effect of D/H ratio on the
compressibility parameters is lacking. This study benefits from a series of analyses in
comparison with the recommended values, and their correlation with compressible
parameters are investigated.
1.2.5 Effect of initial moisture content on cv
Foundation settlements are associated with the design of structures and the changes in initial
moisture content (Foundation Support Works, 2014). Excess moisture content saturates the
foundation, which then leads to soft soils or weak clay soil. As a result, the foundation will
not be able to sustain the loads resulting from foundation settlement (Foundation Support
Works, 2014).
The settlement of a structure founded on fine-grained soil such as clay consists of immediate
and consolidation settlement. The parameters influencing consolidation settlement are:
degree of saturation (Sr %) or initial moisture content (w%), void ratio (e) and amount of overburden pressure (σpkPa) (Phanikumar and Amrutha, 2014). Laszlo et al. (2010)
investigated the effect of varying moisture content on the cohesion and internal friction of
loam soils. These parameters (cohesion and internal friction) were determined using the
Triaxial tests. The initial moisture content (14.37% to 25%) was obtained in the laboratory
using the gravimetric method, which is described in the literature. The findings showed that
the internal friction increases as the initial moisture content increases (Laszlo et al., 2010).
On the other hand, Lei et al.’s (2014) investigation was based on a series of consolidation
tests on remoulded dredged soft soil in Tianjin under different initial moisture contents. The
outcome showed that, under similar loading conditions, the value of cv was found to increase
with an increase in initial moisture content.
1.2.6 Effect of sample scale on the compression index (cc) and coefficient of volume compressibility (mv)
Compression index (cc) is used for the direct calculation of settlement of structures from the
relationship of pressure and void ratio, and is generally used because its value does not
change with change in confining pressure for normally consolidated clays (Abbasi et al.,
2012 and Singh and Noor, 2012a). The coefficient of volume compressibility (mv) is also
the most suitable compressibility parameter for direct settlement calculation. However, its
variability with confining pressure makes it less useful when correlating with some
engineering properties (Singh and Noor, 2012a).
Some investigations on compressibility parameters have been previously reviewed by
Terzaghi and Peck (1996), Sridharan and Prakash (2000), Cerato (2001), Di Maio et al.
(2004), Park and Koumoto (2004) and Singh and Noor (2012a). cc was previously
investigated by numerous researchers to develop its correlation with liquid limit (LL),
specific gravity (Gs), natural moisture content (w), initial void ratio (eo) and plasticity index
(PI) (Singh and Noor, 2012a). Terzaghi and Peck (1996) provided an equation correlating cc
with LL of soils. Di Maio et al. (2004) conducted a one-dimensional test on bentonite and
kaolin and found a good correlation between cc and the void ratio (e) at LL of soils. Singh
and Noor (2012a) proposed a model to correlate cc with LL and PI. Sridharan and Prakash
(2000) and Cerato (2001) show that cc correlates better with the shrinkage limit (SL) of soils
when compared to either LL or PI. Park and Koumoto (2004) show a linear relationship
between cc and cc/n (where ‘n’ is the porosity of the soil). Aksoy and Kaya’s (2013) findings
were validated by those of Sridharan and Prakash (2000), Cerato (2001) and Park and
Koumoto (2004), and they found that there is a truly strong correlation between SL and cc.
These findings did not account for sample scale effect on the consolidation settlement.
Retnamony and Mether (1998) investigated the effect of clay mineralogy on compressibility
parameters (mv). The investigation was based on one-dimensional consolidation tests where
soil samples (montmorillonite, kaolinite, illite and powder quartz) were prepared at moisture
content 1.1 times the soil LL. The soil’s minerals, except for powder quartz, were mixed
with carbon tetrachloride (CCl4) to control the effect of the exchangeable ions on the
compressibility characteristics of clay minerals (Retnamony and Mether, 1998). The
findings revealed that mv increases by 30% for Kaolinite soils, decreases by 33% for illite
and 20% for montmorillonite soils as the pore fluid changes to CCl4, while power quartz
exhibited no significant change in mv. The above response of the compressibility parameters
on clay minerals is governed by the mechanical and physicochemical factors (i.e. mechanical
such as strength of soil and physicochemical such as the interaction between soil particles).
These factors are explained in more detail in the literature.
1.3 Aims and objectives
1.3.1 Aims of research
The effect of sample scale while obtaining engineering parameters in the laboratory poses a
challenge which does not correspond to that in the field. There have been various studies of
the effect of sample scale on the compressibility parameter (coefficient of consolidation (cv))
and a limited number of the remaining parameters such as compression index (cc) and
coefficient of volume of compressibility (mv). The current study aimed at providing
additional information to fill in the gap in the existing knowledge of this behaviour using
Kaolin clay. The investigation will benefit from both physical and numerical analysis.
Kaolin clay was chosen because it is easily obtained, and there have been numerous
laboratory investigations conducted on this soil previously. It thus facilitates comparison of
data achieved with that in the literature. To achieve the main aim of this study, a set of
objectives were outlined.
1.3.2 Research Objectives
The goals of this research are, therefore, to evaluate the following factors:
1.3.2.1Influence of sample scale in deriving the coefficient of consolidation cv
This was achieved by using different methods in obtaining cv. These methods include the
Casagrande method, Taylor’s method (these are widely used methods) and the Inflection
method. These methods are described in detail in Chapter 2. A comparison between these
methods with previous work, in terms of sample scale, was conducted.
1.3.2.2Influence of sample scale on the compressibility parameters
Various sample scale such as: sample height, diameter and diameter to height (D/H) ratio
scale were used. Thorough physical and numerical investigations were conducted and
compared with those from previous researchers and the research question answered.
1.3.2.3The effect of initial moisture content on the compressibility parameters
Due to the shrink/swell behaviour occurring in compressible soils (fine-grained soils) which
occurs because of the variation in moisture content, this investigation is aimed at
contributing to the existing knowledge.
1.4 Research limitations
The principal limitations of this research have been identified as:
1. The initial data were collected manually (using a dial gauge) due to the lack of
computerised system connected to a series of consolidation tests. However, this was
modified at a later stage in the research (using an LVDT). For accuracy, all the
equipment was calibrated and percentage errors implemented.
2. Due to lack of functionality of the equipment, the coefficient of permeability was not
measured but was calculated using a previously derived equation within the literature.
PLAXIS 2D provides an estimated coefficient of permeability which was employed in
the comparison process.
3. Sample diameters were limited to 100mm, 150mm and 250mm. However, this was
compared to previous work, where different diameters were used to show a trend in
data.
1.5 Thesis Outline
A brief review of the thesis chapters is outlined below:
Chapter 2 – Literature review
A review is provided in this chapter on the main features of fine-grained soils, experimental
techniques for testing them and previous work on the effect of sample scale on
compressibility parameters. This chapter provides the necessary background for the
subsequent chapters.
Chapter 3 – Experimental programme
In this chapter, the physical properties of the material studied and the experimental tests
performed in this research are presented. Sample preparation methods, design, calibration
of the apparatus and procedures that were adopted are presented.
Chapter 4 – Effect of sample scale on the compressibility behaviour of fine-grained soils
This chapter contains a series of experimental test results on the impact of sample scale on
the compressibility parameters. The data was divided in terms of the effect of cv using
different test methods, specimen diameters, height and D/H ratio scales and the impact of
initial moisture content on the compressibility parameters.
Chapter 5 – Numerical modelling
Background information on the finite element method used and its application to sample
scale is described. Brief information on previous work in the area is also presented and
discussed. A description of an attempt at the application of the finite difference method to
this study is also presented.
Chapter 6 – Comparison between the experimental and modelling work
Both the experimental and numerical modelling are presented. The validity of the work is
shown and compared.
Chapter 7 – Discussion of findings
This chapter presents the discussion of both the experimental and analytical observations
and their practical implications.
Chapter 8 – Conclusion and Recommendations
This chapter summarises the conclusions drawn from various parts of the thesis.
Recommendations for future investigations in this area are given.
CHAPTER 2
LITERATURE REVIEW
2.1 Overview
This chapter presents a detailed evaluation of previous study into the research area. A review
of clay mineralogy, saturated soil mechanics, laboratory data analysis and detailed study on
previous work is presented. Summaries of the engineering parameters are presented in
Appendix A.
2.2 Basic properties of fine-grained soil fractions
Fine-grained soils are practically impermeable (slow water drainage), and change volume
and strength due to variation in moisture conditions (Budhu, 2000). Their engineering
properties are controlled mainly by the soil mineralogy, water content and surface area
factors rather than particle size. As a result, the inter-particle attraction creates cohesion that
is independent of the external force, which explains the term ‘cohesive soils’ (Budhu, 2000).
Fine-grained soils particle sizes are usually less than 0.075mm which is finer than silt, gravel
and sand (Smith, 2006).
2.2.1 Clay mineralogy
Clay minerals are those members of the layer-lattice group commonly encountered in the
weathering products of rocks containing feldspars and micas (Whitlow, 2001). Four main
groups of clay minerals may be identified, depending on the soil particle arrangement and
the ions present that provide bonding between layers. These groups are kaolinite, illite,
montmorillonite and vermiculite.
2.2.1.1 Kaolinite group
These are the main constituents of china clay derived from weathering feldspar which is an
essential mineral of granite (Powrie, 2004). There are large deposits of china clay in
Cornwall and Devon. According to the British Geological Survey, the resources of china
clay in Britain are confined to the granite areas of South West England, mainly in the central
and western part of the St Austell granite region (Scrivener et al., 1997). It is also found in
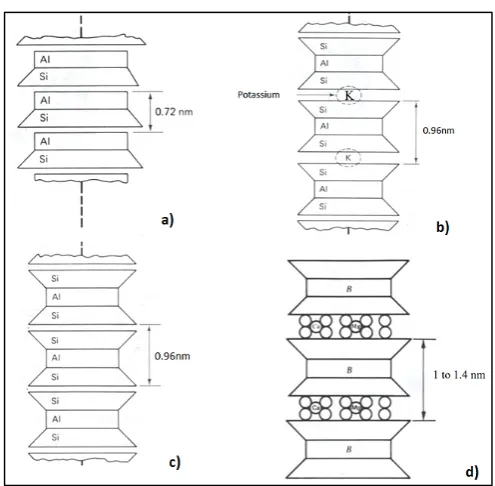
the USA and Brazil (Cornwall Council, 2013). Kaolinite (Figure 2.1a) consists of layers of
one tetrahedral (silica (Si)) sheet and one octahedral (Aluminium (Al)) sheet (Yong et al.,
2012). Because of the stacking of the layers of each of the two sheets, kaolinite is referred
to as 1:1 clay minerals. The two sheets are stacked together in such a way that the tip of the
Si sheet and one Al sheet is about 0.72nm thick (Yong et al., 2012).
2.2.1.2 Illite group
Illite group refers to the degradation of micas under marine conditions resulting in a group
of structurally similar minerals (Whitlow, 2001). This group forms the principal minerals in
marine clays and shales, such as London and Oxford clay. The bonding between illite group
minerals is weaker than in the kaolinite group, which results in thinner and smaller particles
(Craig, 2004). Illite has a 2:1 structure similar to montmorillonite but the interlayers are
bonded together with potassium ions, as shown in Figure 2.1b (Powrie, 2004).
2.2.1.3 Montmorillonite group
This group occurs due to the further degradation of illite and is formed by the weathering of
feldspar in volcanic ash deposits (Craig, 2004). They are also known as smectites and are
the main constituents of bentonite. The structural form is similar to that of illite, but also to
the substitution of aluminium (Al3+) for silicon (Si4+) in the tetrahedral units, as shown in Figure 2.1c (Powrie, 2004). The ions present, apart from potassium, provide weak bonding
between layers. Consequently, water is easily admitted between the soil layers, causing high
shrinkage/swelling capacity (Powrie, 2004).
2.2.1.4 Vermiculite group
This consists of weathering products such as biotite and chlorite. The structure is similar to
that of montmorillonite (with 2:1 minerals). The main action providing bonding between
particles is exchangeable cations such as calcium (Ca2+) and magnesium (Mg2+) as shown in Figure 2.1d (Lambe and Whitman, 1979). The octahedral sheet in Figure 2.1d is brucite
(B). As a result, the shrinkage/swelling capacity is similar to montmorillonite but less severe
(Whitlow, 2001).
Figure 2-1: Schematic diagram of clay mineral group a) kaolinite group, b) illite group, c) montmorillonite group and d) vermiculite group (Lambe and Whitman,
1979)
2.2.2 Clay structure
The way soil particles interact with each other will determine the characteristics and
properties of the soil. Soil composition is a fundamental feature that has a considerable
impact on the structure (i.e. macro-structure), physical and physicochemical properties of
the soil (Yong et al., 2012). Hence, clay structure is divided into two categories:
macro-structure and micro-macro-structure. Macro-macro-structure refers to the visible features of clay deposits
and includes fissures, bedding patterns, silt and sand seams or lenses (Smith, 2006). The
study of macro-structure is necessary as it usually has an effect on soil behaviour (Smith,
2006).
2.2.2.1 Macro-structure
Clay deposits that exhibit no visible change in structure are said to have no macro-structure
or to be uniform (Powrie, 2004). However, many clay soils are layered or stratified, and the
individual layers are relatively thin and parallel with one another and are said to be laminated
(Nagaraj and Srinivasa, 1994). Clay deposits formed in glacial tilt exhibit a unique type of
laminated clay structure called Varved clay (Powrie, 2004). Varved clay occurs due to
seasonal variation in the glacial tilt and the deposit consists of silt or fine sand (deposited
rapidly over the summer period) and clay (usually dark in colour, deposited over the
remaining seasonal period) (Powrie, 2004).
2.2.2.2 Micro-structure
Micro-structure refers to the microscopic or micro-fabric structural arrangement of clay
particles. Nagaraj and Srinivasa (1994) stated that the microstructure of a compacted or
slurry clay soils affects the permeability parameter and volume of voids due to the size,
arrangement and distribution of the voids. Micro-structure experimental interpretation was
conducted by Nagaraj and Srinivasa (1994). It was concluded that the micro-structure of
fine-grained soils at their liquid limit was of the same pattern, and the change in micro-void
volume with stress is proportional to its initial state. When clay minerals are in suspension
in water, they may experience a mutual attraction caused by the Van Der Waal forces. The
attraction occurs between the soil and water cations (Berry and Reid, 1987). The
environment exerts a major influence on the micro-structure of clay deposits. For example:
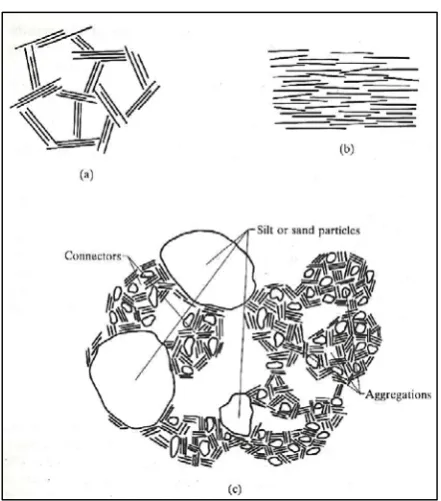
deposition through salt water would produce marine clays showing a flocculated structure,
as in Figure 2.2a, and deposition through fresh water would produce lacustrine or alluvial
clays with a dispersed structure, as depicted in Figure 2.2b (Berry and Reid, 1987). On the
other hand, the micro-structure of natural clay, as seen using a scanning electron microscope
(SEM) has a complex structure as compared to alluvial and marine clays (Berry and Reid,
1987). The complex micro-structure arrangement that commonly occurs in natural clays is
shown in Figure 2.2c. From Figure 2.2c, aggregations that are commonly found in natural
clay, sometimes act as a connector between the silt or sand particles (Berry and Reid, 1987).
Figure 2-2: Micro-structure representation of clay structures; a) Flocculated structure, b) dispersed structure and c) natural clay structure (Berry and Reid, 1987)
2.3 Soil physics related to saturated soils
Less than 1% of the earth’s water occurs as liquid fresh water associated with land masses,
and the rest is either saline water in the oceans and seas or water vapour in the atmosphere
(McLaren and Cameron, 2005). Land-based water arrives as a result of rainfall and
subsequently percolates under the influence of gravity into the soil. Thus, saturated soils
occur throughout the world and are found below the ground water table. The ground water
table refers to the water level within a soil profile. The depth of penetration of water into the
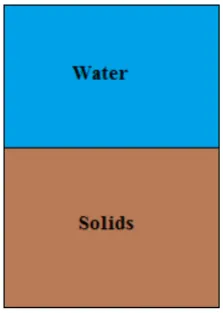
soil depends on the soil’s permeability. Figure 2.3 shows a fully saturated soil profile below
the water table, where all the voids spaces are filled with water.
Figure 2-3: Fully saturated soil
When a saturated soil is loaded, the excess pore water pressures are set in the soil mass.
Since water cannot sustain shear stress, these excess pore water pressures are allowed to
dissipate out of the soil mass. The rate at which water flows is primarily controlled by the
permeability of the soil mass. Therefore, the outflow dissipation of the excess pore water
pressure from the soil mass is referred to as consolidation (Berry and Reid, 1987). As the
pore water pressure is squeezed out of the soil mass, there is a reduction in volume of voids,
which leads to a decrease in the total soil mass; and the effective stresses in the soil increase
with an increase in shear strength. Thus, consolidation and shear strength processes can be
linked (Berry and Reid, 1987).
2.4 Theory of consolidation
The theory of consolidation was first introduced by Terzaghi (1925) in the study of the
deformation of soils matrix, due to the expulsion of water from the pores in a material of
low permeability. This study was carried out under compressive loading and with the
assumption of Darcy’s law being valid. The distortion of the soil is caused by the effective
stress (defined as the difference between the total stress and excess pore water pressure).
The excess pore water pressure is generated due to the initial load transfer applied to the soil
matrix (Cavalcanti and Telles, 2003). Terzaghi’s theory was later generalised to a
three-dimensional version by Biot (1941), and has been implemented in a large variety of practical
problems. Moreover, a three-dimensional generalisation of Terzaghi’s theory was also
proposed by Rendulic (1936). This generalisation led to a two-dimensional diffuse equation
where the total stress was assumed to be constant throughout consolidation (Meijer, 1985).
2.4.1 Terzaghi’s theory
Terzaghi’s vertical consolidation theory refers to the one-dimensional process used on soft
clays when subjected to increased loading. Terzaghi (1943) suggested that compression
within the soil sample was as a result of the dissipation of water from the void space.
One-dimensional compression, in which deformation takes place in the direction of loading, has
a particular significance in soil mechanics and foundation engineering (Powrie, 2004). In
practice, one-dimensional consolidation tests are used to estimate the compressibility
parameters of soils. The conventional Oedometer tests as outlined by Terzaghi’s benefits
from the following assumptions:
1. The soil is homogeneous
2. Fully saturated soil
3. Validity of Darcy’s Law
4. Linear relationship for small strains only
5. Pore fluids incompressible
6. Soil solid incompressible
7. Certain soil properties constant with time (i.e. permeability)
8. Secondary consolidation is ignored (Calabria, 1996).
These assumptions are valid for fine-grained soils with some limitations. These limitations
are:
1. The permeability and mv are assumed to be constant. However, during consolidation,
the void ratio (e) decreases, which results in a reduction in permeability. Thus,
permeability is not constant. mv changes with the stress level, resulting in a different
value of the coefficient of consolidation
2. The water flow is assumed to be 1D, but in reality it is three dimensional
3. The application of load is assumed to produce excess water pressure on the entire soil
stratum, but in some cases the excess water pressure does not develop over the whole
clay stratum (Whitlow, 2001)
During consolidation, two types of drainage conditions could occur single and double
drainage. Under single drainage conditions, the soil profile is resting on an impermeable
base with drainage occurring from the top face. Thus, the distribution of the degree of
consolidation with depth for various values of the time factor is represented by the upper
half of Figure 2.4a. For a soil resting on a permeable boundary with drainage taking place
both at the top and bottom face, it is referred to as double drainage. In this case, the
consolidation of the lower half of the soil layer is a mirror image of the upper half (Berry
and Reid, 1987). This consolidation drainage behaviour is represented in Figure 2.4b. As a
result of this drainage phenomenon, the excess pore pressure will occur at the centre and
bottom of the soil under double and single drainage respectively.
Figure 2-4: Drainage condition of a soil at a) single drainage and b) double drainage (Head, 1998)
2.4.2 Biot’s theory
Terzaghi’s theory considers the simple one-dimensional problem, while Biot introduced the
development of a more general treatment of the quasi-stationary behaviour of saturated soil
(Meijer, 1985). In this section, the general three-dimensional consolidation is considered for
the case of compressible fluids and particles (Biot, 1941). Biot did not use the concept of
effective stress, but the intrinsic compressibility of the soil grains was recognised. The
analytical solution on Biot’s theory is known for the simple initial boundary value problems
(Meijer, 1985).
2.5 Consolidation drainage theory
One of the most common issues in construction is the need to control subsurface water
encountered during the building sequence and the subsurface water after construction. When
a saturated clay soil is subjected to a stress increase, the dissipation of the excess pore
pressure will occur extremely slowly, due to the low permeability of clay soils. Settlement
caused by the drainage of water from the voids will therefore take place over a longer period
(McCarthy, 2002). In a consolidation test, there are several drainage scenarios, as depicted
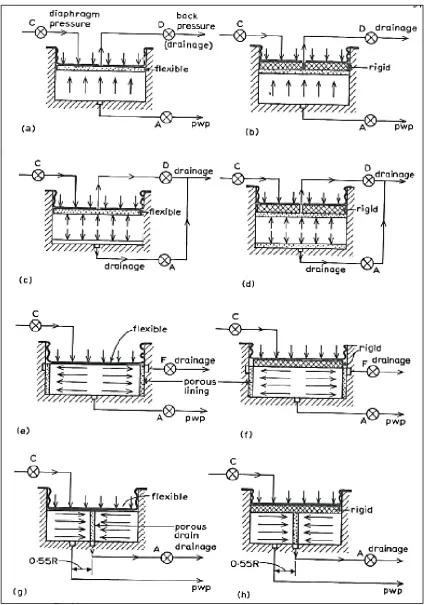
in Figure 2.5. From Figure 2.5, any of the drainage and loading conditions can be used during
the consolidation analysis. The arrows in Figure 2.5 show the direction of drainage, where
upward is for single drainage, upward and downward represent double drainage and outward
and/or inward are for radial drainage conditions. There have been numerous studies with the
drainage scenarios presented in Figure 2.5, including Seah and Juirnarongrit (2003), Imai
and Nawagamuwa (2005), Armstrong (2006), Geng (2008), Wang et al. (2011) and Rosine
and Sabbagh (2015). The Oedometer cell with radial consolidation is occasionally used to
acquire the horizontal coefficient of consolidation (ch), since water can flow radially under
vertical loading, which simulates field conditions (Seah and Juirnarongrit, 2003).
Radial consolidation is a system where both vertical and radial drainage is under surcharge
load. It is used to accelerate consolidation by shortening the drainage path in one of the most
popular methods of soft soil ground improvement (Indraratna et al., 2005). Its mathematical
formulation is based on the small strain theory and for a given stress range where; a constant
mv and a constant horizontal permeability (kh) are assumed. Jamiolkowski et al. (1983)
stated that for most soft soil deposits, the horizontal permeability (kh) is greater than the
vertical permeability (kv), leading to rapid radial consolidation (Indraratna et al., 2005). The
system has been successfully used to improve foundation soils for embankments, airports
and highways (Indraratna and Redana (2000) and Li and Rowe (2001)).
Figure 2-5: Drainage and loading conditions for consolidation in an Oedometer apparatus: a), c), e), g) with free strain loading, b), d), f), h) with equal strain loading
(Head, 1998)
2.5.1 Vertical and horizontal drainage theory
The basic theory of radial consolidation around a vertical sand drain is an extension of
Terzaghi’s one-dimensional theory (Walker and Indraratna, 2006). The coefficient of
consolidation in the horizontal direction (ch) is known to be higher than the coefficient of
consolidation in the vertical direction (cv). The vertical drains reduce the drainage path
noticeably in the radial direction, and it benefits in accelerating consolidation and improving
the soil strength (Terzaghi, 1948). Indraratna et al. (2005) mentioned that Barron (1948)
presented a comprehensive solution to the problem of radial consolidation by drain wells.
Barron (1948) investigation was based on two distinct hypotheses: free strain and equal
strain. The former hypothesis assumes that the load is uniform over a circular zone of
influence for each vertical drain. The differential settlements occurring over this zone have
no effect of redistribution of stress (Indraratna et al., 2005). The latter hypothesis assumes
arching occurs in the upper layer during the consolidation process without any differential
settlements in the clay layer (Indraratna et al., 2005). Practically, both free and equal strain
produce nearly identical results, and equal strain is commonly used in most radial
consolidation analysis (Indraratna et al., 2005).
The conventional equal strain hypothesis assumptions follows by Hansbo (1981) are as
follows:
1. Soil is fully saturated and homogeneous
2. Laminar flow through the soil is adopted (Darcy’s law)
3. Soil strain is uniform at the upper boundary of the unit cell. The small strain theory is
valid
Head (1998) stated that in practice, not all combinations of the drainage scenarios presented
in Figure 2.5 are used. Wang et al. (2011) mentioned that Rendulic (1935) analytical solution
did not account for radial drainage. As a result, Barron (1948) presented an analytical
solution that combined both vertical and horizontal drainage. This was achieved by first
decoupling the radial and vertical drainage, and then obtaining the result from the radial and
vertical drainage (Wang et al., 2011). Based on Barron’s solutions, various analytical and
numerical solutions for soil consolidation with both vertical and horizontal drainage
conditions have been gained (Hansbo, 1981; Hawlader et al., 2002; Nogami and Li, 2003;
Leo, 2004 and Geng, 2008).