S t a n d a r d iz a ti o n a n d
m e t h o d olo gi c al c o n si d e r a ti o n s
fo r t h e is o m e t r i c m i d-t hi g h p ull
C o mfo r t , P, Do s ' S a n t o s , T, B e c k h a m , G, S t o n e , M , G u p py, S a n d
H a ff, GG
h t t p :// dx. d oi.o r g / 1 0 . 1 5 1 9 / S S C. 0 0 0 0 0 0 0 0 0 0 0 0 0 4 3 3
T i t l e
S t a n d a r d iz a tio n a n d m e t h o d olo gi c al c o n si d e r a ti o n s fo r t h e
is o m e t r i c m i d-t hi g h p u ll
A u t h o r s
C o mf o r t , P, D o s ' S a n t o s , T, B e c k h a m , G, S t o n e , M , G u p py, S
a n d H aff, GG
Typ e
Ar ticl e
U RL
T hi s v e r si o n is a v ail a bl e a t :
h t t p :// u sir. s alfo r d . a c . u k /i d/ e p ri n t/ 4 8 6 4 7 /
P u b l i s h e d D a t e
2 0 1 9
U S IR is a d i gi t al c oll e c ti o n of t h e r e s e a r c h o u t p u t of t h e U n iv e r si ty of S alfo r d .
W h e r e c o p y ri g h t p e r m i t s , f ull t e x t m a t e r i al h el d i n t h e r e p o si t o r y is m a d e
f r e ely a v ail a bl e o nli n e a n d c a n b e r e a d , d o w nl o a d e d a n d c o pi e d fo r n o
n-c o m m e r n-ci al p r iv a t e s t u d y o r r e s e a r n-c h p u r p o s e s . Pl e a s e n-c h e n-c k t h e m a n u s n-c ri p t
fo r a n y f u r t h e r c o p y ri g h t r e s t r i c ti o n s .
Standardization and methodological considerations for the Isometric Mid-Thigh Pull 1
Paul Comfort1#, Thomas Dos’Santos1, George K. Beckham2, Michael H. Stone3,Stuart. N.
2
Guppy4, G. Gregory Haff4.
3
1 Directorate of Sport, Exercise and Physiotherapy, University of Salford, Salford, Greater
4
Manchester, UK 5
2 Kinesiology Department, California State University, Monterey Bay, Seaside, CA.
6
3 Center of Excellence for Sport Science and Coach Education, Department of Exercise and
7
Sport Science, East Tennessee State University, Johnson City, TN. 8
4 Centre for Exercise and Sports Science Research, Edith Cowan University, Joondalup,
9
Australia 10
#Corresponding Author – [email protected] 11
12
13
14
15
16
17
18
19
20
21
22
Standardization and methodological considerations for the Isometric Mid-Thigh Pull 24
25
Abstract 26
The isometric mid-thigh pull (IMTP) is commonly used to assess an athlete’s force generation 27
ability. This test is highly reliable and is simple and relatively quick to perform. The data that 28
can be determined from the force-time curves generated by the test have been shown to be 29
closely related to performance capacities in a variety of dynamic athletic tasks. However, 30
within the scientific literature there are inconsistencies in the data collection procedures and 31
methods used for data analysis that may impact the resultant output and the ability to compare 32
and generalize results. Therefore, the primary aim of this review is to identify the differences 33
in IMTP testing procedures and data analysis techniques, while identifying the potential impact 34
this may have on the data collected. The secondary aim is to provide recommendations for 35
the standardization of testing procedures to ensure that future IMTP data is of maximal benefit 36
to practitioners and researchers. 37
38
Introduction 39
Maximal strength underpins performance in many athletic tasks (15, 55, 63) and as such, 40
monitoring strength, usually via repetition maximum (RM) testing, is commonly performed by 41
practitioners and researchers. While RM testing is reliable (12, 24, 28), it can be perceived as 42
fatiguing, posing an increased potential for injury risk, and only providing information related 43
to the maximal load lifted. In contrast, isometric testing, such as the isometric mid-thigh pull 44
(IMTP), is potentially safer (18), less fatiguing, and allows for the quantification of peak force 45
(PF), force at a variety of epochs, and can provide several measures of the rate of force 46
development (RFD) (11, 21, 26, 30, 32, 33). The diagnostic ability of these measures may be
47
sprinting and change of direction. Importantly, the IMTP has been shown to be highly reliable 49
both within and between sessions, with low variability and low measurement error (8, 11, 18, 50
24, 26, 27, 32). 51
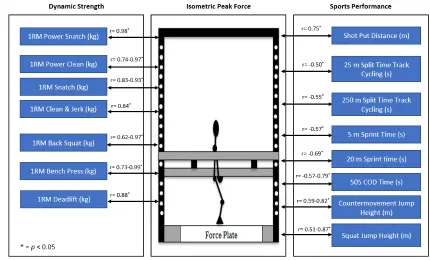
Performance in the IMTP has been associated with performance in numerous athletic tasks 52
(7, 18, 30, 33, 40, 41, 45, 46, 49, 59, 64, 66, 67, 69, 72, 73). Specifically, absolute PF has 53
been associated with weightlifting performance (7, 30), 1RM squat and power clean (45-47, 54
49, 59, 69, 73), 1RM deadlift (18), vertical jump performance (39-41, 53, 60, 64, 67), short 55
sprint and change of direction times (59, 64), sprint cycling performance (60), and throwing 56
performance (72) (Table 1). In contrast, West et al. (71) reported no meaningful relationships 57
between absolute PF and short sprint times or jump height, although they did observe large 58
correlations between relative PF (PF/body weight) and these variables in rugby league 59
players. Similarly, Nuzzo et al. (49) reported only a small relationship between absolute PF 60
and jump height but a large relationship between relative PF and jump height (Table 1). The 61
range of associations between PF and performance in other tasks is summarised in Figure 1. 62
Researchers have also reported relationships between allometrically scaled PF and 63
performance in athletic tasks (60, 72), demonstrating similar correlations to those observed 64
when ratio scaling is used (60). 65
66
67
68
69
70
71
Table 1: Relationships between peak force and performance in other activities
73 74
Author(s) Subjects 1RM Sprint Jump Change of Direction Other
Haff et al. (39) 8 trained (>2 years) men
1RM PC = 1•21 kg.kg-1
SJ PF: r = 0.76 Force during dynamic MTP
90% 1RM: r = 0.77 100% 1RM: r = 0.80 Stone et al. 60 30 competitive sprint
cyclists CMJ height: r = 0.59 CMJ PP: r = 0.79
SJ height: r = 0.51 SJ PP: r = 0.78
Absolute PF & Sprint cycling performances: r = 0.49-0.55 Relative PF & Sprint cycling performances: r = 0.45-0.60 AS PF & Sprint cycling performances: r = 0.45-0.58 Haff et al. (30) 6 elite women
weightlifters Snatch: r = 0.93 CMJ PP: r = 0.88 SJ PP: r = 0.92 Kawamori et al.
(39)
8 male collegiate weightlifters
1RM PC = 1.39 kg•kg-1
CMJ PF: r = 0.87 CMJ PRFD: r = 0.85 CMJ PP: r = 0.95 CMJ height: r = 0.82 SJ height: r = 0.87
Force during dynamic MTP 90% 1RM: r = 0.82
McGuigan et al.
(47) 8 division III collegiate wrestlers PC: r = 0.97 Squat: r = 0.96 BP: r = 0.73 McGuigan &
Winchester (45) 22 college football players 1RM PC = 1.11 kg•kg-1
1RM Squat = 1.75 kg•kg-1
PC, Squat, BP: r = 0.61-0.72*
Nuzzo et al. (49) 12 division I collegiate athletes
1RM PC = 1.28 kg•kg-1
1RM Squat = 1.91 kg•kg-1
PC: r = 0.74 CMJ PP: r = 0.75
Relative PF & CMJ height: r = 0.59
Kraska et al. (41) 41 female and 22 male collegiate athletes
SJ: r = 0.40 SJ20: r = 0.55 CMJ: r = 0.36 CMJ20: r = 0.55 AS PF:
SJ20: r = 0.52 CMJ: r = 0.41 CMJ20: r = 0.52 Whittington et al.
(72) 7 NCAA Division I track and field athletes Ball throw distance PF: r = 0.89
AS PF: r = 0.91 McGuigan et al.
(46)
26 recreationally trained men
1RM Squat = 1.30 kg•kg-1
Squat: r = 0.97 BP: r = 0.99
CMJ height: r = 0.72
Khamoui et al. (40) 19 recreationally
trained men Relative PF & CMJ height: r = 0.61 Relative PF & high pull PV: r = -0.60 West et al. (71) 39 professional rugby
league players Relative PF10 m sprint & time: r = 0.37
Relative PF & CMJ height: r = 0.45
Spiteri et al. (59) 12 competitive female
basketball players IMTP PF, back squat: r relative = 0.81
T-Test: r = -0.85 505 COD = -0.79
Winchester et al.
(73) 26 trained men recreationally 1RM Squat = 1.30 kg•kg-1
Squat: r = 0.97
BP: r = 0.99 CMJ height: r = 0.72
Secomb et al. (53) 15 elite surfers CMJ height: r = 0.65
SJ height: r = 0.58 Beckham et al. (7) 12 collegiate-national
level weightlifters Snatch: r = 0.83 Clean & Jerk: r = 0.84
Total: r = 0.84 Thomas et al. (64) 14 collegiate team
sport athletes
5 m: r = -0.57 20 m: r = -0.69
505mod: r = -0.57
Thomas et al. (67) 22 collegiate team
sport athletes CMJ PF: r = 0.45
Wang et al. (69) 15 collegiate rugby
players Squat: r = 0.866
PC = Power Clean; BP = Bench Press; SJ = Squat Jump; CMJ = Countermovement Jump; 505mod = Modified 505 change of direction PF = Peak Force; PP = Peak Power: PV = Peak Velocity; PRFD = Peak Rate of Force Development;AS = Allometrically Scaled *Individual correlations not reported
76
Figure 1: Relationships between isometric mid-thigh pull peak force and performance in other tasks (References
77
in Table 1)
78
79
Another way to examine the isometric force-time curve is to measure force at specific time 80
epochs (e.g. 50-250 ms). It has been reported that these time specific forces are associated 81
with squat jump (SJ) and countermovement jump (CMJ) height (force at 50-, 90, 250 ms) (41), 82
weightlifting performance (force at 100-, 150-, 200-, 250 ms) (7) and 1RM back squat (90-250 83
ms) (69). Additionally, allometrically scaled force at 150 ms was reported to be related to mean 84
and maximum club head speed during a golf swing (42), with allometrically scaled force at 50-85
, 90- and 250 ms also related to jump performance (41) (Table 2). In contrast, however, force 86
at 30-250 ms was not related to 1RM deadlift performance (18). 87
88
89
90
Table 2: Relationships between time specific force and performance in other activities
92 93
Author(s) Subjects 1RM Sprint Jump Other
Kraska et al. (41) 41 female and 22 male collegiate athletes
PF50 SJ: r = 0.33 SJ20: r = 0.52 CMJ: r = 0.27 CMJ20: r = 0.50 AS PF50: SJ: r = 0.33 SJ20: r = 0.48 CMJ20: r = 0.45 PF90
SJ20: r = 0.37 CMJ20: r = 0.33 AS PF90: CMJ20: r = 0.48 PF250
SJ: r = 0.39 SJ20: r = 0.56 CMJ: r = 0.34 CMJ20: r = 0.54 AS PF250 SJ: r = 0.42 SJ20: r = 0.51 CMJ: r = 0.34 CMJ20: r = 0.48 Beckham et al. (7) 12
collegiate-national level weightlifters
F100
Snatch: r = 0.65 Clean & Jerk: r = 0.64 Combined Total: r = 0.65 F150
Snatch: r =0.64 Clean & Jerk: r = 0.61 Combined Total: r = 0.62 F200
Combined Total: r = 0.72 F250
Snatch: r = 0.80 Clean & Jerk: r = 0.80 Combined Total: r = 0.80 West et al. (71) 39 professional
rugby league players
F100 & 10 m: r = -0.66 Relative F100 & 10 m: r = -0.68
F100 & CMJ PP: r = 0.55 Relative F100 & CMJ PP: r = 0.38
Relative F100 & CMJ height: r = 0.43
Wang et al. (69) 15 collegiate rugby players
Squat
F90: r = 0.76 F100: r = 0.78 F150: r = 0.78 F200: r = 0.77 F250: r = 0.82
Leary et al. (42) 12 recreational golfers
Golf Club Head Speed ASF150 & Mean Club Head Speed: r = 0.46
ASF150 & Max’ Club Head Speed: r = 0.47
F90 = Force at 90 ms; F100 = Force at 100 ms; F150 = Force at 150 ms; F200 = Force at 200 ms; F250 = Force at 250 ms AS = Allometrically Scaled; SJ20 = Squat Jump with 20 kg; CMJ20 = Countermovement Jump with 20 kg
94 95
96
Equivocal results regarding the relationships between measures of RFD and performance in dynamic athletic tasks have been reported in the 97
scientific literature. When examining how the RFD is quantified two main methods exist within the literature (32). The first method is to quantify 98
the peak RFD (PRFD) that occurs during the IMTP with a predefined moving window, most typically lasting between 2-40 ms (32) (Table 3). 99
significant relationships between the RFD and dynamic performance activities (30, 33, 39, 41), 101
while others report no meaningful relationship with 1RM performance (7, 45-47), or SJ and 102
CMJ performances (40, 49, 67). These difference may be attributable to the moving window, 103
with Maffiuletti et al. (43) cautioning against the use of short windows (e.g. 2 ms) as they may 104
be too sensitive to unsystematic variability and therefore less reliable. The second method for 105
evaluating the RFD is to examine time dependant epochs (32). The use of time dependent 106
epoch has been shown to be an effective method for examining the RFD during the IMTP and 107
relating it to various sports performance tasks. For example, Spiteri et al. (58) report that 108
athletes who produce higher RFD to 90 ms and 100 ms are able to demonstrate faster agility 109
times during a 45 ˚ cutting task. One possible explanation why some RFD measures relate to 110
dynamic performance activities and others do not is the method of calculation and reliability of 111
the method. For example, Haff et al. (32) have shown that the only PRFD measure that is 112
reliable is when a 20 ms moving window is used, supporting previous suggestions by 113
Maffiuletti et al. (43). Conversely, using time dependent epochs such as 0-90 ms, 0-150 ms, 114
0-200 ms and 0-250 ms to calculate the mean RFD across the specific duration produces 115
much more reliable results and generally have better relationships to dynamic performance 116
measures. Therefore, it is generally recommended that using time specific RFD epochs is 117
warranted when using the IMTP as a performance diagnostic tool (32). 118
119
120
121
122
123
124
Table 3: Relationships between RFD and performance in other activities
126 127
Author(s) Subjects 1RM Sprint Jump Change of Direction Other
Haff et al. (33) 8 trained (>2 years) men 1RM PC = 1.21 kg•kg-1
PRFD
SJ Power: r = 0.76 SJ Height: r = 0.82
RFD during dynamic MTP 80% 1RM: r = 0.84 90% 1RM: r = 0.88 100% 1RM: r = 0.84 Haff et al. (30) 6 elite women
weightlifters PRFD Snatch: r = 0.79 Combined Total: r = 0.80
PRFD
CMJ PP: r = 0.81 SJ PP: r = 0.84
McGuigan et al.
(47) 8 collegiate division III wrestlers
PRFD & Coaching Ranking: r = 0.62
Kawamori et al.
(39) 8 male collegiate weightlifters 1RM PC = 1.39 kg•kg-1
Force during dynamic MTP 90% 1RM: r = 0.69
120% 1RM: r = 0.74
Nuzzo et al. (49) 12 division I collegiate athletes 1RM PC = 1.28 kg•kg-1
1RM Squat = 1.91 kg•kg-1
PRFD
CMJ PP: r = 0.65
Kraska et al. (41) 41 female and 22 male collegiate athletes
PRFD SJ: r = 0.48 SJ20: r = 0.66 CMJ: r = 0.43 CMJ20: r = 0.62 Whittington et al.
(72) 7 NCAA Division I track and field athletes
Ball throw distance: r = 0.78
Khamoui et al. (40) 19 recreationally
trained men RFD50 & high pull PV: r = 0.56
West et al. (71) 39 professional rugby league players
PRFD
10 m: r = -0.66 PRFD CMJ height: r = 0.39
Beckham et al. (7) 12 collegiate-national level weightlifters
RFD200 Snatch: r = 0.65 Combined Total: r = 0.60
RFD250 Snatch: r = 0.78 Clean & Jerk: r = 0.72 Combined Total: r = 0.75
Thomas et al. (64) 14 collegiate team
sport athletes PRFD 5 m: r = -0.58
20 m: r = 0.71
PRFD
505mod: r = -0.57
Wang et al. (69) 15 collegiate
rugby players 5 m: PRFD: r = -0.54
RFD30: r = 0.57 RFD50: r = 0.53
Pro agility:
PRFD: r = -0.52 RFD30: r = 0.52 RFD50: r = 0.53 RFD90: r = 0.53 RFD100: r = 0.52
PRFD = Peak RFD; RFD30 = Mean RFD between 0-30 ms; RFD50 = Mean RFD between 0-50 ms; RFD90 = Mean RFD between 0-90 ms RFD100 = Mean RFD between 0-100 ms; RFD200 = Mean RFD between 0-200 ms; RFD250 = Mean RFD between 0-250 ms; PV = Peak Velocity
128
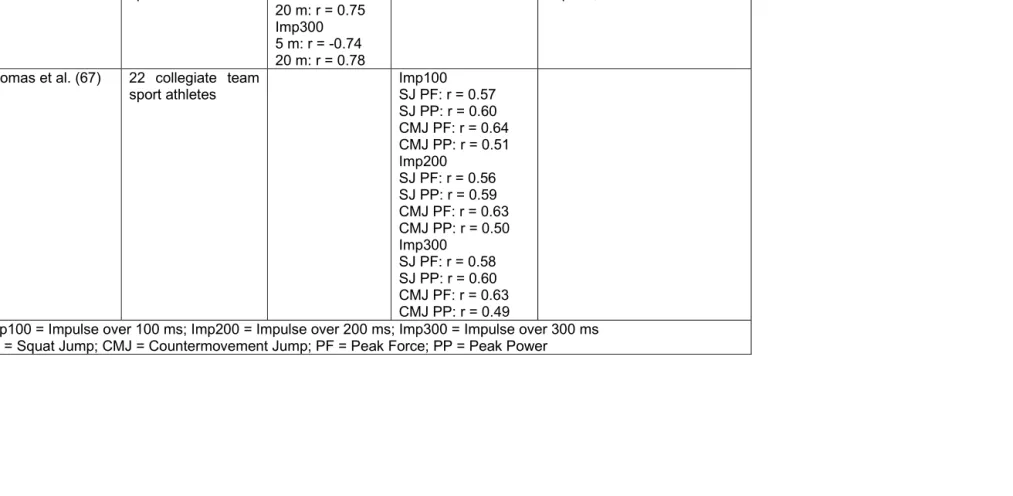
Another method for analysing the force-time curve derived from an IMTP is to examine the isometric impulse (67, 68). For example, impulse 129
values across different epochs (0-100, 0-200 and 0-300 ms) have been associated with 5- and 20 m sprint times as well as 505 change of 130
direction times (64), peak force and power during the SJ and CMJ (68) (Table 4). While determining the isometric impulse of various epochs 131
within the force-time curve achieved during the IMTP yields useful information much more research is needed to understand how best to utilise 132
Table 4: Relationships between time specific impulse and performance in other activities
134 135
Author(s) Subjects Sprint Jump Change of Direction
Thomas et al. (64) 14 collegiate team
sport athletes Imp100 5 m: r = -0.71 20 m: r = 0.75 Imp300 5 m: r = -0.74 20 m: r = 0.78
Imp100, 505mod: r = -0.58 Imp300, 505mod: r = -0.62
Thomas et al. (67) 22 collegiate team sport athletes
Imp100 SJ PF: r = 0.57 SJ PP: r = 0.60 CMJ PF: r = 0.64 CMJ PP: r = 0.51 Imp200
SJ PF: r = 0.56 SJ PP: r = 0.59 CMJ PF: r = 0.63 CMJ PP: r = 0.50 Imp300
SJ PF: r = 0.58 SJ PP: r = 0.60 CMJ PF: r = 0.63 CMJ PP: r = 0.49
Imp100 = Impulse over 100 ms; Imp200 = Impulse over 200 ms; Imp300 = Impulse over 300 ms SJ = Squat Jump; CMJ = Countermovement Jump; PF = Peak Force; PP = Peak Power
136 137
The PF achieved during the IMTP has also been used to monitor adaptations to training (5, 139
36, 50, 51, 57, 70, 74), with some authors also including RFD (36, 51, 52, 74). PF and peak 140
RFD have also been used in an attempt to identify levels of fatigue or recovery (4, 29, 35, 44). 141
More recently researchers have started to investigate the potential of the IMTP to investigate 142
between-limb asymmetries, using dual force platforms (1-3) and a unilateral stance IMTP (25, 143
65). Additionally, the PF during the IMTP has been divided by the PF during a SJ or CMJ, to 144
calculate the dynamic strength index (DSI; ratio of PF during the CMJ or SJ and IMTP PF), in 145
attempt to identify if an athlete needs to focus more on maximal force production or rapid 146
dynamic force production (14, 52, 54, 56, 66). 147
148
Variation in Testing and Data Analysis Procedures 149
Unfortunately, there is substantial variation across testing protocols reported within the 150
scientific literature, including differences in knee and hip joint angles (120-150° and 124-175°, 151
respectively), sampling frequency (500-2000 Hz), pull onset identification thresholds including 152
absolute (20-75 N) and relative (2.5-10% body weight) threshold values, and smoothing and 153
filtering approaches, with some authors not stating hip angles, thresholds or filtering 154
procedures (Table 5). In addition, if practitioners or researchers are intending to use published 155
values for comparison they should be mindful that some data is presented as net force (gross 156
force – body weight) while others report gross measures, along with ratio and allometric 157
scaling used in some studies. These two latter approaches may impact the results less, as 158
allometric scaling uses an exponent related to body mass (13) although allometric scaling will 159
reduce the resultant values compared to ratio scaling, with greater variation introduced 160
depending on the exponent used (Table 5). 161
162
Table 5: Reported Testing and Data Analysis Procedures
164 165
Author(s) Knee Angle Hip Angle Sampling
Frequency
Onset Threshold
Scaling Smoothing & Filtering
RFD Calculation
Haff et al. (33) 144 ± 5˚ 145 ± 3˚ 500 Hz --- Net Force --- PRFD (2 ms
window)
Stone et al. (60) 140-145˚ --- 600 Hz --- Net
Absolute, Relative
and AS
--- PRFD (1.7 ms
window)
Haff et al. (30) 127-145˚ * --- 600 Hz --- Net Force --- PRFD (1.7 ms
window) McGuigan et al.
(47)
130˚ --- 500 Hz --- Absolute --- PRFD (2 ms
window) Kawamori et al.
(39)
141±10˚ 124±11˚ 500 Hz --- --- --- PRFD (2 ms
window)
Haff et al. (31) 127-145˚ * --- 600 Hz --- Net Force --- PRFD (1.7 ms
window)
Nuzzo et al. (49) 140˚ --- 1000 Hz --- Ratio --- Mean RFD
Winchester et al.
(74) 130˚ --- --- --- Net --- ---
Winchester et al. (73) #
--- --- --- --- --- --- ---
McGuigan & Winchester (45)
130˚ --- 960 Hz --- --- --- ---
Assumed peak due to the
values
Kraska et al. (41) 120-135° 170-175°
¥ In line with Haff et al (1997)
1000 Hz --- Absolute &
AS --- Assumed peak ---
due to the values Whittington et al.
(72) ‘Self-selected’ 120-135˚ ‘Self-selected’ 170-175˚ 1000 Hz --- --- --- PRFD (1 ms window)
McGuigan et al. (46)
Assumed Net due to the values
Assumed mean due to the
values West et al. (71) 120-130˚
¥ In line with Haff et al (2005), Stone
et al (2004)
--- 1000 Hz 5SD of mean
force after trigger
Net Dual pass
Butterworth filter (low pass, 20 Hz
cut-off)
PRFD (1 ms window)
Crewther et al. (16)
120-130˚ ¥ In line with
Haff et al (2005), Stone
et al (2004)
--- 1000 Hz --- Net Dual pass
Butterworth filter (low pass, 20 Hz
cut-off)
PRFD (1 ms window)
Beckham et al. (6) ¥ In line with Haff et al. (1997) and Kraska et al.
(2009)
¥ In line with Haff et al. (1997) and Kraska et al.
(2009)
1000 Hz --- Absolute &
AS
4th Order Butterworth low pass filter
100 Hz
Not included
Beckham et al. (7) 120-135° 175° 1000 Hz --- Absolute,
Ratio & AS
4th Order Butterworth low pass filter
100 Hz
Mean & PRFD (1 ms window)
Sheppard et at. (56)
130° 155-165° 600 Hz --- Net --- Not included
Comfort et al. (11) 120°, 130°, 140°, 150° & Self-selected (133 ± 3°)
125°, 145° & Self-selected (138 ± 4°)
600 Hz 40 N Absolute --- PRFD (1.7 ms
window)
Thomas et al. (64) Self-selected Self-selected 600 Hz --- Absolute 4th Order
Butterworth low pass filter
16 Hz
PRFD (1.7 ms window)
Thomas et al. (67) Self-selected Self-selected 600 Hz --- Absolute &
Relative
4th Order Butterworth
low pass filter 16 Hz
Thomas et al. (66) Self-selected Self-selected 600 Hz --- Absolute 4th Order
Butterworth low pass filter
16 Hz
Not included
Haff et al. (32) 140.0 ± 6.6˚ 137.6 ± 12.9˚ 1000 Hz --- Net Rectangular
smoothing with a moving
half-width of 12
PRFD (20 ms window) RFD30, 50, 90, 100,
150, 200, 250
Secomb, et al. (52) 125-140° --- 600 Hz --- Absolute
and Relative
--- Not included
Secomb et al. (53) 125-140° --- 600 Hz --- Absolute
and Relative
--- Not included
Secomb et al. (54) --- Stated similar
to Haff et al. (2005)
--- Stated similar to
Haff et al. (2005)
600 Hz --- Absolute
and Relative
--- Not included
Tran et al. (68) ---
Stated similar to Haff et al.
(1997)
--- Stated similar to
Haff et al. (1997)
600 Hz --- Absolute
and Relative (Assumed Net due to the values)
4th Order Butterworth low pass filter
10 Hz
Spiteri et al. (58) 140˚ 140˚ 2000 Hz --- Relative --- RFD30, 50, 90, 100
Sjokvist et al. (57) --- States in line with Stone et al. (2004) Absolute
and Relative
--- Not included
Welch et al. (70) No specific detail provided other than bar positioned at mid-thigh Relative --- Not included
Wang et al. (69) Self-selected Self-selected 1000 Hz --- Net --- PRFD (20 ms
RFD30, 50, 90, 100, 150, 200, 250
Mangine et al. (44) Self-selected Self-selected 1000 Hz --- Net --- PRFD (20 ms
window) RFD30, 50, 90, 100,
150, 200, 250
Halperin et al. (34) 130-140˚ Not stated 1000 Hz --- --- --- Not included
Dos’Santos et al. (22)
Self-selected Self-selected 2000 Hz (down-sampled to 1500, 1000 &
500 Hz)
75 N Absolute 20 ms moving
average
RFD100 RFD150 RFD200
Bartolomei et al. (4)
140˚ 125˚ 1000 Hz --- Absolute --- PRFD (20 ms
window)
James et al. (38) 141.9 ± 4.3˚ 139.2 ± 4.1˚ 1000 Hz down sampled to 100
Hz to compare to strain gauge
20 N Net 4th Order
Butterworth low pass filter
10 Hz
PRFD (20 ms window) RFD30, 50, 90, 100,
150, 200, 250
De Witt et al. (18) 144 ± 3° 137 ± 3° 1000 Hz --- ---
Assumed Net due to the values
--- PRFD (20 ms
window) RFD30, 50, 90, 100,
150, 200, 250 Dos’Santos,
Thomas et al. (24)
137-146° ¥ 140-149° ¥ 1000 Hz 40 N Absolute --- Not included
Dos’Santos, et al. (21)
Self-selected Self-selected 1000 Hz 2.5% BW,
5% BW, 10% BW, >75 N,
5 SD BW
Absolute --- RFD100
RFD150 RFD200
Beckham et al. (8) 125° 125° & 145° 1000 Hz --- Absolute &
AS
2nd Order Butterworth low pass filter
10 Hz
Oranchuk et al. (50)
135-145˚ --- 1000 Hz 2.5% of mean
body mass, based on
force-time data
Relative 4th Order Butterworth filter, with 20
Hz cut-off
PRFD (20 ms window)
Dobbin et al. (20) 140˚ Self-selected,
shoulder above the bar (as described by Thomas et al.,
2015)
1200 Hz --- Net relative
and AS
--- Not included
Beattie et al. (5) 131 ± 9˚ --- 1000 Hz --- Relative --- Not included
Dos’Santos et al. (26)
145˚ 145˚ & 175˚ 1000 Hz 5 SD BW Net Unfiltered PRFD
RFD100 RFD150 RFD200
Leary et al. (42) 142 ± 7° 146 ± 11° 1000 Hz --- Rectangular
smoothing with a moving
half-width of 12
PRFD RFD30, 50, 90, 100,
150, 200, 250
--- = not stated
¥ = Incorrectly cites joint angles ‘in line with previous research’ when the referenced studies used different joint angles Net Force = Gross Force – Body Weight
PRFD = Peak Instantaneous RFD (the greatest rate of change in force between two tangential points; the window differs based on sampling frequency)
Mean force (Change in force / change in time from onset of force production to time to peak force) RFD100 = subscript numbers refer to the epoch for mean RFD
*Based on knee angle achieved during the 2nd pull phase of the clean for each individual #Published abstract
¥ Self-selected to replicate the start of the second pull
Numerous authors have suggested that the posture adopted during the IMTP should replicate 167
the start of the second pull phase of the clean, (30, 31, 33, 60); however, only two studies 168
have actually assessed the participants knee joint angles during the clean and then adopted 169
these angles during the IMTP (30, 31). This is most likely due to time and practicality of 170
assessing specific joint angles during the clean prior to performing the IMTP, especially when 171
assessing large squads of athletes. Interestingly, hip joint angles were not reported within 172
these two studies (30, 31). 173
Due to the variety of knee and hip joint angles reported within the literature, Comfort et al. (11) 174
investigated a range of knee (120°, 130°, 140°, 150°) and hip (125°, 145°) joint angles, along 175
with self-selected posture (knee 133±3°, hip 138±4°) based on the athletes preferred position 176
to start the second pull of a clean, which is what the posture adopted during the IMTP was 177
originally based on (33). The results of the study indicated that there were no significant or 178
meaningful differences in PF, PRFD or impulse between postures, although the preferred 179
(self-selected) posture demonstrated the highest reliability and the lowest measurement error. 180
In contrast, Beckham et al. (6) found that powerlifters produced greater PF during an isometric 181
testing with a vertical torso compared to a deadlift-specific body position at the same bar 182
height, described as being a “relatively straight legged position and somewhat bent over the 183
bar”. The authors suggested that the upright position may have provided a mechanical 184
advantage and a posture more optimal for force production against the bar. In another study, 185
Beckham et al. (8) compared the effects of different hip joint angles (125° vs. 145°), while 186
standardizing the knee joint angle (125°) reporting meaningful and significantly higher PF and 187
force at different epochs (50, 90, 200, 250 ms) in the more upright (145°) position, especially 188
in subjects with greater experience in performing weightlifting exercises and their derivatives, 189
in contrast to Comfort et al. (11). Interestingly, Beckham et al. (8) reported small changes in 190
joint angles throughout the execution of the test and based on these observations recommend 191
that in the future researchers and practitioners should adopt standardized knee and hip angles 192
More recently, Dos’Santos et al. (26) compared hip joint angles of 145˚ and 175˚ with a 194
standardized knee joint angle of 145˚, finding greater time specific force values and RFD at 195
predetermined epochs, with a 145˚ hip angle (Table 5). The hip angle of 175˚ previously 196
reported by Kraska et al. (41) and replicated by Beckham et al. (6) actually refer to trunk angle 197
relative to vertical, to ensure an upright trunk (forward lean of 5˚ from vertical), exhibiting an 198
upright trunk as previously described (30, 31, 33, 60) rather than a 175˚ hip angle as used by 199
Dos’Santos et al. (26). The authors of a recent meta-analysis also highlight the fact the 200
practitioners should carefully consider the specific protocol, including joint angles, to ensure 201
repeatability of the measures (27). 202
While adopting standardized knee and hip angles during the IMTP may seem logical, this 203
practice may place athletes in a sub-optimal pulling position, due to the range of angles 204
reported across individuals for the second pull phase of the clean (30, 31). Therefore, it is best 205
to consider the individual athletes’ appropriate second pull position and then quantify the knee 206
and hip angles. This practice allows for the individual athlete’s anthropometrics to be 207
considered and allows them to assume an optimal pulling position, in line with the range of 208
joint angles recommended by Beckham et al. (8). Once the pulling position is established then 209
it is recommended that practitioners and researchers ensure that the individual starting 210
postures are replicated between trials and testing sessions. Joint angles should be assessed 211
prior to the commencement of the pull due to slight changes in joint angles during the pull (8). 212
Haff et al. (32) suggest using minimal pre-tension prior to initiation of the pull, as this is likely 213
to impact both time specified force and RFD, with Dos’Santos et al. (26) recently reporting that 214
the 175˚ hip angle results in significantly higher ‘body weight’ due to increased pre-tension, 215
compared to a 145˚ hip angle, which may have contributed to in the differences in time specific 216
force values and RFD that were reported. Similarly, Maffiuletti et al. (43) suggested that pre-217
tension is undesirable when assessing isometric RFD, albeit with a focus on single joint 218
and post isometric pull, to ensure that there are no differences in force, which should represent 220
body weight. 221
Interestingly, numerous authors state that they have adopted the postures previously reported 222
by other researchers, but in fact report different angles to those stated in the studies that they 223
cite, or cite multiple researchers who reported different postures (Table 5). These differing 224
postures are most likely related to individual athlete anthropometric profiles. It is therefore 225
important that researchers carefully report and justify their choice of joint angles, but more 226
importantly, standardize these between trials and testing sessions. 227
Other researchers have used strain gauge based equipment, with the handle attached via a 228
chain (16, 17, 37, 38, 48) with a range of sampling frequencies (100-133 Hz (17, 37, 38)) and 229
joint angles (knee 120-130˚ (17), 142±4˚(38), 143±7˚ (37), 160˚ (48); hip 139±4˚ (38), 144±5˚ 230
(37)). However, findings of two research groups that compared strain gauge systems to a 231
force platform demonstrated that the strain gauge significantly underestimated PF, by ~8% 232
(38) to ~10% (20). Additionally, James et al. (38) found that measures of RFD did not meet 233
acceptable standards of reliability. While such systems can measure PF, which can be ratio 234
or allometrically scaled, there does not seem to be an effective way to accurately measure or 235
calculate RFD, and are therefore not recommended if practitioners have access to a force 236
platform. 237
238
Recommendations for Correct IMTP Assessment 239
Due to the noticeable variations in assessment procedures, including posture, sampling 240
frequency, and methods of calculating specific variables (namely use of different sampling 241
frequencies, onset thresholds, and the method for the calculation of RFD), we suggest 242
appropriate standardization of all testing procedures for the IMTP. Such standardization 243
should permit more meaningful comparisons of individual performances between testing 244
studies. Standardization should also include the verbal cues as attentional focus has been 246
shown to affect force production, with an external focus of ‘push as hard and fast as possible’ 247
resulting in greater PF compared to an internal focus (34). 248
249
Recommended Testing Procedures 250
Prior to initiation of IMTP testing, the bar height necessary to obtain the correct body position 251
should be determined. This should be an iterative process in which the athlete starts with a 252
bar height that allows the athlete to assume a body position that replicates the start of the 253
second pull position during the clean. The bar height should then be adjusted up or down to 254
allow the athlete to obtain the optimal knee (125-145°) and hip (140-150°) angles (6, 8, 26). 255
The body position should be very similar to the second pull of the clean and the clean grip 256
mid-thigh pull exercise (19): upright torso, slight flexion in the knee resulting in some 257
dorsiflexion, shoulder girdle retracted and depressed, shoulders above or slightly behind the 258
vertical plane of the bar, feet roughly centred under the bar approximately hip width apart, 259
knees underneath and in front of the bar, and thighs in contact with the bar (close to the 260
inguinal crease dependent on limb lengths) (Figure 2). When making joint measurements, the 261
athlete should ensure that no tension is applied to the bar but that all “slack” (e.g. elbow flexion, 262
shoulder girdle elevation/protraction) is removed from the body, as this would result in a 263
change in joint angles during the maximal effort which is undesirable (8). 264
265
266
267
268
270
Figure 2: Correct posture for the isometric mid-thigh pull, illustrating an upright trunk, 271
replicating the start position of the second pull of the clean 272
273
While the use of a “self-selected” body position is likely beneficial to efficiency of testing, it is 274
not recommended without ensuring that the hip and knee joint angles fall within the ranges 275
recommended above, due to the influence of body positioning on force generation (6, 8, 26). 276
The bar height used and joint angles obtained should be recorded so that repeated 277
measurements can be standardized and therefore replicate the individuals’ body position 278
between session, ensuring that differing results in subsequent testing are not the result of 279
changed body position (8, 26). It is also considered best practice to measure the individuals 280
grip width and foot position and standardize these for individuals across sessions (unless 281
working with youth athletes where changes in stature as a result of maturation may require 282
increased stance and grip width) as each can affect body positioning relative to the bar (19). 283
After the bar height and posture have been established, a short familiarization session of 284
submaximal trials is recommended approximately 48 hours prior to testing (e.g. 3 x 3 second 285
optimal amount of familiarization has not yet been reached, nearly all IMTP studies use some 287
familiarization. 288
Athletes should complete some manner of standard generalized warm-up (62). While there is 289
variability in the generalized warm-up chosen among studies, most studies use a warm-up 290
that incorporates clean derivatives, such as the dynamic mid-thigh pull, and should thus be a 291
component of the standard warm-up (7, 21, 24, 32, 33). Submaximal trials of the IMTP are 292
also recommended prior to maximal effort trials (e.g. 3 seconds each of: 50% maximal effort, 293
75% maximal effort, 90% maximal effort, separated by 60 seconds rest). During this time, the 294
athlete should be secured to the bar using lifting straps and athletic tape to ensure that grip 295
strength is not a limiting factor (Figure 3) (30, 33). 296
297
For each of the maximal effort trials, standardized instructions should be given to the athlete 298
of some iteration of “push your feet into the ground as fast and as hard as possible” to ensure 299
that both maximal RFD and PF are obtained (10, 34). It is essential that athletes understand 300
that the focus is to drive the feet directly into the force platform and not attempt to pull the bar 301
with the arms, or rise up on to their toes. The athlete should get into the correct body position 302
for the IMTP, using just enough pre-tension to achieve the correct body position and remove 303
“slack” from the body, but without any more pre-tension than is necessary to get the “quiet 304
athlete’s body positioning and ensuring the force trace created by the athlete is both similar to 306
body mass and steady, with trials where a change in force >50 N occurs during this period 307
rejected (21). This should be explained to the athletes and they should be encouraged to stay 308
as still as possible during this period to accurately determine body weight and onset threshold. 309
A countdown of “3, 2, 1, PULL!” gives the athlete sufficient warning to be ready to give a 310
maximum effort and provides at least one second of quiet standing to enable the identification 311
of the onset of the pull (Figure 5a). Strong verbal encouragement from researchers and 312
teammates ensures that the athlete gives a maximum effort (9). A minimum of two trials should 313
be collected, provided that each of those trials have no errors by the athlete (e.g. 314
countermovement, excessive pre-tension, leaning on the bar prior to the pull (Figure 4). With 315
increasing PF, additional trials should be performed, until the PF values of the trials are 316
separated by <250 N (30, 33). It is noted, however, that a percentage of peak force may be 317
advantageous as an absolute value will affect stronger and weaker athletes differently, 318
although the exact effect of this has not been investigated. 319
Visual inspection of the force-time curves during testing can easily be used to determine if the 321
trials are acceptable, or if additional trials should be performed. In addition to the trials being 322
within 250 N between attempts, trials should be repeated if there is not a stable weighing 323
period (clear fluctuation in the force-time data) or a clear countermovement prior to the 324
initiation of the pull (Figure 5c), as this will interfere with accurate identification of the initiation 325
of the pull (19), or if the PF occurs at the end of the trial (Figure 5b). It is also important to 326
check that the force during the initial period of quiet standing (in the ready position, strapped 327
to the bar, immediately prior to commencing the pull) represents body weight, and therefore 328
no prior tension has been applied (Figure 5a) as this will interfere with pull onset identification 329
331
Recommended Data Analysis and Reporting 332
Collection of IMTP force-time data can be compiled accurately with a sampling frequency as 333
low as 500 Hz , but if higher sampling frequencies can be used then they are preferred as they 334
may increase the accuracy of time dependent measures (21). Specifically, the utilization of 335
frequencies ≥1000 Hz are recommended especially if early force-time variables are of interest 336
(e.g. force at 50 or 100 ms) (21). There are not enough data for a consensus regarding optimal 337
suggested as optimal for analysis of countermovement jump performance (61) and where 339
possible, unfiltered data for isometric testing (23, 43). It is therefore suggested that unfiltered 340
and non-smoothed data is used for subsequent analysis (23), as most of the RFD and impulse 341
characteristics are dependent upon an accurate determination of the start of the pull (21), 342
although data from portable force platforms may exhibit greater ‘noise’ and warrant smoothing. 343
Accurate identification of the start of the inflection point is often achieved using automated 344
methods - we recommend using 5 standard deviations of body weight during an initial one 345
second weighing period prior to the (usually one second) of quiet standing (in the ready 346
position, strapped to the bar, immediately prior to commencing the pull) as the threshold for 347
determining the onset of the pull (21), although this may vary with technical idiosyncrasies of 348
different force platforms (e.g. noise magnitude). Trials that do not have a stable baseline force 349
trace during the weighing period (change in force >50 N) should be rejected and subsequently 350
another trial should be performed (21, 43) (Figure 5). To facilitate this stable period, it is 351
essential to enforce and practice this during the warm-up / familiarization trials. 352
It is recommended that time-specific RFD epochs (50-, 100-, 150-, 200- and 250 ms commonly 353
reported) should be used when using the IMTP as a sport performance diagnostic tool as 354
these are not only reliable (32), but can be selected specific to the durations relevant to the 355
specific sporting tasks, such as ground contact time during acceleration or peak running 356
speeds. In contrast, maximal strength capabilities can be inferred from PF (Table 1). 357
When reporting results from IMTP testing, it is important that the hip and knee angles used by 358
each athlete, to establish the bar height, be reported (8, 26). Such standardization of posture 359
between trials and testing sessions ensures that data is comparable between sessions, groups 360
of athletes and studies (8, 26). While there is no consensus as to the superiority of either net 361
or gross force values for the IMTP, it is important that researchers report whether body weight 362
was or was not included in the force and impulse values reported (7). Other methodological 363
considerations, such as the method for identifying the onset of the pull (and threshold) (21), 364
aspects of analysis (22), such as the exponent used for allometric scaling, should be reported, 366
as each are important for accurately interpreting results from the study. 367 368 369 370 References 371
1. Bailey CA, Sato K, Alexander R, Chiang CY, and Stone M. Isometric force production 372
symmetry and jumping performance in collegiate athletes. Journal of Trainology 2: 1-373
5, 2013. 374
2. Bailey CA, Sato K, Burnett A, and Stone MH. Carry-over of force production 375
symmetry in athletes of differing strength levels. J Strength Cond Res. 29: 3188-376
3196, 2015. 377
3. Bailey CA, Sato K, Burnett A, and Stone MH. Force-production asymmetry in male 378
and female athletes of differing strength levels. Int J Sports Physiol Perform. 10: 504-379
508, 2015. 380
4. Bartolomei S, Sadres E, Church DD, Arroyo E, Iii JAG, Varanoske AN, Wang R, 381
Beyer KS, Oliveira LP, Stout JR, and Hoffman JR. Comparison of the recovery 382
response from high-intensity and high-volume resistance exercise in trained men. 383
Eur J Appl Physiol 117: 1287-1298, 2017. 384
5. Beattie K, Carson BP, Lyons M, and Kenny IC. The Effect of maximal- and explosive-385
strength training on performance indicators in cyclists. Int J Sports Physiol Perform 386
12: 470-480, 2017. 387
6. Beckham G, Lamont H, Sato K, Ramsey M, Haff GG, and Stone M. Isometric 388
strength of powerlifters in key positions of the conventional deadlift. Journal of 389
Trainology 1, 2012. 390
7. Beckham G, Mizuguchi S, Carter C, Sato K, Ramsey M, Lamont H, Hornsby G, Haff 391
G, and Stone M. Relationships of isometric mid-thigh pull variables to weightlifting 392
performance. J Sports Med Phys Fitness 53: 573-581, 2013. 393
8. Beckham GK, Sato K, Mizuguchi S, Haff GG, and Stone MH. Effect of body position 394
on force production during the isometric mid-thigh pull. J Strength Cond Res. 32(1): 395
48-56: 18. 396
9. Belkhiria C, De Marco G, and Driss T. Effects of verbal encouragement on force and 397
electromyographic activations during exercise. J Sports Med Phys Fitness 58: 750-398
757, 2018. 399
10. Bemben MG, Clasey JL, and Massey BH. The effect of the rate of muscle contraction 400
on the force-time curve parameters of male and female subjects. Res Q Exerc Sport 401
61: 96-99, 1990. 402
11. Comfort P, Jones PA, McMahon JJ, and Newton R. Effect of knee and trunk angle on 403
kinetic variables during the isometric midthigh pull: test-retest reliability. Int J Sports 404
Physiol Perform 10: 58-63, 2015. 405
12. Comfort P and McMahon JJ. Reliability of maximal back squat and power clean 406
performances in inexperienced athletes. J Strength Cond Res. 29: 3089-3096, 2015. 407
13. Comfort P and Pearson SJ. Scaling--which methods best predict performance? J 408
Strength Cond Res 28: 1565-1572, 2014. 409
14. Comfort P, Thomas C, Dos'Santos T, Jones PA, Suchomel TJ, and McMahon JJ. 410
Comparison of methods of calculating dynamic strength index. Int J Sports Physiol 411
15. Cormie P, McGuigan MR, and Newton RU. Developing maximal neuromuscular 413
power: Part 1--biological basis of maximal power production. Sports Med 41: 17-38, 414
2011. 415
16. Crewther BT, Carruthers J, Kilduff LP, Sanctuary CE, and Cook CJ. Temporal 416
associations between individual changes in hormones, training motivation and 417
physical performance in elite and non-elite trained men. Biol Sport 33: 215-221, 418
2016. 419
17. Davis GR, Gallien GJ, Moody KM, LeBlanc NR, Smoak PR, and Bellar D. Cognitive 420
function and salivary DHEA levels in physically active elderly african american 421
women. Int J Endocrinol 2015: 6, 2015. 422
18. De Witt JK, English KL, Crowell JB, Kalogera KL, Guilliams ME, Nieschwitz BE, 423
Hanson AM, and Ploutz-Snyder LL. Isometric mid-thigh pull reliability and relationship 424
to deadlift 1RM. J Strength Cond Res. 32 (2): 528-533. 2018. 425
19. DeWeese BH, Serrano AJ, Scruggs SK, and Burton JD. The midthigh pull: proper 426
application and progressions of a Weightlifting movement derivative. Strength Cond J 427
35: 54-58, 2013. 428
20. Dobbin N, Hunwicks R, Jones B, Till K, Highton J, and Twist C. Criterion and 429
construct validity of an isometric mid-thigh pull dynamometer for assessing whole 430
body strength in professional rugby league players. Int J Sports Physiol Perform. 431
13(2): 235-239. 2018. 432
21. Dos'Santos T, Jones PA, Comfort P, and Thomas C. Effect of different onset 433
thresholds on isometric mid-thigh pull force-time variables. J Strength Cond Res 31: 434
3467-3473, 2017. 435
22. Dos'Santos T, Jones PA, Kelly J, McMahon JJ, Comfort P, and Thomas C. Effect of 436
sampling frequency on isometric midthigh-pull kinetics. Int J Sports Physiol Perform 437
11: 255-260, 2016. 438
23. Dos'Santos T, Lake JP, Jones PA, and Comfort P. Effect of low pass filtering on 439
isometric mid-thigh pull kinetics. J Strength Cond Res. 32: 983-989, 2018. 440
24. Dos'Santos T, Thomas C, Comfort P, McMahon JJ, Jones PA, Oakley NP, and 441
Young AL. Between-session reliability of isometric mid-thigh pull kinetics and 442
maximal power clean performance in male youth soccer players. J Strength Cond 443
Res Published ahead of print, 2017. 444
25. Dos'Santos T, Thomas C, Jones PA, and Comfort P. Assessing muscle strength 445
asymmetry via a unilateral stance isometric mid-thigh pull. Int J Sports Physiol 446
Perform. 12(4): 505-511. 2017. 447
26. Dos'Santos T, Thomas C, Jones PA, McMahon JJ, and Comfort P. The effect of hip 448
joint angle on isometric mid-thigh pull kinetics. J Strength Cond Res. 31(10):2748-449
2757. 2017 . 450
27. Drake D, Kennedy R, and Wallace E. The validity and responsiveness of isometric 451
lower body multi-joint tests of muscular strength: a systematic review. Sports Med 452
Open 3: 23, 2017. 453
28. Faigenbaum AD, McFarland JE, Herman RE, Naclerio F, Ratamess NA, Kang J, and 454
Myer GD. Reliability of the one-repetition-maximum power clean test in adolescent 455
athletes. J Strength Cond Res 26: 432-437, 2012. 456
29. Gescheit DT, Cormack SJ, Reid M, and Duffield R. Consecutive days of prolonged 457
tennis match play: performance, physical, and perceptual responses in trained 458
players. Int J Sports Physiol Perform. 10: 913-920, 2015. 459
30. Haff GG, Carlock JM, Hartman MJ, Kilgore JL, Kawamori N, Jackson JR, Morris RT, 460
Sands WA, and Stone MH. Force-time curve characteristics of dynamic and isometric 461
muscle actions of elite women olympic weightlifters. J Strength Cond Res 19: 741-462
748, 2005. 463
31. Haff GG, Jackson JR, Kawamori N, Carlock JM, Hartman MJ, Kilgore JL, Morris RT, 464
Ramsey MW, Sands WA, and Stone MH. Force-time curve characteristics and 465
hormonal alterations during an eleven-week training period in elite women 466
32. Haff GG, Ruben RP, Lider J, Twine C, and Cormie P. A comparison of methods for 468
determining the rate of force development during isometric mid-thigh clean pulls. J 469
Strength Cond Res 29: 386-395, 2015. 470
33. Haff GG, Stone M, O'Bryant HS, Harman E, Dinan C, Johnson R, and Han K-H. 471
Force-time dependent characteristics of dynamic and isometric muscle actions. J 472
Strength Cond Res. 11: 269-272, 1997. 473
34. Halperin I, Williams KJ, Martin DT, and Chapman DW. The effects of attentional 474
focusing instructions on force production during the isometric midthigh pull. J 475
Strength Cond Res. 30: 919-923, 2016. 476
35. Helms ER, Zinn C, Rowlands DS, Naidoo R, and Cronin J. High-protein, low-fat, 477
short-term diet results in less stress and fatigue than moderate-protein, moderate-fat 478
diet during weight loss in male Weightlifters: A pilot study. Int J Sport Nutr Exerc 479
Metab. 25: 163-170, 2015. 480
36. Hornsby W, Gentles J, MacDonald C, Mizuguchi S, Ramsey M, and Stone M. 481
Maximum strength, rate of force development, jump height, and peak power 482
alterations in Weightlifters across five months of training. Sports 5: 78, 2017. 483
37. James LP, Beckman EM, Kelly VG, and Haff GG. The neuromuscular qualities of 484
higher and lower-level mixed martial arts competitors. Int J Sports Physiol Perform. 485
12(5): 612-620. 2017. 486
38. James LP, Roberts LA, Haff GG, Kelly VG, and Beckman EM. Validity and reliability 487
of a portable isometric mid-thigh clean pull. J Strength Cond Res 31: 1378-1386, 488
2017. 489
39. Kawamori N, Rossi SJ, Justice BD, Haff EE, Pistilli EE, O'Bryant HS, Stone MH, and 490
Haff GG. Peak force and rate of force development during isometric and dynamic 491
mid-thigh clean pulls performed at various intensities. J Strength Cond Res. 20: 483-492
491, 2006. 493
40. Khamoui AV, Brown LE, Nguyen D, Uribe BP, Coburn JW, Noffal GJ, and Tran T. 494
Relationship between force-time and velocity-time characteristics of dynamic and 495
isometric muscle actions. J Strength Cond Res 25: 198-204, 2011. 496
41. Kraska JM, Ramsey MW, Haff GG, Fethke N, Sands WA, Stone ME, and Stone MH. 497
Relationship between strength characteristics and unweighted and weighted vertical 498
jump height. Int J Sports Physiol Perform. 4: 461-473, 2009. 499
42. Leary BK, Statler J, Hopkins B, Fitzwater R, Kesling T, Lyon J, Phillips B, Bryner RW, 500
Cormie P, and Haff GG. The relationship between isometric force-time curve 501
characteristics and club head speed in recreational golfers. J Strength Cond Res 26: 502
2685-2697, 2012. 503
43. Maffiuletti NA, Aagaard P, Blazevich AJ, Folland J, Tillin N, and Duchateau J. Rate of 504
force development: physiological and methodological considerations. Eur J Appl 505
Physiol 116: 1091-1116, 2016. 506
44. Mangine GT, Hoffman JR, Wang R, Gonzalez AM, Townsend JR, Wells AJ, Jajtner 507
AR, Beyer KS, Boone CH, Miramonti AA, LaMonica MB, Fukuda DH, Ratamess NA, 508
and Stout JR. Resistance training intensity and volume affect changes in rate of force 509
development in resistance-trained men. Eur J Applied Physiol. 116: 2367-2374, 510
2016. 511
45. McGuigan M and Winchester JB. The relationship between isometric and dynamic 512
strength in collegiate football players. J Sports Sci Med 7: 101-105, 2008. 513
46. McGuigan MR, Newton MJ, Winchester JB, and Nelson AG. Relationship between 514
isometric and dynamic strength in recreationally trained men. J Strength Cond Res 515
24: 2570-2573, 2010. 516
47. McGuigan MR, Winchester JB, and Erickson T. The importance of isometric 517
maximum strength In college wrestlers. J Sports Sci Med. 5: 108-113, 2006. 518
48. Moran J, Sandercock GRH, Ramírez-Campillo R, Wooller J-J, Logothetis S, 519
Schoenmakers PPJM, and Parry DA. Maturation-related differences in adaptations to 520
resistance training in young male swimmers. J Strength Cond Res. 32(1): 139-149. 521
49. Nuzzo JL, McBride JM, Cormie P, and McCaulley GO. Relationship between 523
countermovement jump performance and multijoint isometric and dynamic tests of 524
strength. J Strength Cond Res 22: 699-707, 2008. 525
50. Oranchuk DJ, Robinson TL, Switaj ZJ, and Drinkwater EJ. Comparison of the hang 526
high-pull and loaded jump squat for the development of vertical jump and isometric 527
force-time characteristics. J Strength Cond Res. Publish Ahead of Print, 2017. 528
51. Painter KB, Haff GG, Ramsey MW, McBride J, Triplett T, Sands WA, Lamont HS, 529
Stone ME, and Stone MH. Strength gains: block versus daily undulating periodization 530
weight training among track and field athletes. Int J Sports Physiol Perform 7: 161-531
169, 2012. 532
52. Secomb JL, Farley OR, Lundgren L, Tran T, King A, Nimphius S, and Sheppard J. 533
Associations between the performance of scoring manouvres and lower-body 534
strength and power in elite surfers. Int J Sports Sci Coach 10: 911-918, 2015. 535
53. Secomb JL, Lundgren LE, Farley OR, Tran TT, Nimphius S, and Sheppard JM. 536
Relationships between lower-body muscle structure and lower-body strength, power, 537
and muscle-tendon complex stiffness. J Strength Cond Res 29: 2221-2228, 2015. 538
54. Secomb JL, Nimphius S, Farley OR, Lundgren L, Tran T, and Sheppard J. 539
Relationships between lower-body muscle structure and, lower-body strength, 540
explosiveness and eccentric leg stiffness in adolescent athletes. J Sports Sci Med 541
14: 691-697, 2015. 542
55. Seitz LB, Reyes A, Tran TT, de Villarreal ES, and Haff GG. Increases in lower-body 543
strength transfer positively to sprint performance: a systematic review with meta-544
analysis. Sports Med 44 1693-1702, 2014. 545
56. Sheppard J, Chapman D, and Taylor K. An evaluation of a strength qulities 546
assessment method for the lower body. JASC 19: 4-10, 2011. 547
57. Sjokvist J, Sandbakk O, Willis SJ, Andersson E, and Holmberg HC. The effect of 548
incline on sprint and bounding performance in cross-country skiers. J Sports Med 549
Phys Fitness 55: 405-414, 2015. 550
58. Spiteri T, Newton RU, and Nimphius S. Neuromuscular strategies contributing to 551
faster multidirectional agility performance. J Electromyogr Kinesiol 25: 629-636, 552
2015. 553
59. Spiteri T, Nimphius S, Hart NH, Specos C, Sheppard JM, and Newton RU. 554
Contribution of strength characteristics to change of direction and agility performance 555
in female basketball athletes. J Strength Cond Res 28: 2415-2423, 2014. 556
60. Stone MH, Sands WA, Carlock J, Callan S, Dickie D, Daigle K, Cotton J, Smith SL, 557
and Hartman M. The importance of isometric maximum strength and peak rate-of-558
force development in sprint cycling. J Strength Cond Res 18: 878-884, 2004. 559
61. Street G, McMillan S, Board W, Rasmussen M, and Heneghan JM. Sources of error 560
in determining countermovement jump height with the impulse method. J Appl 561
Biomech 17: 43-54, 2001. 562
62. Suchomel TJ, Lamont HS, and Moir GL. Understanding vertical jump potentiation: a 563
deterministic model. Sports Med 46: 809-828, 2016. 564
63. Suchomel TJ, Nimphius S, and Stone MH. The importance of muscular strength in 565
athletic performance. Sports Med 46: 1419-1449, 2016. 566
64. Thomas C, Comfort P, Chiang CY, and Jones PA. Relationship between isometric 567
mid-thigh pull variables and sprint and change of direction performance in collegiate 568
athletes. Journal of Trainology 4: 6-10, 2015. 569
65. Thomas C, Dos’Santos T, Comfort P, and Jones P. Between-session reliability of 570
common strength- and power-related measures in adolescent athletes. Sports 5: 15, 571
2017. 572
66. Thomas C, Jones PA, and Comfort P. Reliability of the dynamic strength index in 573
collegiate athletes. Int J Sports Physiol Perform 10: 542-545, 2015. 574
67. Thomas C, Jones PA, Rothwell J, Chiang CY, and Comfort P. An Investigation into 575
the relationship between maximum isometric strength and vertical jump performance. 576
68. Tran TT, Lundgren L, Secomb J, Farley ORL, Haff GG, Seitz LB, Newton RU, 578
Nimphius S, and Sheppard JM. Comparison of physical capacities between 579
nonselected and selected elite male competitive surfers for the national junior team. 580
Int J Sports Physiol Perform 10: 178-182, 2015. 581
69. Wang R, Hoffman JR, Tanigawa S, Miramonti AA, La Monica MB, Beyer KS, Church 582
DD, Fukuda DH, and Stout JR. Isometric mid-thigh pull correlates with strength, 583
sprint, and agility performance in collegiate rugby union players. J Strength Cond 584
Res 30: 3051-3056, 2016. 585
70. Welch N, Moran K, Antony J, Richter C, Marshall B, Coyle J, Falvey E, and Franklyn-586
Miller A. The effects of a free-weight-based resistance training intervention on pain, 587
squat biomechanics and MRI-defined lumbar fat infiltration and functional cross-588
sectional area in those with chronic low back. BMJ Open Sport & Exercise Medicine 589
1, 2015. 590
71. West DJ, Owen NJ, Jones MR, Bracken RM, Cook CJ, Cunningham DJ, Shearer DA, 591
Finn CV, Newton RU, Crewther BT, and Kilduff LP. Relationships between force-time 592
characteristics of the isometric midthigh pull and dynamic performance in 593
professional rugby league players. J Strength Cond Res 25: 3070-3075, 2011. 594
72. Whittington J, Schoen E, Labounty LL, Hamdy R, Ramsey MW, Stone ME, Sands 595
WA, Haff GG, and Stone MH. Bone mineral density and content of collegiate 596
throwers: influence of maximum strength. J Sports Med Phys Fitness 49: 464-473, 597
2009. 598
73. Winchester J, McGuigan MR, Nelson AG, and Newton M. The relationship between 599
isometric and dynamic strength in college aged males. J Strength Cond Res 24: 1, 600
2010. 601
74. Winchester JB, McBride JM, Maher MA, Mikat RP, Allen BK, Kline DE, and 602
McGuigan MR. Eight weeks of ballistic exercise improves power independently of 603
Author Biographies: 632
633
Paul Comfort is a Reader in Strength and Conditioning and the programme leader for the 634
Masters in Strength and Conditioning at the University of Salford. 635
George Beckham is an assistant professor in the Kinesiology Department at California State 636
University, Monterey Bay. 637
Tom Dos’Santos is a Doctoral student in Biomechanics and Strength and Conditioning at the 638
University of Salford. 639
Stuart Guppy is a Master’s candidate in the area of Sports Science at Edith Cowan 640
University. 641
Michael H. Stone is Professor, Graduate Coordinator and Exercise and Sport Science 642
Laboratory Director in the Department of Sport, Exercise, Recreation and Kinesiology at 643
East Tennessee State University. 644
G. Gregory Haff is the Course Coordinator for the Masters of Exercise Science (Strength 645
and Conditioning) at Edith Cowan University and served as the President of the National 646