R E S E A R C H
Open Access
Non-genotoxic carcinogen exposure induces
defined changes in the 5-hydroxymethylome
John P Thomson
1,6, Harri Lempiäinen
2,6, Jamie A Hackett
1,6, Colm E Nestor
1,3, Arne Müller
2, Federico Bolognani
2,
Edward J Oakeley
5, Dirk Schübeler
4, Rémi Terranova
2, Diana Reinhardt
1,3,6, Jonathan G Moggs
2,6*and
Richard R Meehan
1,6*Abstract
Background:Induction and promotion of liver cancer by exposure to non-genotoxic carcinogens coincides with epigenetic perturbations, including specific changes in DNA methylation. Here we investigate the genome-wide dynamics of 5-hydroxymethylcytosine (5hmC) as a likely intermediate of 5-methylcytosine (5mC) demethylation in a DNA methylation reprogramming pathway. We use a rodent model of non-genotoxic carcinogen exposure using the drug phenobarbital.
Results:Exposure to phenobarbital results in dynamic and reciprocal changes to the 5mC/5hmC patterns over the promoter regions of a cohort of genes that are transcriptionally upregulated. This reprogramming of 5mC/5hmC coincides with characteristic changes in the histone marks H3K4me2, H3K27me3 and H3K36me3. Quantitative analysis of phenobarbital-induced genes that are involved in xenobiotic metabolism reveals that both DNA modifications are lost at the transcription start site, while there is a reciprocal relationship between increasing levels of 5hmC and loss of 5mC at regions immediately adjacent to core promoters.
Conclusions:Collectively, these experiments support the hypothesis that 5hmC is a potential intermediate in a demethylation pathway and reveal precise perturbations of the mouse liver DNA methylome and
hydroxymethylome upon exposure to a rodent hepatocarcinogen.
Background
Methylation of the fifth carbon of a cytosine base (5-methylcytosine (5mC)) in the dinucleotide sequence CpG is a well-established epigenetic modification of vertebrate DNA thought to have important roles in the preservation of genomic integrity, allele-specific expression of imprinted genes, maintenance of X-chromosome inacti-vation in females, tissue-specific gene regulation and long-term silencing of genes and retrotransposable ele-ments [1,2]. Until recently, incorporation of a methyl group was thought to be the only form of direct DNA modification in the mammalian genome. However, land-mark studies by two groups in 2009 re-discovered the
modified base 5-hydroxymethylcytosine (5hmC) in mouse purkinje cells and granule neurons [3,4], a mark initially found over 50 years ago in T2 phage [5]. Shortly after this work, it was shown that a group of enzymes belonging to the TET family (TET1,2 & 3) of Fe(II) and
a-KG-dependent dioxygenases utilize molecular oxygen to transfer a hydroxyl group to 5mC to form 5hmC [4,6-9]. In human cancers, the TET genes were found to exhibit a substantial reduction in their expression levels with global loss of 5hmC in tumors relative to surround-ing tissue [10]. Recently, several studies have focused on one of these enzymes, TET2. Not only was this enzyme found to be frequently mutated or inhibited in many human acute myeloid leukemias, but its inactivation cor-relates with a hypermethylation phenotype [11-13]. These observations fit with a mechanism whereby the deposition of 5hmC at promoters can subsequently lead to demethylation of DNA, in a dynamic cycle of DNA demethylation and re-methylation, perhaps mediated by DNA glycosylases [14,15]. In support of this, inhibition of * Correspondence: [email protected]; [email protected].
ac.uk 1
MRC Human Genetics Unit, Institute of Genetics and Molecular Medicine, University of Edinburgh, Western General Hospital, Edinburgh EH4 2XU, UK 2
Investigative Toxicology, Preclinical Safety, Translational Sciences, Novartis Institute for Biomedical Research, Lichtstrasse 35, CH-4057 Basel, Switzerland Full list of author information is available at the end of the article
TET1 function in embryonic stem cells also leads to accumulation of DNA methylation at CpG-rich regions [16-18].
The genome-wide patterns of 5hmC have been described for both cultured cells [16-25] and tissues [26-29] with the general consensus that 5hmC-marked DNA is enriched over the bodies of expressed genes as well as at enhancer elements. When dynamically present at CpG-abundant promoter regions 5hmC may function as part of a demethylation pathway that promotes a methylation-free state, possibly through base excision repair pathways [30,31]. Recent work investigating epige-netic reprogramming events in the mouse zygote support this hypothesis through the finding that the rapid active demethylation seen in the paternal pro-nuclei is accompa-nied by an accumulation of genome-wide 5hmC and its derivatives in the absence of cell division [6,32,33].
A reprogramming mechanism for DNA methylation may also underpin the molecular changes that occur dur-ing the development of non-genotoxic carcinogen (NGC)-induced carcinogenesis [34-36] via the mis-expression of genes that promote liver tumor formation [34,35,37-39]. Several NGCs directly regulate nuclear receptors, includ-ing the constitutive androstane receptor (CAR; also known as nuclear receptor subfamily 1 group I member 3 (Nr1i3)) and peroxisome proliferator activated receptor alpha (Ppara), which mediate the transcriptional regula-tion of enzymes involved in response to drug exposure [40]. Many nuclear receptors, including PPARg, interact with the DNA repair protein thymine DNA glycosylase (TDG), which can potentially mediate DNA demethylation at target genes by base excision repair mechanisms [15,33,41,42].
In a recent study, we reported that liver-specific changes at the DNA methylation level occur in a subset of mouse gene promoters following 28-day exposure to the well-studied NGC phenobarbital (PB) [43]. Locus-specific changes in histone modifications and loss of 5mC was observed at some of these promoter regions, which was coupled to an increase in the transcriptional activity of associated genes. Together this suggests that PB exposure can transduce an epigenetic switch from a repressive to an active chromatin state at selected target genes. Here, we map on tiled arrays the 5mC and 5hmC genomic patterns in both control and 28-day PB exposed mouse livers to examine the dynamic relationship between these two marks and their perturbation upon NGC exposure. In addition, we performed genome wide chromatin immunoprecipitation (ChIP) sequencing (ChIP-seq) to investigate PB-induced changes of three histone modifications, H3K4me2 (histone H3 lysine 4 di-methylation), H3K27me3 (histone H3 lysine 27 methylation) and H3K36me3 (histone H3 lysine 36 tri-methylation). Our hypothesis is that changes in 5hmC
profiles may be associated with PB-induced transcrip-tional remodeling in the liver. We find that chromatin modifications and the profiles of 5hmC and 5mC are pharmacologically perturbed over a subset of genes in a transcription-associated manner following continuous 28-day PB exposure. Together, these integrated epige-nomic and transcriptomic profiling data provide novel insight into the molecular responses to a rodent hepato-carcinogen and may ultimately underpin the identifica-tion of novel early biomarkers for NGCs.
Results and discussion
Genomic distribution of 5mC- and 5hmC-marked DNA in the mouse liver
A 5hmC DNA immunoprecipitation assay (HmeDIP) was carried out on DNA from groups of control and PB-trea-ted animals (each n = 5) using a highly specific anti-5hmC antibody (Additional file 1a,b). Enrichment was validated using quantitative PCR (qPCR) at candidate loci previously identified as being marked by the 5hmC modi-fication [26] (Additional files 2 and 3). The 5hmC-enriched fractions were then applied to a large-scale promoter tiling-array (Nimblegen 2.1M Deluxe Promoter Array) to generate a representative pattern of the 5hmC landscape in mouse liver. The same procedure was repeated on the same DNA samples with an anti-5mC antibody (methylated DNA immunoprecipitation (MeDIP)) [44], allowing a direct comparison of the two DNA modifications. The 28-day 5hmC and 5mC raw data files have been deposited with Gene Expression Omnibus (GEO series number [GSE40540]).
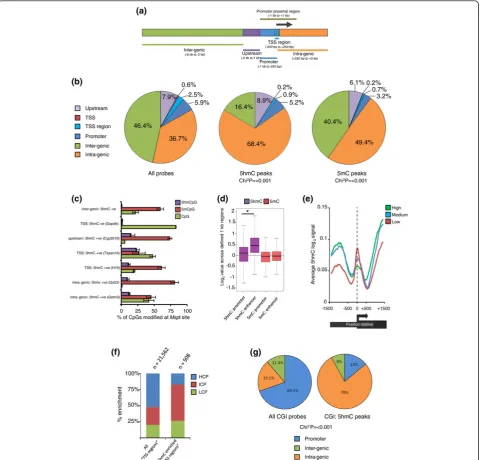
whilst average levels of both 5mCpG (approximately 48%) and non-modified CpG (approximately 37%) were consid-erably higher. In agreement with the peak-based analysis (Additional file 4), 5hmC levels were (rofl)low (<2% of CpGs) over both an inter-genic region on chromosome 7 as well the TSS region ofGapdhbut enriched (10 to 15%) over two intra-genic regions (Gstt3 and Gstm3) and a region upstream of theCyp2b10promoter.
As studies have shown that 5hmC-modified DNA is par-ticularly enriched at enhancer elements in cultured cells [19,22,23], we expanded our analysis to investigate such sites present on our array. Of the 23,556 probes covering defined enhancers on our array, 15.4% overlapped with peaks of 5hmC whilst only 1.5% overlapped with peaks of 5mC (Additional file 6). Extension of this analysis revealed that, on average, 1 kb long enhancer regions present on the array contained significantly more 5hmC than was found over the defined promoter regions (Figure 1d; P-value < 0.001) whilst no such difference was observed for the 5mC mark. Finally, as the array does not contain repetitive DNA, we also tested these regions directly by standard qPCR to determine the relative enrichment of both 5hmC and 5mC over major satellites, LINEs and intracisternal A-particle (IAP) elements (Additional file 7). As expected from previously published work [18,28] major satellites, LINEs and IAP elements are enriched for 5mC, but not 5hmC, confirming that the 5hmC genomic frac-tion is limited to non-repetitive regions.
5hmC enrichment at promoters and gene bodies is linked to transcriptional state
Recent studies have revealed that the levels of 5hmC over promoters and within gene bodies correlate with tran-scriptional activity in embryonic stem cells [16,17,20,21] and both human and mouse tissue [26-29]. To test this for the first time in the mouse liver, average 5hmC profiles were plotted around the TSS and flanking regions (TSS ± 1.5 kb) of genes with high, medium and low levels of expression (Figure 1e). On average, promoters associated with low levels of gene expression marked with higher levels of the 5hmC modification directly over the TSS than was found over the promoters of highly expressed genes, indicating that the distribution of promoter 5hmC in the mouse liver is associated with the relative levels of transcriptional activity. Although the majority of the probes on the array map specially to promoter regions, a series of short genes (n = 775, <3 kb in total length) were also covered in their entirety, which allowed for the analy-sis of 5hmC patterns through the bodies of genes. The dis-tribution of 5hmC at the TSS of this subset of short genes is consistent with the genome-wide distribution, whilst an enrichment of 5hmC is seen in the body of these genes in a transcription-associated manner (Figure 1e; Additional file 8).
5hmC is enriched at the TSS of a subset of intermediate CpG promoters
Although the majority of genes reveal depletion of 5hmC in the regions surrounding their TSS, a subset (n = 508 genes) was found to contain an enrichment of the modifi-cation over these regions (Additional files 9 and 10). Inde-pendent verification by‘EpiMark’qPCR revealed that the levels of 5hmC enrichment at two unique TSS regions (H19 and Tspan10) surpass those observed over the upstream and intra-genic regions tested (Figure 1c). Based on expression profiling data, these genes exhibit lower levels of transcription than the average of all genes on the array (Additional file 11), which is in agreement with the earlier observation that genes with higher levels of 5hmC over their TSS tended to be lowly expressed (Figure 1e; Additional file 8). Furthermore, genes with 5hmC-marked TSS regions also contain a slight but significant (Fisher’s exact test,P< 0.001) enrichment for genes involved in tis-sue-specific patterns of expression (Additional file 12). In agreement with earlier studies, sequences associated with 5hmC-marked TSS regions were largely (56.5%) found to be of an intermediate CpG density (these sequences are termed ICPs; 1 to 5 CpGs per 100 bp; Figure 1f) [16,21]. Interestingly, the 5hmC-enriched TSS regions are also marked with higher levels of 5mC than is found at all genes (Willcox test, P < 0.001; Additional file 11). Although the biological relationship between CpG density and 5hmC levels is unclear, it may reflect the fact that CpG-rich regions tend to be largely maintained in a non-modified state (such as at CpG islands;‘CGIs’) whilst ICPs are often methylated in a tissue-specific manner [45].
CpG islands marked by 5hmC tend to be non-promoter-associated
5hmC-marked regions are associated with an active chromatin state
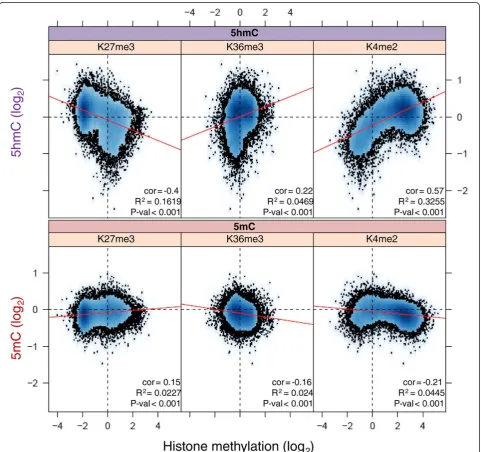
The patterns of promoter and gene body H3K4me2, H3K27me3 and H3K36me3 levels were determined by genome-wide ChIP-seq profiling on control livers (n = 2) to investigate potential links to associated promoter 5hmC and 5mC levels (Figure 2). Average promoter H3K4me2 signals reveal a striking correlation with promoter 5hmC values (Pearson correlation = 0.57,P-value < 0.001); this correlation occurs to a lesser degree with gene body
[image:5.595.58.540.228.680.2]H3K36me3 signals (Pearson correlation = 0.22,P-value = 0.001). As these histone modifications are typically asso-ciated with euchromatic regions of the genome, this indi-cates that the 5hmC modification may be associated with active chromatin states over both the promoters and the bodies of genes. In addition, there was a strong anti-corre-lation between promoter 5hmC levels and gene body H3K27me3 signals (Pearson correlation = -0.4,P-value = < 0.001). Although promoter 5mC signals have far weaker correlations to the histone modifications, they are opposite
to those observed for the 5hmC mark, indicating that these two marks are functionally distinct.
Phenobarbital induces perturbations of 5hmC and 5mC at selective promoter regions in liver
The epigenetic landscape is highly dynamic and often found to be perturbed by xenobiotics, including NGCs [34,35,43,47]. We previously investigated the effects of 28-day exposure to the widely studied NGC PB on 5mC levels over promoter regions (TSS -800/+100 bp), and found that promoter 5mC levels were reduced over a small subset of PB-induced genes in the mouse liver [43]. Given the proposed role for the 5hmC modification as an intermediate in a demethylation pathway, we used the high coverage promoter arrays to investigate if 28-day exposure to PB alters 5hmC patterns globally and specifi-cally over promoter proximal regions (PPRs; Figure 1a). To characterize chromatin dynamics and their perturba-tions upon PB exposure, we also performed ChIP-seq for H3K4me2, H3K27me3 and H3K36me3 histone modifica-tions along with Affymetrix gene expression analysis on the same tissue samples.
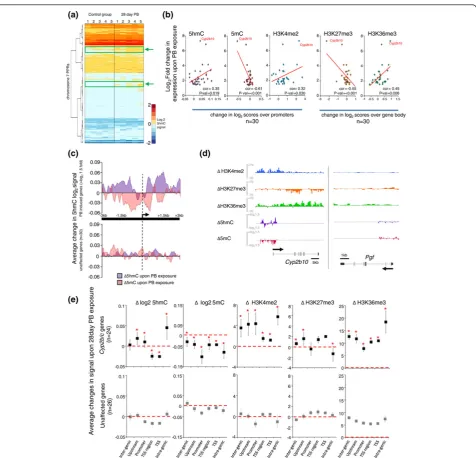
Globally we find that the majority of genes do not undergo any significant change in expression upon PB exposure and this was reflected in the fact that both DNA and histone modifications were also largely un-altered across the majority of PPRs (Figure 3a; Additional files 15, 16, 17, and 18). Furthermore, analysis of the enhancer elements present on the array also revealed no change in both 5hmC and 5mC modified DNA at these loci following drug treatment (Additional file 19). Although the majority of promoter proximal regions do not reveal dramatic changes in their epigenetic state upon PB exposure, select PPRs do show reproducible perturbations in 5hmC levels across multiple individual livers, albeit at relatively low levels (Figure 3a, green boxes/arrows).
To better understand the dynamics of 5hmC and 5mC levels across PPRs following PB-induced gene activation, the changes in the DNA and histone modifications were plotted against 30 genes that did show a clear increase in their expression levels following 28-day PB exposure (>log21.5-fold induction; Figure 3b; Additional file 16, red boxes). This analysis revealed a relationship between a gain of 5hmC levels (Pearson correlation = 0.35,P-value = 0.019) over the PPRs of induced genes along with a loss of 5mC (Pearson correlation = 0.61,P-value = < 0.001). This reciprocal gain in 5hmC/loss in 5mC also corresponds to a general change in the chromatin configuration over these induced genes with increases seen in PPR H3K4me2 levels (Pearson correlation = 0.32,P-value = 0.030) and gene body H3K36me3 levels (Pearson correlation = 0.45, P-value = 0.0063). In contrast, gene body levels of the H3K27me3 modification, often associated with silencing
events [43,48,49], are reduced at many PB-induced genes (Pearson correlation = -0.55,P-value < 0.001). As a con-trol, the relationships between these marks and the expression levels of 30 genes that exhibited no transcrip-tional change following PB exposure revealed far lower Pearson correlation scores and no significant P-value scores (Additional file 20). From this analysis we conclude that an epigenetic switch takes place at the PPRs of genes activated by 28-day PB treatment in liver. Typically, PB induction of gene expression is accompanied by a loss of promoter 5mC, with an associated gain in promoter 5hmC levels (Additional file 21), which may represent an intermediate in a demethylation pathway.
To more accurately determine where the changes in both 5hmC and 5mC occur over the PPRs of the PB-induced genes, the average signal changes were plotted relative to the TSS over a ±3 kb window. The induced genes reveal a striking pattern of 5mC loss over the entire region, as well as a strong enrichment in 5hmC signal (Figure 3c, top panel). The changes in the two modifica-tions were often seen to directly oppose each other, which may represent a replacement of the 5mC modifica-tion by the 5hmC form. Although regions outside of the core promoter experience a large increase in 5hmC, the regions surrounding the TSS show both a dramatic loss in both 5hmC and 5mC levels. As the promoters of active genes are typically non-methylated, this may represent a complete demethylation event. In contrast, the promoter regions of unaffected genes do not reveal any significant change in either mark upon PB exposure (Figure 3c, lower panel). It will be important through subsequent work to evaluate the functional significance of these changes in both 5hmC and 5mC over the regions that span the core of the promoter.
PB treatment leads to dynamic transcriptional and DNA methylation (5mC/5hmC) changes at xenobiotic metabolism genes in liver
[55]. Nevertheless,Cyp2b10mis-expression is observed in a subset of liver tumors that occur after the initial inducer compound has been withdrawn or arose in the absence of exposure to PB [54,56,57]. Liver tumors that are glutamine synthetase-positive and mutated inb -cate-nin show concomitantly elevatedCyp2b10 expression [58]. We previously reported that the promoter region of Cyp2b10is hypomethylated and associated with strong transcriptional induction following 28-day treatment with PB [43]. Here we find that the promoter region not only becomes hypomethylated (Figure 3d, red) upon PB treatment, but that these regions display a reciprocal increase in the levels of 5hmC (Figure 3d, purple). These reciprocal changes are also seen outside of promoter regions as far as 7 kb upstream of the TSS and 2 kb downstream (Figure 3d). In addition, the chromatin environment around this locus is dramatically altered upon PB exposure with histone marks conducive to gene activation events, such as promoter H3K4me2 (Figure 3d, blue) and gene body H3K36me3 (Figure 3d, green), increasing over the Cyp2b10locus, whilst gene body H3K27me3 levels decrease (Figure 3d, orange). This locus appears to be one of the most dynamic regions in terms of 5hmC, 5mC and histone modification changes, and taken together with the finding that this gene shows the largest increase in gene expression, may correspond to the catalytic conversion of 5mC to 5hmC as part of a potential demethylation process.
To further investigate where the changes in the levels of 5hmC, 5mC and histone modification occur over the Gst and Cyp2b and 2c families, average changes for these marks were calculated across the genomic regions outlined earlier (Figure 1a) and compared to genes dis-playing no change in gene expression upon PB exposure (Figure 3e). Using this approach we found significant increases in 5hmC levels at the upstream, promoter and gene body regions of the two gene families, with the most striking examples of epigenetic change observed over theCypfamily of genes (Figure 3e; Additional files 23 and 24). Through this analysis we discovered that the largest perturbation of the 5hmC mark occurred at the intra-genic regions of theCyp2band 2cgenes (36-fold enriched compared to gene body 5hmC levels over a similar number of genes unaffected by PB exposure, Willcox test,P-value 2.44E-10). Additionally, there was a significant reduction in both 5hmC and 5mC levels over the DNA around the TSS, which may represent a total demethylation event (Willcox test, P-value = 5.37E-06; Figure 3b). Analysis of the histone modifica-tions changes over these two gene families revealed that H3K4me2 levels were increased across the upstream, promoter and intra-genic regions of both families upon PB treatment, whilst H3K27me3 levels were reduced over the promoters of both families and strongly
reduced over the bodies of the Cyp2b and 2c genes. Finally, PB-induced increases in H3K36me3 levels were largely observed over the upstream and intra-genic regions of the Cyp2b/2candGstgenes. Together, these data reveal extensive pharmacologic perturbation of the mouse liver epigenome by a non-genotoxic carcinogen and identify reciprocal changes in 5mC and 5hmC pat-terns over the promoter regions of a subset of genes induced by PB.
Prolonged stimulation by PB reciprocally perturbs 5hmC and 5mC patterns at theCyp2b10promoter, resulting in a demethylation event
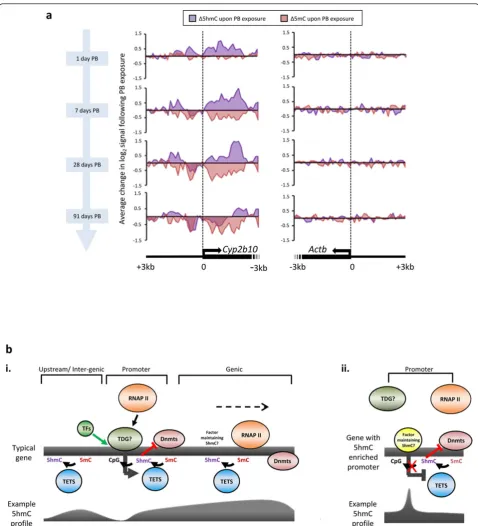
As the promoter of theCyp2b10gene displayed particu-larly dramatic changes in both 5mC and 5hmC signals following 28-day PB exposure, we wished to investigate this perturbation following short-term PB dosing (1 day, 7 days PB treatment) and longer duration drug treatment (91 day exposure). At all time points tested both the 5hmC and 5mC patterns reveal striking reciprocal changes following PB exposure (Figure 4a), in keeping with earlier observations (Figure 3c). It was noted that prolonged drug treatment (91 day exposure) resulted in the loss of both 5mC and 5hmC from the core of the promoter region. Therefore, prolonged stimulation of the drug response geneCyp2b10by PB appears to result in the generation of an unmethylated CpG island through a 5hmC intermediate, which would facilitate high levels of expression at this locus. Further work investigating the perturbations to the transcriptome and epigenome fol-lowing shorter doses of PB would elucidate the mechan-isms of epigenetic change prior to and following activation of gene expression.
Conclusions
implies that distinct tissue-specific patterns of 5hmC are partly dependent on transcriptional differences.
Upon 28-day exposure to PB a group of genes (approximately 300) exhibited small but significant changes in gene expression whilst a subset of these (n = 30), typically with roles in drug response, were highly induced. Here we show that there is a strong correlation between increasing levels of 5hmC and decreasing levels of 5mC over the promoters of highly induced genes. Furthermore, these induced genes show characteristic changes in histone marks representing a move to a euchromatic state, which would facilitate transcription. The observed changes in the levels of promoter 5hmC and 5mC reveal that they are frequently reciprocal and tend to occur outside of the core promoter (Figure 3c). Regional differences in promoter 5mC levels have also been noted by others during differentiation [60]. Previous work reveals that, upon 28-day PB exposure, the 5mC modification is significantly reduced over regions span-ning the TSS of theCyp2b10gene [43]. In this study, we expand upon this observation to reveal that although dynamic changes in both 5hmC and 5mC are occurring over promoter proximal regions, both marks are lost over regions surrounding the TSS, representing complete demethylation. Furthermore, this loss is all the more striking following prolonged drug exposure (91-day PB treatment; Figure 4a). This result implies that TSS regions may be bound by specific factors capable of com-pleting the demethylation pathway (from 5mC via 5hmC to C). These factors may largely be promoter specific as the majority of 5hmC is seen outside these regions, resid-ing within the bodies of actively transcribed genes (Figure 4b). It is possible that the transcriptional machinery itself can in some way maintain the 5hmC levels in these genic regions; however, although studies have shown that tran-scriptional elongation efficiency is high in DNA marked by 5hmC [61], the direct relationship between the tran-scriptional machinery and the maintenance of the 5hmC mark remains untested. Aside from the replication machinery, a strong candidate for a promoter-specific factor capable of removing the 5hmC would be TDG, which is able to directly remove the newly formed 5-hydroxymethyluracil by base excision repair [30,62] (Figure 4b). This would ultimately result in the conver-sion to a non-modified cytosine base (Figure 4a). Alterna-tively, further oxidation of 5hmC to 5-formylcytosine or 5-carboxylcytosine may provide suitable substrates for demethylation to non-modified cytosine via TDG-coupled base excision repair [9,15,33]. Although MBD4 and TDG could potentially remove 5-hydroxymethylura-cil resulting from deamination of 5hmC, it has been recently shown that AID/APOBEC deaminases have sub-stantially reduced activity toward 5hmC-containing tem-plates compared to 5mC-containing counter parts, which
would appear to rule out this pathway [63,64]. TDG has also been shown to play a critical role in the regulation of transcription through its interaction with transcription factors, nuclear receptors and the histone acetyl-trans-ferases Crebbp and Ep300 [42,65,66]. The potential tar-geting of TDG through its interaction with nuclear receptors such as CAR may account for the locus-specific changes in 5hmC that occur in concert with PB-induced expression changes in liver (Figures 3c and 4a). It will be of interest to study this further in CAR null mice and mutants that contain the human CAR [67].
In conclusion, changes in 5hmC- and 5mC-modified DNA upon transcriptional activation by PB may repre-sent an intermediate step in a demethylation pathway resulting in the presence of unmodified CpGs over core promoter regions. Further analysis of the dynamic changes in epigenetic marks associated with early tran-scriptional responses to PB, their long-term plasticity and status in PB-induced liver tumors will lead to a greater understanding of mechanisms of non-genotoxic carcino-genesis. Ultimately, if our observations are replicated in other NGC exposure models, this may lead to the identi-fication of candidate epigenetic biomarkers for enhanced cancer risk assessment.
Materials and methods
Ethics statement
This study was performed in conformity with the Swiss Animal Welfare Law and specifically under the Animal Licenses No. 2345 by‘Kantonales Veterinäramt Basel-Stadt (Cantonal Veterinary Office, Basel) and No. 5041 by‘Kantonales Veterinäramt Baselland’(Cantonal Veter-inary Office, Basel Land).
Animal treatment and sample preparation
Male B6C3F1/Crl (C57BL/6♂× C3H/He♀) mice 29 to 32 days old were obtained from Charles River Laboratories (Germany). Animals were allowed to acclimatize for 5 days prior to being randomly divided into two treatment groups of five animals each. 0.05% (w/v) PB (Sigma-Aldrich, St Louis, MO, USA) was administered to one group through ad libitumaccess to drinking water for either 1, 7, 28 or 91 days. Mice were checked daily for activity and behavior and sacrificed on the last day of dosing depending on the dosage group. Livers were removed prior to freezing in liquid nitrogen and -80°C storage.
Dot blot analysis of 5hmC antibodies
Liege, Belgium) diluted 1:4,000 in tris-buffered saline (TBS) and Western Blocking reagent (Roche Diagnostic, Mannheim, Germany), or with the anti-5hmC polyclonal antibody diluted 1:5,000 (Active Motif, La Hulpe, Belgium) followed by anti-rat horse radish peroxidase (Cell Signal-ling Technology, Boston, USA) and anti-mouse horse rad-ish peroxidase (Sigma-Aldrich, Dorset, UK) prior to exposing the membrane to Image Quant (Image Quant LAS 4000; GE Healthcare, Bucks, UK). A duplicate mem-brane was produced for the DNA loading control and probed with anti-single stranded DNA 0.2μg/μl (Demedi-tec Diagnostics, Kiel-Wellsee, Germany) diluted 1:3,000 raised against rabbit.
HmeDIP and MeDIP protocol
Genomic DNA from mouse liver tissue samples was extracted by overnight proteinase K digestion (Sigma) in lysis buffer (50 mM Tris-HCl pH 8.0, 10 mM EDTA pH 8.0, 0.5% SDS) prior to phenol-chloroform extraction, ethanol precipitation and RNaseA digestion. Genomic DNA was sonicated (Bioruptor, Diagenode) to produce DNA fragments ranging in size from 300 to 1,000 bp, with a mean fragment size of around 500 bp. Fragmented DNA (4μg for HmeDIP and 6μg for MeDIP) was then dena-tured for 10 minutes at 95°C and immunoprecipitated for 3 h at 4°C either with 1μl of rabbit polyclonal antibody against 5-hydroxymethylcytosine (Active motif, La Hulpe, Belgium; cat#39769) or with 15μl mouse monoclonal antibody against 5-methylcytidine (Eurogentec, Seraing, Belgium; #BI-MECY-1000) in a final volume of 500 μl immunoprecipitation (IP) buffer (10 mM sodium phos-phate (pH 7.0), 140 mM NaCl, 0.05% Triton X-100). This mixture was incubated with 60μl of magnetic M-280 pro-tein G Dynabeads (Invitrogen, Grand island, NY, USA; #100-03D) for 2 h prior to washing all unbound fragments three times with 1 ml IP buffer. Washed beads were then resuspended in 250μl of lysis buffer and incubated with proteinase K for 2 h at 50°C. Immunoprecipitated DNA fragments were then purified by passing through DNA purification columns (Qiagen, Venlo, Netherlands) and eluting into 20μl TE. For qPCR analysis, 10μl were taken and diluted to 100μl in TE with each qPCR reaction using 2 to 3μl of diluted DNA. For microarray analysis, 10μl of immunoprecipitated DNA was subjected to whole genome amplification (WGA) using the WGA2:GenomePlex Com-plete Whole Genome Kit (Sigma) and 6μg of amplified material sent to Roche Nimblegen (Iceland) for Cy3 and Cy5 labeling and hybridization on 2.1M Deluxe mouse promoter tiling arrays.
H3K4me2/H3K27me3/H3K36me3 native ChIP for genome-wide sequencing
Frozen mouse liver (150 mg) was isolated and ground into a fine powder using with Covaris Cryoprep (Covaris
Inc., woburn, Massachusetts, USA). Nuclei were isolated by centrifugation through a 1.2M sucrose cushion prior to micrococcal nuclease (Sigma) fractionation into pri-marily mono- and di-nucleosomal fragments. For each histone mark, 100μg of chromatin was used and 10% of the input taken prior to immunoprecipitation.
The immunoprecipitation, washes and DNA purifica-tion were done with Magna ChIP™A Chromatin Immu-noprecipitation Kit (Millipore, Billerica, Massachusetts, USA; #17-610) following the manufacturer’s protocol
DNA (0.9μg) for the input samples and 0.018μg for the K4 and K27 samples were end-repaired and ligated to Illumina genomic DNA adapters according to the manu-facturer’s protocol (Illumina, 2010). The samples were purified using Agencourt AMPure XP beads (Beckman Genomics, Danvers, Massachusetts) and then subjected to 12 cycles of PCR as per the manufacturer’s protocol (Illumina, 2010). No sample indexing was performed. Their size distributions were checked on an Aglient Bioa-nalyzer (Agilent). Each sample was then loaded as a 6pM solution on an Illumina GAIIx v7 paired-end flowcell using a cluster station instrument (Illumina). The flowcell was then subjected to 2 × 55 bp of SBS chemistry v4 on an Illumina GAIIx instrument.
DNA (1μg) for the L samples and 0.018μg for the K36 samples was end-repaired and ligated to Illumina TruSeq adapters according to the manufacturer’s protocol (Illu-mina, 2011). The samples were purified using Agencourt AMPure XP beads (Beckman Genomics) and then sub-jected to 12 cycles of PCR as per the manufacturer’s proto-col (Illumina, 2011). The samples were indexed using the Illumina TruSeq indexes and purified using Agencourt AMPure XP beads and their size distributions checked on an Aglient Bioanalyzer (Agilent). The indexed libraries were then quantitatively pooled and a 9pM solution of multiplexed library was denatured and loaded on an Illu-mina TruSeq SE v1.5 flowcell using a cBot instrument (Illumina). The flowcell was then subjected to 51 bp of SBS chemistry on an Illumina HiSeq2000 instrument using the Illumina Real Time Analysis 1.12 software. The base calling and sample demultiplexing was performed using the Illumina CASAVA 1.8 software.
Affymetrix gene expression analysis
Affymetrix expression arrays were performed following the methods outlined in earlier work [43], except that the dataset was normalized by robust multichip average (RMA) techniques [69] and theP-value for the log2 fold change was calculated with the R/Bioconductor LIMMA package using a moderated t-statistic.
Processing of Nimblegen promoter arrays
in length with approximately 50 bp spacing distributed over 21,562 tiled regions spanning 52,016 annotated TSS regions over 20,718 unique genes. In addition these arrays cover 15,969 annotated CpG islands over both promoter and ‘non-promoter’(inter-/intra-genic). Sig-nals for each probe of the 5hmC-enriched samples (Cy5 labeled) were compared to input samples (Cy3 labeled) to generate log2 (IP/Input) scores (fold changes). These log2 scores were then normalized to correct for both saturation effects within individual arrays by Loess nor-malization and between the arrays by scale normaliza-tion using the Limma package in R/Bioconductor [70]. In order to remove individual variability the mean probe values were calculated for both the control and PB exposed group. Subsequent analysis was carried out by comparing the differences between the mean control and mean 28-day PB data sets and were plotted as changes in the probe values in PB mice relative to con-trol mice. Raw data for the reciprocal 5mC HmeDIP and MeDIP experiments were processed the same way as 5hmC but were normalized separately. The 28-day 5hmC and 5mC raw data files have been deposited with Gene Expression Omnibus (GEO series number [GSE40540]; 28-day 5hmC [GSE40537], 28-day 5mC [GSE40538], and 28-day expression [GSE40773]). Nimblegen 2.1M mouse promoter array GPL14890
Two sets of data were created for each modification. The first contains the values for all 2,056,330 probes on the microarray and was used for all analysis techniques which did not require an association to a nearby gene. A second data set was created that links the probes to a nearby gene so as to include affymetrix expression data from the same mice. This gene list is reduced in the numbers of probes it contains (387,612) as gene names were associated to all probes ±1 kb of an annotated Refseq TSS.
Bioinformatic analysis of datasets
‘Peak-based analysis’of 5hmC and 5mC
In order to better characterize regions of 5hmC and 5mC enrichment, peak finding was carried out across the data sets. Peaks were defined as regions containing at least four probes in a five probe window above the 90th percent score of the entire data set. Using these parameters, 96,003 peaks of 5hmC (representing 4.7% of all probes) and 47,876 peaks of 5mC (representing 2.3% of all probes) were identified. To ensure peak finding was returning acceptable results, peaks were compared to qPCR-vali-dated control regions (chr7:149,763,602-149,763,942, cov-ering the promoter of theH19gene, which is positive for 5hmC and 5mC; and chr6:125,115,497-125,115,656, cover-ing the promoter ofGapdh, which is negative for both marks). Peaks of both 5hmC and 5mC were then interro-gated for their genomic locations and results plotted as pie
charts along with the general distribution of all probes on the array.
Analysis of CpG densities over 5hmC-enriched TSS regions To further investigate the hmC-enriched TSS regions, the DNA of such sites was extracted and the relative CpG densities calculated (as number of CpGs per 100 bp). The hmC-positive TSS regions were then ranked by these den-sities grouped by low CpG content (LCP; <1 CpG per 100 bp), ICP (1 to 5 CpGs per 100 bp) and HCP (>5 CpGs per 100 bp). Overlap between regions enriched in hmC and CGIs was carried out by crossing regions with peaks in hmC to CGIs. The total number of probes covering CGIs was 87,234, whilst the number of CGI probes enriched in hmC was 601. The distribution of CGI-positive hmC-posi-tive probes was then plotted as a pie chart next to the dis-tribution of all CGI probes.
Sliding window analysis
Sliding windows of hmC and 5mC profiles were character-ized over both unique Refseq TSSs ±1,500 bp (n = 1,000) and‘small’, 2 to 3 kb long, complete genes found on the array (n = 775). Sliding window analysis was carried out using tools on the University of Edinburgh’s GALAXY sever [71]. Sliding window analysis plots the average signal taken from data files of interest (for example, mean hmC normal probe values) and slides across regions of interest (chromosome, start, stop) in user-defined steps (in base pairs). Expression data from control and PB-treated mouse livers were generated on Affymetrix expression arrays similar to [43], and divided into three groups depending on levels of transcription (low = bottom 25% expression levels, high = top 25% expression levels, med-ium = remaining genes). These groups were then crossed to regions of interest for sliding window analysis (for example, TSS ±1.5 kb regions ranked by expression). Slid-ing window analysis was carried out usSlid-ing a window size of 200 bp and with a step size of 50 bp and average signals plotted.
Analysis of the tissue specificity of genes with 5hmC-enriched TSS regions
Box plots were generated comparing classes of genes (including all the genes on the deluxe promoter array to all 5hmC-marked TSS region genes). The specificity of a gene’s expression pattern was measured by using a method based on information theory outlined by Martinez et al.[72]. A low score (0) indicates that a gene is uni-formly expressed, and a high score (6.2) indicates that it is expressed specifically in one tissue. A previously published brain-specific gene set and housekeeping gene set deter-mined by serial analysis of gene expression (SAGE) are shown for comparison [73].
Preparation of ChIP-Seq data sets for analysis
H3K4me2 and H3K27me3 bowtie was run in paired-end mode; for H3K36me3 it was run in single-end mode. As we investigated the enrichment in predefined regions of the genome (promoter and gene body), no peak finding was performed. From the mapped paired-end data the genomic locations of the inserts were calculated (from the forward and reverse read pairs). For the single-end data genomic locations were directly extracted from each mapped read. Duplicated locations were removed, yielding a non-redundant library of mapped genomic fragments. The number of fragments overlapping with pre-defined genomic regions such as gene bodies or promoters (see above) was counted. Within each histone mark the fragment counts per region were normalized by the total number of fragments and scaled to the mean of the libraries. The counts for each mark in each region were further normalized by the counts for the matching background sample to generate log2 fold changes (scores) between IP and background to avoid bias in genomic context. We report the mean score per group (n = 2) per region and mark.
Interrogation of changes in epigenetic marks over PPRs upon PB treatment
The mean log2 probe values over a 2 kb window (TSS ±1 kb; PPRs) were calculated for the hmC, 5mC and H3K4me2 data sets over each gene for both control, PB exposed and changes observed in PB mice. The expression changes upon PB were represented as fold change expres-sion relative to the control mice. Average H3K27me3 and H3K36me3 levels in control, PB-exposed mice as well as changes seen in PB mice were calculated over the entire gene body and related to associated promoter regions (see Additional file 21 for an example).
Initial analysis was carried out using the entire hmC or 5mC data set, plotting the average changes in promoter hmC levels against changes in gene expression. Subsequent plots for changes in promoter hmC, 5mC, H3K4me2 as well as gene body H3K27me3 and H3K36me3 only include genes with at least 1.5-fold induction in gene expression (n = 30). Trend lines were then calculated over the result-ing scatter graphs along with R2values.
Regions spanning the promoters (±3 kb) of the PB-induced genes (>log21.5-fold) showing induction along with 30 PB‘unaffected’genes were then selected and slid-ing window analysis carried out to plot the average changes in 5hmC and 5mC over these loci (see above for more on sliding window analysis). Coordinates of the PB unaffected genes are available on request.
Plots of the average changes in hmC, 5mC, H3K4me2, H3K27me3 and H3K36me3 were then carried out across two families of genes as well as 26 genes unaffected by PB exposure. Average values for changes in the epige-netic modifications were calculated across the defined
regions (Figure 1). Error bars represent standard errors and data points with significantP-values are represented by an asterisk. Coordinates of the PB unaffected genes are available on request.
Heat map analysis of PB-driven 5hmC perturbation
Average 5hmC levels were calculated as explained above for each PPR. These were then separated based on the chromosome of origin and then plotted either for each individual liver (five controls, five PB treated; Figure 3a) or for the average of these control or PB exposed livers (Additional file 15). Heat maps were drawn using R with colors taken using the Colour Brewer package (’RdYlBu’) ranging from values of -2.5 to +2.5 with a 0.5 interval. PPRs were ordered by the first query (that is, WT in Additional file 15) and clustered by both Euclidian and Ward methods.
Analysis of enhancer elements
We took 38,112 regions defined as mouse liver enhancers from datasets generated by Yim Shenet al.[75]. Mid-points of enhancer regions were then taken and expanded to create 1 kb stretches of DNA sequence before restricting the dataset to those present on the 2.1M mouse deluxe promoter array used for 5hmC and 5mC analysis. This resulted in 23,556 probes that corre-sponded to 1.15% of all probes on the array. Overlap between 5hmC/5mC-enriched peaks was then carried out and any probe residing in a peak of a mark as well as an enhancer region was scored. Box plots of 5hmC/5mC levels were then calculated over the 1 kb array enhancers as well as 1 kb promoter regions (TSS to -1 kb upstream).
5hmC-sensitive restriction digest-qPCR
The EpiMark kit (New England BioLabs, Ipswich, Massa-chusetts, USA) was used to quantify absolute levels of 5hmC and 5mC between the control and PB mouse livers as well as DNA from mouse brain. For the full protocol see the manufacturer’s instructions. Typically, 10 μg of genomic DNA was taken and half treated with T4- phage
b-glucosyltransferase for 12 to 16 h at 37°C. Both theb -glucosyltransferase treated and untreated samples were then divided into three PCR tubes and digested with either Msp1, HpaII or left uncut for a further 12 to 16 h at 37°C. Samples were proteinase K treated for 10 min-utes at 40°C prior to dilution to 100μl final volume in H20 and heating to 95°C for 5 minutes. qPCR was carried out on 5μl (approximately 0.8μg DNA) of each sample on a Roche Lightcycler 480 PCR machine. Relative enrichments of the modifications were then calculated following formulae provided by New England BioLabs.
Primers
Data access
Raw and processed data have been deposited into the Gene Expression Omnibus (GEO series number [GSE40540]).
Additional material
Additional file 1: Figure S1.(a)Dot blot comparing the specificities and sensitivities of two commercially available 5hmC antibodies. Antibodies were tested over a dilution gradient of genomic liver DNA (200 ng/μl to 2.5 ng/μl) as well as for their relative affinities against PCR products synthesized in the presence of either dCTP, dmCTP or d5hmCTP [68]. Although both antibodies can distinguish 5hmC from 5mC and non-modified C (see controls), only the polyclonal (pAB)a -rabbit antibody (Active motif) can detect 5hmC in genomic mouse liver DNA. It must be noted that the relative levels of 5hmC present in the control PCRs are far greater than that in the genomic DNA.(b)The HmeDIP technique is highly specific for 5hmC-modified DNA relative to unmodified or methylated DNA. qPCR was run on immunoprecipitated material that had been spiked with a 5hmC-rich DNA sequence. Enrichment of the 5hmC rich control DNA was only observed when immunoprecipitated with the 5hmC antibody and not with an antibodies against 5mC, non-modified C or IgG.
Additional file 2: Figure S2. qPCR analysis on pre- and post-whole genome amplification (WGA) material introduced no bias upon amplification. Confirmatory qPCR showing hmC enrichment at Tex19.1 andH19promoter regions (known hmC-enriched loci) alongside a 5hmC-negative control region (Gapdhpromoter) both prior to and after WGA. 5mC enrichment was tested in a similar way using positive control regions of theH19ICR and Cyp2b10 promoter regions and a negative ICR.
Additional file 3: Figure S3.(a,b)Validation of microarray profiling by qPCR. Correlation between HmeDIP and MeDIP qPCR enrichment values (% IP/input) to log2 values seen on the promoter microarrays is presented for 5hmC (a) and 5mC (b). Trend line (red) and R2values are also shown. Pearson correlation values (’cor’) shown alongside represent the closeness of fit between qPCR enrichment values (Y-axis) and log2 scores taken from microarray data (X-axis). Loci used for validation of HmeDIP were as follows: upstream region, 5’and 3’promoter regions of
Cyp2b10, promoter regions ofTex19.1,Actb,GapdhandH19. Loci used for
the validation of MeDIP are as follows: ICRs ofH19andGnas, intron 1 of
Cyp2b10and promoter regions ofCSA,Pou3f4,Ccdc34,Tyms,Ccr1,Cbx2
andTacr3(see primer list in Additional file 25).
Additional file 4: Figure S4. Normalized peak finding data for 5hmC and 5mC based on data from Figure 1c. The number of peaks represented in Figure 1c for both 5hmC and 5mC were divided by the number of probes covering each region (Figure 1a,c) to remove coverage bias.(a,b)Overall there are no large changes in the distribution of 5hmC (a) and 5mC (b) enriched peaks upon normalization with the exception of an increase in upstream 5hmC and 5mC peaks and reduction of inter-genic 5hmC peaks.
Additional file 5: Figure S5. Validation of‘EpiMark’quantitative analysis techniques reveals highly similar levels of the DNA modifications between individuals.(a-c)The values of 5hmCpG (a), 5mCpG (b) and CpG (c)were plotted between two biological replicates to test the reproducibility of the result. Loci tested were as follows: TSS regions of
Gapdh,H19andTspan10, an intra-genic region ofGstm3, a region
upstream of theCyp2b10promoter and an inter-genic region spanning chr7: 149709621-149709863 (see primer list in Additional file 25). All modified forms of CpG are reproducible between individuals over the six loci. Pearson correlation values (’cor’) are shown alongside representing the reproducibility of results.
Additional file 6: Figure S6. A subset of enhancer elements present on the promoter array overlap with peaks of 5hmC. Total number of probes that overlap with 1 kb long enhancer elements defined by Shenet al. [75] (grey bar) are plotted next to enhancer probes that also contain a
peak of either 5hmC (purple bar) or 5mC (red bar). Overall, approximately 15% of enhancer probes on the array overlap with peaks of 5hmC.
Additional file 7: Figure S7. qPCR analysis of 5hmC (purple) and 5mC (red) levels at repeat elements (major satellites, LINEs and IAPs) in liver DNA. Enrichment values are plotted as percentage IP relative to the input.
Additional file 8: Figure S8. Sliding window analysis of 5hmC and 5mC over full-length genes (n = 775) covered on the array. Levels of 5hmC increase throughout the body of a gene in a transcription-dependant manner. Expression levels were calculated within the 775‘small’gene set. Top 25% = highly transcribed (green), bottom 25% = lowly transcribed (red). In contrast to 5hmC, levels of 5mC are higher over the TSS of lowly expressed genes and show less of a correlation with transcriptional levels throughout the gene body.
Additional file 9: Figure S9. Examples of 5hmC-enriched TSS regions along with more typical 5hmC-depleted TSS regions. Two examples of 5hmC-enriched genes are shown on the left (Rnas10andTmem139). In comparison, a more typical (5hmC depleted) TSS region is shown on the right forBckdhaandExosc5. All scales on the Y-axis are from log21.5 to -log21.5. Individual X-axis scale bars are represented by a black bar. The 5hmC profile is in purple and 5mC in red; the transcription start site (black arrow) and gene structure are also illustrated. Exons are shown as perpendicular lines.
Additional file 10: Table S1. List of genes with a 5hmC-enriched‘TSS region’(n = 508).
Additional file 11: Table S2. Average promoter 5hmC and 5mC log2 scores across all the genes on the array.
Additional file 12: Figure S10. Genes with 5hmC enrichment over their TSS show some enrichment towards those that are expressed in a tissue-specific manner. The relative levels of tissue tissue-specificity were plotted (see Materials and methods; Si value of 0 = non tissue specific, Si value of 6.2 = highly tissue specific) against groups of genes with high tissue specificity as well as housekeeping genes. In comparison to all of the genes on the array there is a small but significant (P-value < 0.001) increase in the level of tissue specificity for genes with 5hmC-enriched regions spanning the TSS. The red lines represent the median score of the group of genes. The upper circles represent outliers of the majority of genes.
Additional file 13: Figure S11. Examples of CGIs with high CpG density (HCP) that are enriched for 5hmC. Although the majority of probes covering CGIs do not contain peaks of 5hmC, those that do show a striking enrichment over certain loci.(a-c)The majority of the 5hmC-enriched probes mapping to CGIs are inter-genic (a,b) or intra-genic (c). Intragenic CGIs in (a) are found at chr9:101,153,320-101,154,414 (left panel) and chr11:90,279,237-90,279,648 (right panel). Intergenic CGIs shown in the example in (c) are found within the geneZip4.(d,e) Promoters with CGIs (Actbis the example (d)) are also found to be largely depleted in the 5hmC modification in contrast to those that lack CGIs (Gstm6is the example (e)). All scales on the Y-axis are from log2+2 to -log22. Transcription start site (black arrow) and gene structure are illustrated below each example. Exons are shown as perpendicular lines. Scale bars are represented at the bottom right of each figure.
Additional file 14: Figure S12. 5hmC and 5mC levels are not enriched over‘CGI shores’. The total number of probes found over regions 1 kb upstream of annotated CGIs were selected (upper panel and lower panel grey bar) and the number of these probes also containing peaks in 5hmC or 5mC analyzed (purple and red bars, respectively). From this analysis a small number of the probes were seen to contain peaks of 5hmC (approximately 10%) or 5mC (approximately 2%).
Additional file 16: Figure S14.(a,b)Scatter plot comparing average promoter changes for 5hmC (a) or 5mC (b) against changes in gene expression levels following 28-day PB exposure. Only a subset of genes show >log21.5-fold induction (red rectangle) and no correlation with strongly down-regulated genes are noted.
Additional file 17: Figure S15. Log2fold changes of PB-treated over vehicle (control) samples averages for histone methylation marks (n = 2) and 5mC or hmC (n = 5) for all 20,717 genes. The fold changes for H3K4me2 are calculated in a window of +2/-1 kb of TSS, and gene body for H3K27me3 and H3k36me3 and +1/-1 kb of TSS for 5mC and hmC. The density of genes/promoters is indicated by the grade of blue; data points at the periphery of the main data density are indicated by black dots. The red dot indicates the geneCyp2b10.
Additional file 18: Figure S16. Log10histone scores of vehicle (control) versus PB treated per mark (group average, n = 2) in 20,717 promoter regions (+2/-1kb of TSS) for H3K4me2 and gene bodies for H3K27me3 and H3K36me3. The dotted green line has intercept 0 and slope 1, the red line is a regression line (R2). The further off the diagonal a gene is, the stronger the treatment effect. The density of genes/promoters is indicated by the grade of blue; data points at the periphery of the main data density are indicated by black dots. The red dot indicates the gene Cyp2b10.
Additional file 19: Figure S17. PB-mediated changes to both 5hmC and 5mC levels are not observed over the enhancer elements present on the array. Box plot of 5hmC (purple) and 5mC (red) log2 levels over 1 kb enhancer elements in control or 28-day PB-exposed mouse livers reveal no global changes at these sites.
Additional file 20: Figure S18. Genes that are unchanged in their expression following PB exposure do not correlate to changes in both DNA and histone modifications. Scatter graph plots display the average changes in epigenetic marks (5hmC, 5mC, H3K4me2, H3K27me3 and H3K36me3) against fold change in expression for 30 genes unchanged in their expression state following 28-day PB treatment. Trend lines are displayed in red with associated Pearson correlation (’cor’) andP-values. These findings contrast those observed over 30 PB-induced genes (Figure 3b).
Additional file 21: Table S3. Top 25 genes induced upon 28-day PB exposure.
Additional file 22: Table S4. Gene Ontology terms for genes induced following PB exposure.
Additional file 23: Figure S19. Examples of changes to the profiles of histone modifications (ChIP-Seq) and DNA modification changes (MeDIP/ HmeDIP-chip) across selectCyp2bandGstgenes. Patterns of log2 changes in the signals of 5mC (red), 5hmC (purple), H3K36me3 (green), H3K27me3 (orange) and H3K4me2 (blue) are plotted over these regions. The Y-axis of ChIP-Seq samples were plotted on a scale of +70 to -70+ reads whilst promoter arrays (5hmC and 5mC) plotted from +1.5 log2to -1.5 log2values.
Additional file 24: Figure S20. Plots of average changes in epigenetic marks overGstgene family in comparison to genes unaffected in their gene expression states following 28-day PB exposure. Average changes in the log2scores (DNA modifications) or fold change in the number of reads (histone modifications) of the marks are plotted against regions outlined earlier in Figure 1. Error bars are standard error and points showing significant deviation from unaffected genes (Willcox test, P-value < 0.005) are denoted by the red asterisk. Red dotted line represents 0 change in epigenetic mark upon PB exposure.
Additional file 25: Table S5. List of DNA primers used in this study.
Abbreviations
5hmC: 5-hydroxymethylcytosine; 5mC: 5-methylcytosine; bp: base pair; CAR: constitutive androstane receptor (Nr1i3); CGI: CpG island; ChIP: chromatin immunoprecipitation; GEO: Gene Expression Omnibus; H3K27me3: histone H3 lysine 27 tri-methylation; H3K36me3: histone H3 lysine 36 tri-methylation; H3K4me2: histone H3 lysine 4 di-methylation; HmeDIP: 5hmC DNA
immunoprecipitation assay; IAP: intracisternal A-particle; ICP: intermediate CpG content; IP: immunoprecipitation; LINE: long interspersed nuclear element; MeDIP: methylated DNA immunoprecipitation; NGC: non-genotoxic carcinogen; PB: phenobarbital; PPR: promoter proximal region; qPCR: quantitative PCR; RMA: robust multichip average; TDG: thymine DNA glycosylase; TSS: transcription start site.
Acknowledgements
The research leading to these results is partly funded by the Innovative Medicine Initiative Joint Undertaking (IMI JU) under grant agreement number 115001 (MARCAR project). Novartis and the MRC are full participants in the IMI consortium. Novartis provide in kind financial contribution to the scientific program. All IMI-MARCAR consortium partners had a role in study design, data collection and analysis, decision to publish, or preparation of the manuscript. JT and JH are recipients of IMI-MARCAR funded career development fellowships at the MRC HGU. RM and DR are supported by Medical Research Council. CN is supported by Breakthrough Breast Cancer (BBC). Work in RM’s lab is supported by IMI-MARCAR, MRC, BBSRC and BBC. HL is the recipient of a NIBR Postdoctoral Fellowship. Thanks also for contributions from, Tulipan Zollinger, Christian Kohler, Nicole Cheung, Olivier Grenet, Florian Hahne, Ieuan Clay, Ulrich Laengle, Frank Staedtler, Pierre Moulin, David Heard, Virginie Petitjean, Anita Fernandez and Duncan Sproul.
Author details 1
MRC Human Genetics Unit, Institute of Genetics and Molecular Medicine, University of Edinburgh, Western General Hospital, Edinburgh EH4 2XU, UK. 2
Investigative Toxicology, Preclinical Safety, Translational Sciences, Novartis Institute for Biomedical Research, Lichtstrasse 35, CH-4057 Basel, Switzerland. 3
Breakthrough Breast Cancer Research Unit, University of Edinburgh, Western General Hospital, Edinburgh EH4 2XU, UK.4Friedrich Miescher Institute for Biomedical Research, Maulbeerstrasse 66, 4058 Basel, Switzerland.5Biomarker Development, Human Genetics and Genomics, Translational Sciences, Novartis Institutes for Biomedical Research, Maulbeerstrasse 66, 4056 Basel, Switzerland.6Member of MARCAR consortium.
Authors’contributions
Conceived and designed the experiments: JM, HL, RT, JT & RM. Performed the experiments: JH, JT, DR, HL, AM, FB and RT. Analyzed the data: JT, AM and CN. Contributed reagents/materials/analysis tools: DS. Wrote the paper: JT and RM (edits by JM, RT, HL, DS, CN, AM and RM). All authors have read and approved the manuscript for publication.
Competing interests
The authors declare that no competing interests exist. Authors who work for Novartis Institutes for Biomedical Research (NIBR) confirm that this does not alter their adherence to all the Genome Biology policies on sharing data and materials.
Received: 30 May 2012 Revised: 30 August 2012 Accepted: 3 October 2012 Published: 3 October 2012
References
1. Bird A:DNA methylation patterns and epigenetic memory.Genes Dev 2002,16:6-21.
2. Hackett JA, Reddington JP, Nestor CE, Dunican DS, Branco MR, Reichmann J, Reik W, Surani MA, Adams IR, Meehan RR:Promoter DNA methylation couples genome-defence mechanisms to epigenetic reprogramming in the mouse germline.Development2012,
139:3623-3632.
3. Kriaucionis S, Heintz N:The nuclear DNA base 5-hydroxymethylcytosine is present in Purkinje neurons and the brain.Science2009,324:929-930. 4. Tahiliani M, Koh KP, Shen Y, Pastor WA, Bandukwala H, Brudno Y, Agarwal S,
Iyer LM, Liu DR, Aravind L, Rao A:Conversion of methylcytosine to 5-hydroxymethylcytosine in mammalian DNA by MLL partner TET1.Science 2009,324:930-935.
5. Wyatt GR, Cohen SS:A new pyrimidine base from bacteriophage nucleic acids.Nature1952,170:1072-1073.
6. Wossidlo M, Nakamura T, Lepikhov K, Marques CJ, Zakhartchenko V, Boiani M, Arand J, Nakano T, Reik W, Walter J:5-Hydroxymethylcytosine in the mammalian zygote is linked with epigenetic reprogramming.Nat
7. Ko M, Huang Y, Jankowska AM, Pape UJ, Tahiliani M, Bandukwala HS, An J, Lamperti ED, Koh KP, Ganetzky R, Liu XS, Aravind L, Agarwal S,
Maciejewski JP, Rao A:Impaired hydroxylation of 5-methylcytosine in myeloid cancers with mutant TET2.Nature2010,468:839-843. 8. Koh KP, Yabuuchi A, Rao S, Huang Y, Cunniff K, Nardone J, Laiho A,
Tahiliani M, Sommer CA, Mostoslavsky G, Lahesmaa R, Orkin SH, Rodig SJ, Daley GQ, Rao A:Tet1 and Tet2 regulate 5-hydroxymethylcytosine production and cell lineage specification in mouse embryonic stem cells.Cell Stem Cell2011,8:200-213.
9. Ito S, D’Alessio AC, Taranova OV, Hong K, Sowers LC, Zhang Y:Role of Tet proteins in 5mC to 5hmC conversion, ES-cell self-renewal and inner cell mass specification.Nature2010,466:1129-1133.
10. Yang H, Liu Y, Bai F, Zhang JY, Ma SH, Liu J, Xu ZD, Zhu HG, Ling ZQ, Ye D, Guan KL, Xiong Y:Tumor development is associated with decrease of TET gene expression and 5-methylcytosine hydroxylation.Oncogene 2012, doi: 10.1038/onc.2012.67.
11. Figueroa ME, Abdel-Wahab O, Lu C, Ward PS, Patel J, Shih A, Li Y, Bhagwat N, Vasanthakumar A, Fernandez HF, Tallman MS, Sun Z, Wolniak K, Peeters JK, Liu W, Choe SE, Fantin VR, Paietta E, Löwenberg B, Licht JD, Godley LA, Delwel R, Valk PJ, Thompson CB, Levine RL, Melnick A:
Leukemic IDH1 and IDH2 mutations result in a hypermethylation phenotype, disrupt TET2 function, and impair hematopoietic differentiation.Cancer Cell2010,18:553-567.
12. Yamazaki J, Taby R, Vasanthakumar A, Macrae T, Ostler KR, Shen L, Kantarjian HM, Estecio MR, Jelinek J, Godley LA, Issa JP:Effects of TET2 mutations on DNA methylation in chronic myelomonocytic leukemia.
Epigenetics2012,7:201-207.
13. Weissmann S, Alpermann T, Grossmann V, Kowarsch A, Nadarajah N, Eder C, Dicker F, Fasan A, Haferlach C, Haferlach T, Kern W, Schnittger S,
Kohlmann A:Landscape of TET2 mutations in acute myeloid leukemia.
Leukemia2012,26:934-942.
14. Fromme JC, Banerjee A, Verdine GL:DNA glycosylase recognition and catalysis.Curr Opin Struct Biol2004,14:43-49.
15. He YF, Li BZ, Li Z, Liu P, Wang Y, Tang Q, Ding J, Jia Y, Chen Z, Li L, Sun Y, Li X, Dai Q, Song CX, Zhang K, He C, Xu GL:Tet-mediated formation of 5-carboxylcytosine and its excision by TDG in mammalian DNA.Science 2011,333:1303-1307.
16. Williams K, Christensen J, Pedersen MT, Johansen JV, Cloos PA, Rappsilber J, Helin K:TET1 and hydroxymethylcytosine in transcription and DNA methylation fidelity.Nature2011,473:343-348.
17. Wu H, D’Alessio AC, Ito S, Wang Z, Cui K, Zhao K, Sun YE, Zhang Y:
Genome-wide analysis of 5-hydroxymethylcytosine distribution reveals its dual function in transcriptional regulation in mouse embryonic stem cells.Genes Dev2011,25:679-684.
18. Ficz G, Branco MR, Seisenberger S, Santos F, Krueger F, Hore TA, Marques CJ, Andrews S, Reik W:Dynamic regulation of
5-hydroxymethylcytosine in mouse ES cells and during differentiation.
Nature2011,473:398-402.
19. Yu M, Hon GC, Szulwach KE, Song CX, Zhang L, Kim A, Li X, Dai Q, Shen Y, Park B, Min JH, Jin P, Ren B, He C:Base-resolution analysis of 5-hydroxymethylcytosine in the Mammalian genome.Cell2012,
149:1368-1380.
20. Pastor WA, Pape UJ, Huang Y, Henderson HR, Lister R, Ko M, McLoughlin EM, Brudno Y, Mahapatra S, Kapranov P, Tahiliani M, Daley GQ, Liu XS, Ecker JR, Milos PM, Agarwal S, Rao A:Genome-wide mapping of
5-hydroxymethylcytosine in embryonic stem cells.Nature2011,473:394-397. 21. Xu Y, Wu F, Tan L, Kong L, Xiong L, Deng J, Barbera AJ, Zheng L, Zhang H,
Huang S, Min J, Nicholson T, Chen T, Xu G, Shi Y, Zhang K, Shi YG:
Genome-wide regulation of 5hmC, 5mC, and gene expression by Tet1 hydroxylase in mouse embryonic stem cells.Mol Cell2011,42:451-464. 22. Sérandour AA, Avner S, Oger F, Bizot M, Percevault F, Lucchetti-Miganeh C,
Palierne G, Gheeraert C, Barloy-Hubler F, Péron CL, Madigou T, Durand E, Froguel P, Staels B, Lefebvre P, Métivier R, Eeckhoute J, Salbert G:Dynamic hydroxymethylation of deoxyribonucleic acid marks differentiation-associated enhancers.Nucleic Acids Res2012.
23. Stroud H, Feng S, Morey Kinney S, Pradhan S, Jacobsen SE:
5-hydroxymethylcytosine is associated with enhancers and gene bodies in human embryonic stem cells.Genome Biol2011,12:R54.
24. Bocker MT, Tuorto F, Raddatz G, Musch T, Yang FC, Xu M, Lyko F, Breiling A:
Hydroxylation of 5-methylcytosine by TET2 maintains the active state of the mammalian HOXA cluster.Nat Commun2012,3:818.
25. Booth MJ, Branco MR, Ficz G, Oxley D, Krueger F, Reik W,
Balasubramanian S:Quantitative sequencing of 5-methylcytosine and 5-hydroxymethylcytosine at single-base resolution.Science2012,
336:934-937.
26. Song CX, Szulwach KE, Fu Y, Dai Q, Yi C, Li X, Li Y, Chen CH, Zhang W, Jian X, Wang J, Zhang L, Looney TJ, Zhang B, Godley LA, Hicks LM, Lahn BT, Jin P, He C:Selective chemical labeling reveals the genome-wide distribution of 5-hydroxymethylcytosine.Nat Biotechnol2011,29:68-72. 27. Jin SG, Wu X, Li AX, Pfeifer GP:Genomic mapping of
5-hydroxymethylcytosine in the human brain.Nucleic Acids Res2011,
39:5015-5024.
28. Szulwach KE, Li X, Li Y, Song CX, Wu H, Dai Q, Irier H, Upadhyay AK, Gearing M, Levey AI, Vasanthakumar A, Godley LA, Chang Q, Cheng X, He C, Jin P:5-hmC-mediated epigenetic dynamics during postnatal neurodevelopment and aging.Nat Neurosci2011,14:1607-1616. 29. Nestor CE, Ottaviano R, Reddington J, Sproul D, Reinhardt D, Dunican D,
Katz E, Dixon JM, Harrison DJ, Meehan R:Tissue-type is a major modifier of the 5-hydroxymethylcytosine content of human genes.Genome Res 2011,22:467-477.
30. Cortellino S, Xu J, Sannai M, Moore R, Caretti E, Cigliano A, Le Coz M, Devarajan K, Wessels A, Soprano D, Abramowitz LK, Bartolomei MS, Rambow F, Bassi MR, Bruno T, Fanciulli M, Renner C, Klein-Szanto AJ, Matsumoto Y, Kobi D, Davidson I, Alberti C, Larue L, Bellacosa A:Thymine DNA glycosylase is essential for active DNA demethylation by linked deamination-base excision repair.Cell2011,146:67-79.
31. Branco MR, Ficz G, Reik W:Uncovering the role of 5-hydroxymethylcytosine in the epigenome.Nat Rev Genet2012,13:7-13.
32. Iqbal K, Jin SG, Pfeifer GP, Szabo PE:Reprogramming of the paternal genome upon fertilization involves genome-wide oxidation of 5-methylcytosine.Proc Natl Acad Sci USA2011,108:3642-3647. 33. Inoue A, Shen L, Dai Q, He C, Zhang Y:Generation and
replication-dependent dilution of 5fC and 5caC during mouse preimplantation development.Cell Res2011,21:1670-1676.
34. Watson RE, Goodman JI:Epigenetics and DNA methylation come of age in toxicology.Toxicol Sci2002,67:11-16.
35. Phillips JM, Yamamoto Y, Negishi M, Maronpot RR, Goodman JI:Orphan nuclear receptor constitutive active/androstane receptor-mediated alterations in DNA methylation during phenobarbital promotion of liver tumorigenesis.Toxicol Sci2007,96:72-82.
36. Chia N, Wang L, Lu X, Senut MC, Brenner C, Ruden DM:Hypothesis: Environmental regulation of 5-hydroxymethylcytosine by oxidative stress.Epigenetics2011,6:853-856.
37. Becker FF:Morphological classification of mouse liver tumors based on biological characteristics.Cancer Res1982,42:3918-3923.
38. Giera S, Braeuning A, Kohle C, Bursch W, Metzger U, Buchmann A, Schwarz M:Wnt/beta-catenin signaling activates and determines hepatic zonal expression of glutathione S-transferases in mouse liver.Toxicol Sci 2010,115:22-33.
39. Aydinlik H, Nguyen TD, Moennikes O, Buchmann A, Schwarz M:Selective pressure during tumor promotion by phenobarbital leads to clonal outgrowth of beta-catenin-mutated mouse liver tumors.Oncogene2001,
20:7812-7816.
40. Stanley LA, Horsburgh BC, Ross J, Scheer N, Wolf CR:PXR and CAR: nuclear receptors which play a pivotal role in drug disposition and chemical toxicity.Drug Metab Rev2006,38:515-597.
41. Cortázar D, Kunz C, Selfridge J, Lettieri T, Saito Y, MacDougall E, Wirz A, Schuermann D, Jacobs AL, Siegrist F, Steinacher R, Jiricny J, Bird A, Schär P:
Embryonic lethal phenotype reveals a function of TDG in maintaining epigenetic stability.Nature2011,470:419-423.
42. Chen D, Lucey MJ, Phoenix F, Lopez-Garcia J, Hart SM, Losson R, Buluwela L, Coombes RC, Chambon P, Schär P, Ali S:T:G mismatch-specific thymine-DNA glycosylase potentiates transcription of estrogen-regulated genes through direct interaction with estrogen receptor alpha.J Biol Chem2003,278:38586-38592.
43. Lempiäinen H, Müller A, Brasa S, Teo SS, Roloff TC, Morawiec L, Zamurovic N, Vicart A, Funhoff E, Couttet P, Schübeler D, Grenet O, Marlowe J, Moggs J, Terranova R:Phenobarbital mediates an epigenetic switch at the constitutive androstane receptor (CAR) target gene Cyp2b10 in the liver of B6C3F1 mice.PLoS One2011,6:e18216. 44. Weber M, Davies JJ, Wittig D, Oakeley EJ, Haase M, Lam WL, Schubeler D: