Munich Personal RePEc Archive
Global technological collaboration
network. Network analysis of
international co-inventions
De Prato, Giuditta and Nepelski, Daniel
European Commission - JRC IPTS
15 May 2012
Online at
https://mpra.ub.uni-muenchen.de/38818/
Global technological collaboration network
Network analysis of international co-inventions
Giuditta De Prato* and Daniel Nepelski*†
Abstract
Global innovation networks are emerging as a result of the international division of innovation processes through, among others, international technological collaborations. At the aggregate level, the creation of technological collaboration between countries can be considered as mutually beneficial (or detrimental) and their random distribution is unlikely. Consequently, the dynamics and evolution of the technological collaborations can be expected to fulfil the criteria of a complex network. To study the structure and evolution of the global technological collaboration network, we use patent-based data of international co-inventions and apply the network analysis. In addition, extending the gravity model of international technological collaboration by measures controlling for countries position in the network, we show that that a country's position in the network has very strong impact on the intensity of collaboration with other members of the network.
Keywords: globalisation of technology, technological collaboration, co-invention, network analysis, patent
JEL classification: D8, F23, O14, O30, O57
* European Commission
JRC Institute for Prospective Technological Studies Calle del Inca Garcilaso 3
41092 Seville Tel. +34 95 448 0573 Fax +34 95 448 8208
† Corresponding author: [email protected]
1 Introduction
Global innovation networks are a result of the international division of innovation processes
in which countries participate and in which firms have a broader capacity to access and
combine knowledge form a variety of sources (Sachwald, 2008). In the context of the process
of spatial division of innovation activity, corporations seek knowledge sources and
opportunities worldwide (Archibugi & Iammarino, 2002; Bartlett & Ghoshal, 1990; Doz,
Santos, & Williamson, 2001; Dunning, 1988, 1994). Consequently, today external contacts
are decisive for a firm's innovation activities (Asheim & Isaksen, 2002; Cooke, 2002). One
form of innovation internationalisation is global technological collaborations (Archibugi &
Iammarino, 2002; Narula & Hagedoorn, 1999). At the aggregate level, the result of global
technological collaborations is the emergence of knowledge flows between countries. The
existence of such flows between any pair of countries creates externalities to other countries.
Examples of such externalities might include increased competition for skilled labour or
knowledge spillovers (Audretsch & Feldman, 1996; Audretsch & Lehmann, 2005). Hence,
the creation of technological collaboration between countries can be considered as mutually
beneficial (or detrimental) and a random distribution of technological collaborations is
unlikely. Consequently, the dynamics and evolution of the technological collaborations can be
expected to fulfil the criteria of a complex network, whose elements and changes are driven
by collective actions. Understanding the dynamics of the entire system of global R&D,
innovation and technology development seems to be of crucial importance from the
innovation policy point of view (Edler & Polt, 2008).. Unfortunately, to our best knowledge,
the available research fails to thoroughly capture this perspective.
The objective of the present paper is to create a map of technological collaborations between
countries around the world and to analyse the determinants of the formation of technological
collaboration relationships between countries. We seek to answer the following questions:
What is the structure and the dynamics of the global technological network? What are the
workings of network interactions? What positions countries occupy in this network? And,
finally, what and how do economic fundamentals affect the formation of technological
networks?
To study the global web of technological collaborations as a system of inter-lined activities,
comprehensive dataset containing information on a worldwide coverage of patent applications
submitted to around 90 patent offices in the world over the last two decades. By applying
network analysis, we graphically and analytically study the characteristics and the evolution
of the international co-inventions network and the relationships between the actors. In
addition, we introduce network measures in a gravity model with the aim of studying how a
position of a country in the co-invention network affects the likelihood of formation of links
between countries and their intensities.
Despite the fact that the topic of internationalization of innovation has already attracted a
considerable amount of attention, there is still relatively little empirical evidence (Carlsson,
2006). Moreover, the existing studies are either based on firm level analysis (Boutellier,
Gassmann, & Zedtwitz, 2008; Florida, 1997; Gulbrandsen & Godoe, 2008; Kuemmerle,
1999) or provide case study analysis at a country level (Gassler & Nones, 2008; Pittiglio,
Sica, & Villa, 2009). In addition, the available studies focus on developed countries (Niosi,
Manseau, & Godin, 2000) and, with some exceptions (Schmiele, 2011), ignore the emergence
of the developing countries as a location of inventive activity. Studies that take into account a
large group of countries and explain technological collaboration activities between them are
scarce as well (Belderbos, Fukao, & Iwasa, 2006; Patel & Pavitt, 1991; Picci, 2010). Thus,
not surprisingly, only few studies explicitly investigate innovation internationalization
empirically at the system level (Bartholomew, 1997; Niosi & Bellon, 1994). Attempts to
study the interdependences between countries are limited to the developed world and are
limited too in terms of technology coverage (Bartholomew, 1997; Shapira, Youtie, & Kay,
2011). Consequently, to our knowledge, none of the studies takes a holistic view of the entire
system and accounts for the inter-dependencies and externalities that arise in this system of
interactions.
Taking into account the gap in understanding the dynamics of the organisation of the global
technological collaboration network, the contributions of this paper are: First, we look at the
whole system, rather than at individual relationships and interactions. Second, in the analysis
of the determinants of international collaborations, we introduce a set of unique variables
controlling for a country's position in the network. Overall, we present evidence that helps to
better understand the interdependencies present in the process of globalised R&D relations
and create a holistic view of the development of the global technological collaboration
We acknowledge that studies on knowledge, R&D and innovation networks already exist.
Some applications of this type of analysis has been made to, for example, patent (Breschi &
Lissoni, 2004; Cantwell & Santangelo, 2000; Chao-Chih, 2009; Han & Park, 2006; Lai,
D'Amour, Yu, Sun, & Fleming, 2011; Stefano & Francesco, 2004) and bibliometric data
(Glänzel & Schubert, 2005; Glänzel, Schubert, & Czerwon, 1999; Kretschmer, 2004). Our
work extends the application of networks to the country level and, by using a comprehensive
dataset, maps a global network of inventive collaboration and provides new evidence on the
determinants of technological collaboration.
The remaining of the paper proceeds as follows: Section 2 describes the process of designing
the global technological collaboration network based on international co-inventions. Section 3
introduces the data and measures used in the study and Section 4 analyses the characteristics
of the technological collaboration network and countries' positions in this network. Section 5
formulates a model of formation of collaboration linkages between countries and Section 6
presents and discusses the results of empirical estimations. Section 0 concludes.
2 International
co-inventions
as a technological collaboration
network
Being aware of the limitations of using patents as a measure of international collaboration
(Bergek & Bruzelius, 2010), this work uses information included in patent applications to
construct measures of international collaboration. Each patent application has a list of
inventors, i.e. the people who developed a particular invention, and information about their
place of residence. An intuitive way of representing the set of international co-inventions by
using patent data as a network is through drawing a line connecting two countries that share a
patent developed by their residents. By doing this for the entire pool of international
co-inventions, we are able to construct a global network of technological collaborations.
We identify our set of nodes, V, as the countries and the set of arcs, A, as the bilateral
relationships that exist whenever a patented invention was developed by at least two inventors
residing in different countries (see Annex for a formal definition of a network and network
measures). Adding a measure of intensity for each node and each relation permits us to
control for the level of internationalisation of each country and the intensity of technological
collaboration relationships it maintains with its partners. In other words, each node is
which is captured by the vertex value function P= pi , wherepi is the number of patents
co-invented be residents of country i. This reflects the strength of vertex i.
According to Guellec & Van Pottelsberghe de la Potterie (2001), the total number of patents
co-invented by residents of country i in collaboration with foreign researchers is
∑
≠=
i
j ij
i CoInn
CoInn . (1)
Regarding the intensity of technological collaboration relationships between countries, each
line is weighted by the total amount of inventive collaboration that takes place between
country i and country j, i.e. the total number of joint patents. Hence, the line value function is
W=wij, where ij is the link and wij is the link's weight. Again, according to Guellec & Van
Pottelsberghe de la Potterie (2001), this can be defined as CoInnij, i.e. the total number of
patents co-invented by residents of country i in collaboration with researchers from country j.1
3 Data
In this paper, we use patent data coming from the European Patent Office (EPO) Worldwide
Patent Statistical Database, known as PATSTAT. This database provides a worldwide
coverage of patent applications submitted to around 90 Patent Offices in the world. The
present analysis is based on indicators built by extracting and elaborating patent application
data from the April 2010 release of the PATSTAT database. The analysis takes into account
priority patent applications filed at 59 Patent Offices: the EPO itself and 58 National Patent
Offices including those of the 27 EU Member States, the US Patent and Trademark Office
(USPTO), the Japan Patent Office (JPO) as well as the other most active Patent Offices
worldwide, including China and India. The time period taken into account covers from
January 1st, 1990 to December 31st, 2007.2
Patent applications data provide information on the country of residence of the inventors;
therefore patents are attributed to countries using the ‘inventor criterion’. This way, our
methodology of computing patent statistics for the purpose of this paper follows the most
recent approach in literature (de Rassenfosse, Dernis, Guellec, Picci, & van Pottelsberghe de
1 For an extensive description of the methodology and its application to study internationalization of innovation
using patent-based indicators please refer to (G. De Prato, Nepelski, & Stancik, 2011).
la Potterie, 2011; Turlea et al., 2011).3 In this paper we use priority patent applications,
instead of granted patents. This methodological choice allows taking in account, processing
and analysing a much broader dataset than any other methodological choice done before in
the domain of patent analysis. Such choice is nowadays supported by a growing scientific
literature and generates an increasing amount of relevant results.
According to Table 3-1, there were nearly half a million of patent applications submitted to
one of the patent offices considered in 1990. This number continued to grow, on average,
nearly 4% per year and reached 777.551 patent applications in 2007. Regarding the results of
computing the number of patents and the number of international co-inventions, as defined in
section 2, there were only 804 applications that included at least two inventors from different
countries in 1990. By 2007, this number grew to over 6.200 patent applications. This
represents an average annual increase of 37%, i.e. nearly ten times higher than the growth rate
of patent applications. However, as a share in total patent applications, the number of
international co-inventions is marginal. For example, in 2007 less than 1% of all patent
applications were a result of a collaboration of at least two inventors from different countries.
This confirms the results of the findings concerning the low levels of technological
internationalisation (Patel & Pavitt, 1991; Picci, 2010). Nevertheless, this part of innovation
activity should not be ignored, considering the increasing orientation of large firms to source
their technologies from around the world and the fact that not all strategies of R&D
internationalisation include developing patentable inventions (G. De Prato, Nepelski, &
[image:7.595.99.498.543.600.2]Stancik, 2011).
Table 3-1. Number of patent and international patent applications, 1990-2007
1990 1995 2000 2005 2007
Number of priority patent applications 456.425 530.448 666.936 765.175 777.551
Number of international co-inventions 804 2.195 3.912 5.852 6.229
% of international co-inventions in total 0,18 0,41 0,59 0,76 0,80
Source: Own calculations using the inventor criterion based on PATSTAT Database, version 2010
3 For an extensive description of the methodology and its application to study R&D performance using
4 Characteristics of the global technological collaboration network
4.1 Network structure
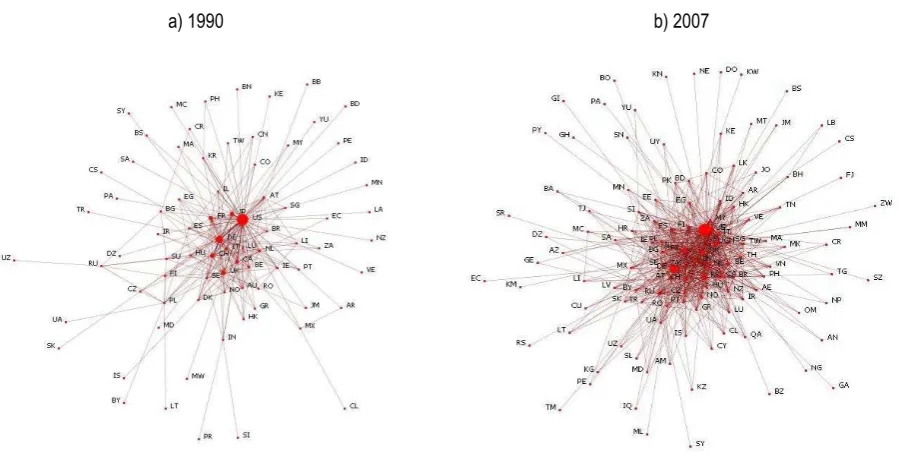
Our analysis of the global network of co-invention starts with its graphical illustration in two
time points, i.e. 1990 and 2007, (Figure 4-1). A first look at Figure 4-1 reveals that, in 1990,
the network of international technological collaborations was rather weakly connected. Its
centre was formed by the US, Japan and developed European countries. Consequently, as
pointed out by early studies, the levels of innovation internationalisation was relatively small
(Patel & Pavitt, 1991). However, in 2007, we can clearly see that the number of countries, the
linkages between them and their intensity increase at a rapid rate. According to Table 8-1 (see
Appendix), in the analysed period, the number of countries involved in global technological
collaborations increased from 79 to 125 and the number of links between them nearly
quadrupled.
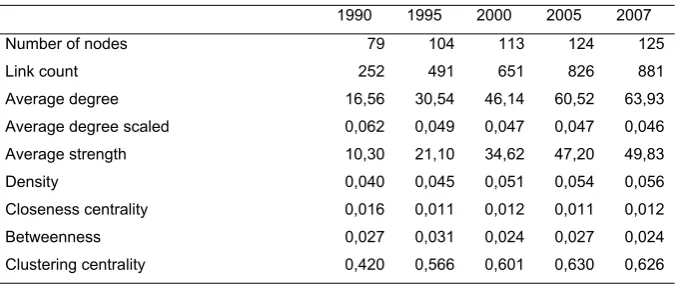
Regarding the general connectivity of the network, the value of the network density parameter
started from 0,04 in 1990 and reached the level of 0,06 (Table 8-3, Appendix).4 Thus, the
network is neither regular nor complete. Most of the countries do not have technological
collaborations with all the remaining countries, but rather select, or are selected as
collaboration partners. Moreover, the distribution of the measure of closeness centrality
indicates that the majority of the countries are rather "far away" from the remaining countries
of the network and only few countries are sufficiently well connected to be able to maintain
short paths that connect them with the other actors of the technological collaboration network.
The value of clustering coefficient is significantly higher than the value of network density.
Thus, in contrast to a random graph where clustering coefficient is expected to be equal to
network density, the network of international R&D centres is significantly more clustered
than if the links were generated at random.
The above analysis of the network indices shows that a number of countries is connected only
to the so called 'hubs' of the network and do not hold links with other members of the
network. Thus, the network has a clear core-periphery structure. Moreover, it can be said that
countries establish technological collaboration relationships with countries that also
collaborate with each other. This type of clustering behaviour lets us conclude that 'local' links
tend to play an important role. It has to be however noted that local do not necessarily imply
geographical proximity and that it can be rather interpreted as a pattern of interaction with the
"usual suspects", who may represent either countries belonging to some regional group or just
countries at a similar level of development.
The above findings contrast the results of network analysis of, for example, international
R&D centres and international trade (De Benedictis & Tajoli, 2011; Giuditta De Prato &
Nepelski, 2011; Fagiolo, Reyes, & Schiavo, 2007). The straightforward interpretation of this
fact is that the production of 'knowledge' in a process of international collaboration is more
complex than a mere creation of international R&D centres and that knowledge, as a good, is
also less prone to trade and exchange than other material goods or services traded around the
[image:9.595.78.528.312.542.2]world.
Figure 4-1. The evolution of the global technological collaboration network
a) 1990 b) 2007
Source: Own calculations based on PATSTAT Database, version 2010
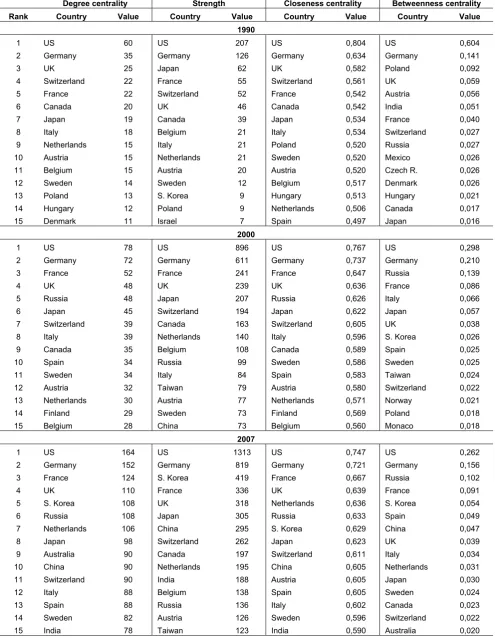
4.2 Countries' positions in the network
Turning to the analysis of countries' positions in the technological collaboration network, we
rank countries according to four centrality measures, i.e. degree, strength, closeness and
betweenness centrality, in three periods, i.e. 1990, 2000 and 2007 (see Table 8-2, Appendix).
One of the most striking finding is that the US appears at the top of each ranking. This
confirms the strong position of the US in the network as a source and destination of
technological collaboration and, above all, as a central 'hub' of the network. Concerning the
network. The case of Japan is also interesting. Although this country is commonly considered
as a world innovation power house, e.g. the number of patents submitted by Japanese
inventors remains unchallenged, its role in the process of innovation internationalisation and
collaboration is relatively weak (G. De Prato, Nepelski, & Stancik, 2011). Regarding the level
of strength, si , we can see that there is indeed a strong correlation between nodes' degree and
strength. Again, developed countries, e.g. the US, Germany, are holding top positions in terms
of the output of inventive collaboration. However, also here we can see that over the last two
decades the landscape of international collaboration has considerably changed. In particular, a
number of Asian countries that were not on the map in 1990 has entered the game and already
in 2007 occupied top positions. Here the most prominent examples are China and India.
Whereas, the degree centrality and strength of a node reveals how powerful or influential
countries are in the network, closeness centrality, informs how well connected a node is in
terms of the shortest paths to others actors of the network. Among the countries included in
the collaboration network the US again emerges on the top of the ranking time and again.
The betweenness centrality index, b i
C , reflects the position of a country as a core or a hub in
the network of international technological collaboration. Over the analysed period, the US has
held a clear and strong position as a network hub. Although the relative level of its
betweenness index has decreased significantly over time, this position is rather unlikely to be
challenged in the nearest future. The analysis of the betweenness centrality ranking shows
additionally that countries such as the US, Germany, Russia, France and South Korea are
likely to play the role of 'regional hubs', due to their the geographic position.
5 The determinants of international technological collaboration
In order to find an explanation of the results presented in the previous sections, we should
know what determines international technological collaborations in terms of the structure of
the network. Unfortunately, theoretical models dealing with this issue are virtually
non-existent and any attempt of dealing with the internationalization of innovation focuses on
explaining the pattern and intensity of international innovation activities from the perspective
the whole system.5 The closest theoretical concept suitable for an empirical analysis of
innovation internationalisation is the gravity model of trade, which, except for being widely
used in the studies of international trade (De Benedictis & Tajoli, 2011), has already been
applied to study this issue (Picci, 2010; Thomson, 2011). This specification allows to
formulate prediction concerning the structure of a network, i.e. the existence of trade
relationships or technological collaboration between countries. The straightforward form of
the gravity equation can be expressed by
ij j i
ij
D GDP GDP
L = ⋅ (2)
where two vertices, Viand Vj, with non-negative GDP included in P - value function of a
vertex- and the geographic distance Dij, captured by the arc value function W, are expected
to develop a positive exchange link (i.e. Lij =1).
Taking this theoretical prediction as a starting point, we proceed with formulating a model in
which we expect that a country's position in the network of international technological
collaborations depends on some of its characteristics. To identify these determinants, we
derive a set of factors that are used in studies conceptualising the issue innovation
internationalization (Boutellier et al., 2008; Dunning, 1988, 1994; Kuemmerle, 1999; Narula,
2003).
Among the most important drivers of looking for collaboration partners abroad is the access
to the resources that, in most cases, are non-transferable and location-specific (Dunning,
1988, 1994). Examples of such resources include inputs to R&D activity, e.g. scientists and
universities, or the knowledge about customers and markets. Another reason to engage into
international technological collaborations is the access to the market and hence, the potential
size of the economy should be also taken as a predictor of link formation among countries.
Accordingly, the empirical studies of the determinants of the innovation internationalization
can be grouped around two main blocks: economic capacity and inventive performance of a
country (Dachs & Pyka, 2010; Guellec & Van Pottelsberghe de la Potterie, 2001; Patel &
Pavitt, 1991; Picci, 2010). These two elements are expected to reflect the asset exploitation
and asset seeking behaviour of companies deciding where to establish their international R&D
5 Similar situation is with the issue of international trade, where the most common approach is to look at the trade
activities (Kuemmerle, 1999). Whereas the former one concerns the economic benefit of
adapting and customising existing products to the need of consumers and with the aim of
selling them on the local, the latter one refers to the attempts of acquiring know-how and
technology new to a company.
Our work extends the previous analysis of the determinants of the innovation
internationalization by including measures of a country's network position derived in the
previous section. The rationale behind it is that as the network evolves, countries take over
various functions in the network, e.g. a hub or an intermediary. Performing these functions
has further impact on the formation of new ties. This happens due to, for example, the
preferential attachment principle, i.e. new countries attach preferentially to countries that are
already well connected (Barabási & Albert, 1999). Thus, our function of the intensity of
technological collaboration between countries takes the following form:
) , , , , , , , , ,
, ,
( ij ij it jt it jt it jt it jt ijt
ijt f CommLang Dist GDP GDP FDI FDI Inv Inv N N
CoInn = α ε (3)
whereCoInnijtrepresents the count of patented inventions developed by inventors residing in
country j and country i formed in t∈(1990,2007). To explain the relationship between the
intensity of linkages between countries both we use a number of variables that are related to a
country' characteristics in the following areas: geographical and cultural proximity, economic
size, innovative potential, and, finally, its position in the network.
Geographical and cultural proximity: Concerning the geographical proximity, we use a
variable controlling for the distance between countries i and j,Distij. In addition, in order to
account for other frictions in inventive collaboration resulting from cultural differences, we
include a dummy variable CommLangij, which indicates whether two countries share a
common official language.6
Economic size: Regarding economic size of countries linked through technological
collaboration, information on GDP (in current US$) both country i and j in period t is
included. Similar situation is with the variables controlling for the inflowing FDI. These
measures are supposed to account for the economic attractiveness of both countries. In order
6 The source of the distance and common language variables is CEPII bilateral trade data (Head, Mayer, & Ries,
to control for the internationalisation of economic activity, we also include measures of
foreign direct investment for each country (in current US$).7
Innovative potential: Expecting that not only distance hiders and economic factors facilitate
international technological collaborations, we control for the innovation performance of both
countries proxied by the total number of patents of country i and j at time t. This has a double
interpretation. On the one hand, from the perspective of one country, the measure of its
inventive performance indicates the inventive capacity which might attract technological
collaboration partners. On the other hand, from the perspective of another country, it might be
a proxy of its absorptive capacity. In both cases, innovation performance of a country is
captured by the total number of patent applications of each country and is computed through
fractional counting of inventors in each priority patent application submitted to one of 59
patent offices around the world.8 Our methodology of computing patent statistics for the
purpose of this paper follows (de Rassenfosse et al., 2011; Turlea et al., 2011).9
A country's position in the network: A vector of network measures included in the above
specification, N, includes the measures of degree, strength and closeness centrality at time t.
As explained above, the inclusion of these measures is motivated by the fact that the existence
or establishment of bilateral linkages between two countries involving technological
collaboration can affect the existence or establishment of such linkages between a different
pair of countries. Thus, network measures are expected to capture such externalities, which in
practice are frequently treated as unobserved heterogeneity or controlled for with country
effect estimators. Like in the case of international trade (De Benedictis & Tajoli, 2011),
indicators capturing the relative position of a country with respect to the entire system allows
to consider interdependence between pair-wise linkages more appropriately.
6 Empirical
results
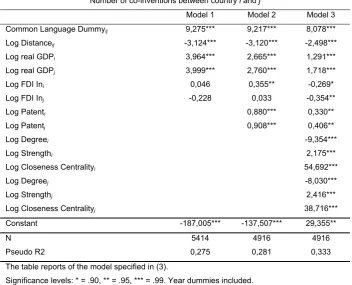
To estimate the function specified in (3), we run regression with time fixed effects. Table 6-1
reports the results where the dependent variable was the total number of patented inventions
7 Data stems from the IMF. For more information please refer to: http://www.imf.org/external/data.htm
8 To the selected patent offices in 2007 were filed 99.7% of the total number of priority patent applications. The
complete list of considered Patent Offices includes: EPO, EU27 Member States, USPTO, JPO, Arab Emirates, Australia, Brazil, Canada, Chile, China, Columbia, Croatia, Hong Kong, Iceland, India, Indonesia, Israel, Korea, Malaysia, Mexico, New Zealand, Norway, Pakistan, Philippines, Puerto Rico, Russia, Singapore, South Africa, Switzerland, Taiwan, Thailand, Turkey and Vietnam.
9
per link i and j at time t. For gravity model, we report first estimations with variables
controlling for geographic and cultural proximity, economic size, and net FDI in-flows. The
extended specification includes controls of inventive performance. Finally, we add the
network indices as explanatory variables. The network indices refer to country i and j.
All the coefficients of the standard gravity model, i.e. distance, common language and the
economy size, have the expected signs, and are significant. The coefficients of the FDI
in-flows are not relevant. Regarding the second estimation, we can see that the coefficients
related to the number of patents show significant impact on the establishment of technological
collaboration between countries. Thus, though to a smaller extent than economic size,
inventive capacities of countries positively influence the performance of technological
collaboration.
The results reported above confirm that access to the resources that are non-transferable and
location-specific are behind factors driving international technological collaboration.
Examples of such resources include inputs to R&D activity, e.g. scientists and universities, or
the knowledge about customers and markets. Moreover, economic potential of a market
additionally increases the incentives to establish a collaborative relationship. These
motivations are, however, moderated by geographical and cultural distance. The central issue
here seems to be the difficulty to exchange and transfer tacit knowledge. Despite the
availability of modern communication technologies, the lack of direct interactions hampers
the exchange of knowledge and expertise. Furthermore, differences in national and regional
business environments captured by physical and cultural distance might create some
incompatibilities or conflict of interests between individuals or organizations from distinct
countries. Such sources of incompatibilities include industrial relations, technical and
scientific institutions, policies, and many other national institutions that are fundamental to
innovative activities (C. Freeman, 1995). For example, differences in institutional
arrangements might be an obstacle to the creation of a common framework governing
cross-border business activities (Carlsson, 2006). Thus, the combination of the differences and
similarities between countries might play a role in stimulating or dampening the progress of
technological collaboration across the borders.
Regarding the network indicators, we observe that they are very strong and significant.
Whereas a node's degree has a negative impact on the level of output of technological
cooperation, the remaining measures, i.e. a node's strength and closeness, show very strong
interpreted as a decreasing marginal advantage of increasing the degree. This shows some
similarities to the observations that were made in the context of international trade, where
degree of a country is negatively correlated with its trade volumes (De Benedictis & Tajoli,
2011). If true, it would imply that there is some exclusivity in collaboration ties and a creation
of a new connection takes place at the cost of the intensity of existing relationships. Hence,
both individuals and organizations face a trade off between increasing the intensity of existing
relationships and establishing new ones.
Concerning the strong effect of the closeness coefficient on the intensity of technological
collaborations, the results show also that nodes positioned in the centre of the network, i.e.
with short geodesic distances to other nodes in the network, tend to have more intense
relationships with their partners. This finding might suggest that countries located in the
centre of the network, i.e. countries being in the centre of collaborative knowledge and
technology creation, are likely to benefit from this position. The central position allows them
to get access and to absorb different types of knowledge and technology resources and, hence
to leverage inventive performance.
Finally, it is worth noting that the inclusion of network indices has also a considerable impact
on the standard gravity variables, which are considered as important drivers of international
technological collaboration. For example, the negative impact of distance and the positive one
of cultural proximity are weakened. This does not come as a surprise, as the position of a
country might be independent from its geographical or cultural positions, as compared to
other countries. The case of the intensive collaboration between, for example, the US and
China or some European countries is a clear example of this. Surprisingly, the inclusion of
network indices reduce considerably the role of GDP of both countries involved into a
collaboration relationship. This suggests that the economic attractiveness becomes less
important when we take into account a country's position in the R&D network, adding some
Table 6-1. Estimation results
Number of co-inventions between country i and j
Model 1 Model 2 Model 3
Common Language Dummyij 9,275*** 9,217*** 8,078***
Log Distanceij -3,124*** -3,120*** -2,498***
Log real GDPi 3,964*** 2,665*** 1,291***
Log real GDPj 3,999*** 2,760*** 1,718***
Log FDI Ini 0,046 0,355** -0,269*
Log FDI Inj -0,228 0,033 -0,354**
Log Patenti 0,880*** 0,330**
Log Patentj 0,908*** 0,406**
Log Degreei -9,354***
Log Strengthi 2,175***
Log Closeness Centralityi 54,692***
Log Degreej -8,030***
Log Strengthj 2,416***
Log Closeness Centralityj 38,716***
Constant -187,005*** -137,507*** 29,355**
N 5414 4916 4916
Pseudo R2 0,275 0,281 0,333
The table reports of the model specified in (3).
Significance levels: * = .90, ** = .95, *** = .99. Year dummies included.
Source: Own calculations based on PATSTAT Database, version 2010
7 Conclusions
We are witnessing the emergence of a global innovation network, a result of companies'
decisions concerning the location of their innovation activities and selection of their
technological collaboration partners. The increasing internationalisation of innovation let us
believe that firms' choices create externalities and that they mutually affect each other. To
better understand these interdependencies, we apply network analysis to study the global
network of international technological collaborations. Our results show that the inclusion of
network indices delivers new insights to the understanding of the formation and intensity of
technological collaboration between countries.
The global technological collaboration network is not regular and far from being complete
and the network shows signs of "cliquishness". This together with the fact that most of the
countries tend to be members of some local or regional groups and that only few countries go
collaboration network. In such a network, a number of countries are connected only to the so
called 'hubs'. Similar to production networks, the distributions of control and contribution in
innovation network are not equal and there are few hubs. The meaning of findings of this
work concerning the developments of the global technological collaboration network is not
the same for each country participating in the process of innovation internationalisation.
Depending on the perspective of a particular country, the implications may be perceived as
positive by some countries and negative by others. It is however clear that the bargaining
power and a country's attractiveness as a technological collaboration partner will strongly
depend on its relative position against the competing countries and, of course, its position in
the network.
The main policy implications that can be formulated based on the results are the following:
First, when strengthening technological and scientific capabilities with the aim of benefitting
from technological collaborations, countries need to take into account broader environment in
which there are many countries that both compete and collaborate with each other. Thus,
policy makers designing, formulating and executing their innovation and science and
technology collaboration policies need to answer such questions as: What position does my
country occupy in the network of global technological collaboration? What are the other
countries that my country competes/cooperates? How my/their actions will change my/their
position in the system of mutual interdependencies? In other words, a clear positioning
strategy is required in order to maximise the benefits of international collaboration.
Second, although building a strong knowledge base is a necessary condition for participating
in the global innovation network, it might not be a sufficient condition to generate the most
out of this participation. Seeking, exploiting and transferring knowledge across the borders
are equally important in the context of increasing collaboration and, hence, dependencies on
what other countries produce and absorb. Thus, efforts towards international technology
transfer should be strengthen to create a culture and mechanisms, e.g. IP rules and markets,
supporting technology transfer and technological collaboration.
Third, one of the major reasons behind the emergence of the global R&D network is the
increasing complexity of technologies and business processes. This requires both firms and
countries to specialize. Thus, innovation policies should include an assessment of a country's
strengths and mechanisms towards their enhancement with the aim of finding and maintaining
Lastly, the creation, structure and functioning of the global R&D network challenge the
traditional way of research and innovation policy making, usually shaped by one-sided
perspective defined by the notion of competition. If this way of organising economic activity
in general and innovative activity in particular, becomes dominant in the future, one can
expect that the network viability and countries' positions in this network will depend on their
ability to develop collaboration mechanisms that support mutual co-dependencies between
them.
In conclusion, although the paper provides a number of valuables insights concerning the
structure of the technological collaboration network and the determinants of technological
collaboration, it suffers from a few limitations. First of all, patent data, despite its richness of
information, suffers from its own drawbacks. Second, due to the fact that there is no
theoretical foundation explaining the formation and evolution of innovation networks, we do
not offer any empirical insights into the development of such a network. Instead, we are
forced to stop at including measures identifying the position of a country in the network to
explain the intensity of its bilateral collaboration links. Nevertheless, the results presented
here show that the inclusion of network indices are well justified. In addition to the standard
explanatory variables, they deliver additional information explaining the existence and
intensity of technological collaboration between countries. This makes us optimistic about the
future of the value of network analysis in the context of internationalisation of innovation.
8 Appendix
8.1 Definition and characteristics of a network
A network consists of a graph whose elements include two sets: set of nodes (vertices), that
correspond to the selected unit of observation, and a set of lines (lines, relationships), that
represent relations between units. A line can be directed – an arc, or undirected – an edge. In a
formal way, a network
N = (V,L,W,P) (4)
consists of a graph G = (V,L), where V is the set of nodes, andL=E∪A is the set of lines,
where A is the set of arcs, if the lines are directed, and E is the set of edges, if the lines are not
directed. Additional information on the lines is given by the line value function W and on
Regarding the structural properties of a network, the density of a network is, among others, a
key indicator providing information about the network structure. The density of a network is
the number of edges that is expressed as a proportion of the maximum possible number of
connections. It is formally defined as
max
m m =
λ (5)
where mmax is the total number of lines in a complete network, i.e. a network where all the
nodes are connected to each other, given the same number of nodes.
In order to obtain further information on the structure of a network it is worthwhile to analyse
centrality of the network and the nodes, a concept widely adopted in studies of networks (L.
C. Freeman, 1978). In conceptual terms, centrality measures how central an individual is
positioned in a network. The most obvious way of capturing degree centrality of Vi is
counting the number of its neighbours, i.e. its degree. The way to compute degree centrality is
to count the number of nodes connected to Vi, i.e.:
1 − = V d Cd
i . (6)
Nodes' centralities in a network can have large or small variance. On the one hand, a network,
where few actors have much higher centrality than other actors is said to be strongly
centralised. A typical example is a star network. On the other hand, if unit centrality measures
have small variance, the centralisation of a network is low. Thus, in order to assess the level
of centralisation of the entire network, we use a network degree centralisation defined as
, ) 1 )( 2 ( | | 1 * − − − =
∑
= n n C C C n i d i d i d (7)where Cid*is the highest value of centrality measure in the set of units of a network (L. C.
Freeman, 1978). Network centralisation index can take any value between 0, if all units have
equal centrality value (cycle graph), and 1, if one unit completely dominates all other units
(star graph).
Regarding the intensity of interactions, the degree measures can be replaced by node strength
capturing the sum of weights given to the connections to any Vi. Similarly to the degree
measures, it is possible to capture the intensity of connections of vertex i. In a formal way,
∑
≠ ≡ i j ij i w s (8)where wij represent the intensity of the directed link from Vi to Vj (Squartini, Fagiolo, &
Garlaschelli, 2011).
Except for the degree centrality defined in (6), within graph theory and network analysis,
there are a number of other measures of the centrality of a vertex within a graph that show the
relative importance of a vertex within the graph (Koschützki et al., 2005). In this paper we use
of three additional most commonly applied measures, i.e. closeness centrality and
betweenness centrality.
The degree centrality strength of a node reveals how powerful or influential it is in the
network. Closeness centrality, on the other hand, informs how powerful a node is in terms of
the shortest paths to others actors of the network. The closeness centrality of a node i is the
number of the remaining nodes divided by the sum of all distances between that node and all
the remaining ones, i.e.:
∑
− ≠ ∂− = n11
i j ij c i n C . (9)
At the aggregate level, centrality closeness of a network is defined as:
, ) 3 2 /( ) 1 )( 2 ( | | 1 * − − − − =
∑
= n n n C C C n i c i c i c (10)where c*
i
C is the highest value of closeness centrality measure in the set of units of a network
(L. C. Freeman, 1978). The index takes values between 0 and 1, whereas the closeness
centrality of a star network is 1.
The betweenness centrality of a node is the proportion of all geodesics distances between
pairs of other nodes that include this vertex and it reflects the number of times a node appears
on the shortest path between any two other nodes. This property of a network reflects the
amount of control that a node exerts over the interactions of other nodes in the network
(Yoon, Blumer, & Lee, 2006). The measure of betweenness centrality rewards nodes that are
part of communities, rather than nodes that lie inside a community. Therefore, it can be
regarded as a measure of gatekeeping and is considered to be a measure of strategic advantage
,
∑
≠ ∂ ∂ = k j jk i jk b i C (11)where∂jkis the total number of shortest paths joining any two nodes Vk and Vj, and∂ijkis the
number of those paths that not only connect Vk and Vj, but also pass through Vi. The
betweenness centrality of each node is a number between 0 and 1.
Similarly, the network betweenness centralization index measure can be defined as:
, ) 1 ( | | 1 * − − =
∑
= n C C C n i b i b i b (12)whereCib*is the highest value of betweenness measure among all nodes. This measure
compares the variance of betweenness centrality in a network and takes as a reference a star
graph ( b
C =1). In such a graph, the node in the middle holds the highest betweenness
centrality, i.e. a strategic position and the graph is highly unequal or highly centralized.
Further measure of a node's position in the network used in this study relates to the extent of
clustering between nodes. This property of a network structure can by captured by the
clustering coefficient (Watts & Strogatz, 1998), which reflects the percentage of pairs of node
i nearest neighbours that are themselves partners. In undirected networks, the clustering
coefficient cc i
C of node i is defined as
)) 1 ( ( 2 − = i i n cc i k k e C (13)
where ki is the degree of Vi and en is the number of connected pairs between all neighbours of
i (Barabasi & Oltvai, 2004). The average clustering coefficient of a network is a sum of
clustering coefficient values of all nods divided by the total number of nodes in the network.
The global clustering coefficient is always a number between 0 and 1, where for a fully
connected network CC=1.
Table 8-1. Global technological collaboration network indices
1990 1995 2000 2005 2007
Number of nodes 79 104 113 124 125
Link count 252 491 651 826 881
Average degree 16,56 30,54 46,14 60,52 63,93
Average degree scaled 0,062 0,049 0,047 0,047 0,046
Average strength 10,30 21,10 34,62 47,20 49,83
Density 0,040 0,045 0,051 0,054 0,056
Closeness centrality 0,016 0,011 0,012 0,011 0,012
Betweenness 0,027 0,031 0,024 0,027 0,024
Clustering centrality 0,420 0,566 0,601 0,630 0,626
Table 8-2. Countries' position in the technological collaboration network
Degree centrality Strength Closeness centrality Betweenness centrality Rank Country Value Country Value Country Value Country Value
1990
1 US 60 US 207 US 0,804 US 0,604
2 Germany 35 Germany 126 Germany 0,634 Germany 0,141
3 UK 25 Japan 62 UK 0,582 Poland 0,092
4 Switzerland 22 France 55 Switzerland 0,561 UK 0,059
5 France 22 Switzerland 52 France 0,542 Austria 0,056
6 Canada 20 UK 46 Canada 0,542 India 0,051
7 Japan 19 Canada 39 Japan 0,534 France 0,040
8 Italy 18 Belgium 21 Italy 0,534 Switzerland 0,027
9 Netherlands 15 Italy 21 Poland 0,520 Russia 0,027
10 Austria 15 Netherlands 21 Sweden 0,520 Mexico 0,026
11 Belgium 15 Austria 20 Austria 0,520 Czech R. 0,026
12 Sweden 14 Sweden 12 Belgium 0,517 Denmark 0,026
13 Poland 13 S. Korea 9 Hungary 0,513 Hungary 0,021
14 Hungary 12 Poland 9 Netherlands 0,506 Canada 0,017
15 Denmark 11 Israel 7 Spain 0,497 Japan 0,016
2000
1 US 78 US 896 US 0,767 US 0,298
2 Germany 72 Germany 611 Germany 0,737 Germany 0,210
3 France 52 France 241 France 0,647 Russia 0,139
4 UK 48 UK 239 UK 0,636 France 0,086
5 Russia 48 Japan 207 Russia 0,626 Italy 0,066
6 Japan 45 Switzerland 194 Japan 0,622 Japan 0,057
7 Switzerland 39 Canada 163 Switzerland 0,605 UK 0,038
8 Italy 39 Netherlands 140 Italy 0,596 S. Korea 0,026
9 Canada 35 Belgium 108 Canada 0,589 Spain 0,025
10 Spain 34 Russia 99 Sweden 0,586 Sweden 0,025
11 Sweden 34 Italy 84 Spain 0,583 Taiwan 0,024
12 Austria 32 Taiwan 79 Austria 0,580 Switzerland 0,022
13 Netherlands 30 Austria 77 Netherlands 0,571 Norway 0,021
14 Finland 29 Sweden 73 Finland 0,569 Poland 0,018
15 Belgium 28 China 73 Belgium 0,560 Monaco 0,018
2007
1 US 164 US 1313 US 0,747 US 0,262
2 Germany 152 Germany 819 Germany 0,721 Germany 0,156
3 France 124 S. Korea 419 France 0,667 Russia 0,102
4 UK 110 France 336 UK 0,639 France 0,091
5 S. Korea 108 UK 318 Netherlands 0,636 S. Korea 0,054
6 Russia 108 Japan 305 Russia 0,633 Spain 0,049
7 Netherlands 106 China 295 S. Korea 0,629 China 0,047
8 Japan 98 Switzerland 262 Japan 0,623 UK 0,039
9 Australia 90 Canada 197 Switzerland 0,611 Italy 0,034
10 China 90 Netherlands 195 China 0,605 Netherlands 0,031
11 Switzerland 90 India 188 Austria 0,605 Japan 0,030
12 Italy 88 Belgium 138 Spain 0,605 Sweden 0,024
13 Spain 88 Russia 136 Italy 0,602 Canada 0,023
14 Sweden 82 Austria 126 Sweden 0,596 Switzerland 0,022
15 India 78 Taiwan 123 India 0,590 Australia 0,020
Table 8-3. Descriptive statistics
Variable Obs Mean Std. Dev. Min Max
Distance 10.250 5.491,20 4.575,51 59,62 19.586,18
GDP i 9.762 1.250,00 2.390,00 0,05 14.100,00
GDP j 10.239 1.290,00 2.440,00 0,09 14.100,00
FDI IN i 7.622 29.249,75 50.251,81 -31.670,39 321.276,00
FDI IN j 7.979 30.638,73 52.133,89 -31.670,39 321.276,00
Patent i 10.250 21.623,33 60.374,52 0,00 359.642,10
Patent j 10.250 22.292,00 61.176,10 0,00 359.642,10
Degree i 10.239 31,73 25,35 1,00 164,00
Strength i 10.250 139,34 230,06 0,08 1.313,25
Closeness Centrality i 10.239 0,56 0,09 0,28 0,80
Degree j 10.231 33,04 26,40 1,00 164,00
Strength j 10.250 145,24 238,83 0,08 1.313,25
Closeness Centrality j 10.231 0,56 0,09 0,27 0,80
The table reports descriptive statistics of variables used, pair wise, in the model. GDP denotes gross domestic product in current billion US $ for each country, FDI in refers to the amount of inflowing FDI in current US $. Patent reports the fractional count of priority patent applications in which inventors coming from the country participated. The following three pairs of variables are the main centrality measures coming from the network analysis. Source: Own calculations based on PATSTAT Database, version 2010
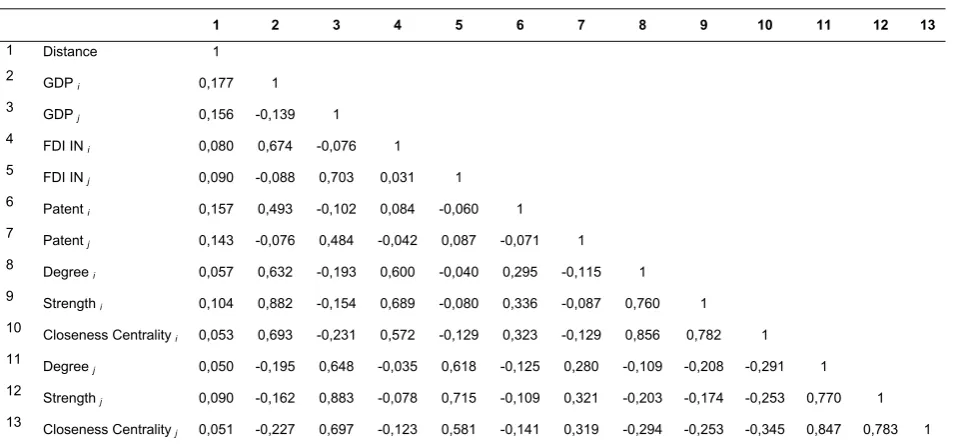
Table 8-4. Pair-wise correlations
1 2 3 4 5 6 7 8 9 10 11 12 13
1 Distance 1
2
GDP i 0,177 1
3 GDP
j 0,156 -0,139 1
4
FDI IN i 0,080 0,674 -0,076 1
5 FDI IN
j 0,090 -0,088 0,703 0,031 1
6 Patent
i 0,157 0,493 -0,102 0,084 -0,060 1
7
Patent j 0,143 -0,076 0,484 -0,042 0,087 -0,071 1
8 Degree
i 0,057 0,632 -0,193 0,600 -0,040 0,295 -0,115 1
9
Strength i 0,104 0,882 -0,154 0,689 -0,080 0,336 -0,087 0,760 1
10
Closeness Centrality i 0,053 0,693 -0,231 0,572 -0,129 0,323 -0,129 0,856 0,782 1
11 Degree
j 0,050 -0,195 0,648 -0,035 0,618 -0,125 0,280 -0,109 -0,208 -0,291 1
12
Strength j 0,090 -0,162 0,883 -0,078 0,715 -0,109 0,321 -0,203 -0,174 -0,253 0,770 1
13 Closeness Centrality
j 0,051 -0,227 0,697 -0,123 0,581 -0,141 0,319 -0,294 -0,253 -0,345 0,847 0,783 1
[image:24.595.68.551.370.592.2]References
Archibugi, D., & Iammarino, S. (2002). The globalization of technological innovation: definition and
evidence. Review of International Political Economy, 9(1), 98-122.
Asheim, B. T., & Isaksen, A. (2002). Regional Innovation Systems: The Integration of Local 'Sticky'
and Global 'Ubiquitous' Knowledge. The Journal of Technology Transfer, 27(1), 77-86.
Audretsch, D. B., & Feldman, M. P. (1996). R&D Spillovers and the Geography of Innovation and
Production. American Economic Review, 86(3), 630-640.
Audretsch, D. B., & Lehmann, E. E. (2005). Mansfield's Missing Link: The Impact of Knowledge
Spillovers on Firm Growth. The Journal of Technology Transfer, 30(2_2), 207-210.
Barabási, A.-L., & Albert, R. (1999). Emergence of Scaling in Random Networks. Science, 286(5439),
509-512.
Barabasi, A.-L., & Oltvai, Z. N. (2004). Network biology: understanding the cell's functional
organization. Nat Rev Genet, 5(2), 101-113.
Bartholomew, S. (1997). National Systems of Biotechnology Innovation: Complex Interdependence in
the Global System. Journal of International Business Studies, 28(2), 241-266.
Bartlett, C., & Ghoshal, S. (1990). Managing innovation in the transnational corporation. In C.
Bartlett, Y. Doz & G. Hedlund (Eds.), Managing the Global Firm: London, Routledge.
Belderbos, R., Fukao, K., & Iwasa, T. (2006). Foreign and Domestic R&D Investment: Institute of
Economic Research, Hitotsubashi University.
Bergek, A., & Bruzelius, M. (2010). Are patents with multiple inventors from different countries a
good indicator of international R&D collaboration? The case of ABB. Research Policy,
39(10), 1321-1334.
Boutellier, R., Gassmann, O., & Zedtwitz, M. v. (2008). Managing Global Innovation: Uncovering the
Secrets of Future Competitiveness: Springer.
Breschi, S., & Lissoni, F. (2004). Knowledge networks from patent data: Methodological issues and
research targets: KITeS, Centre for Knowledge, Internationalization and Technology Studies, Universita' Bocconi, Milano, Italy.
Cantwell, J., & Santangelo, G. D. (2000). Capitalism, profits and innovation in the new
techno-economic paradigm. Journal of Evolutionary Economics, 10(1), 131-157.
Carlsson, B. (2006). Internationalization of innovation systems: A survey of the literature. Research
Policy, 35(1), 56-67.
Chao-Chih, H. (2009). The Use of Social Network Analysis in Knowledge Diffusion Research from
Patent Data. Paper presented at the International Conference on Advances in Social Network Analysis and Mining.
Cooke, P. (2002). Regional Innovation Systems: General Findings and Some New Evidence from
Biotechnology Clusters. The Journal of Technology Transfer, 27(1), 133-145.
Dachs, B., & Pyka, A. (2010). What drives the internationalisation of innovation? Evidence from
European patent data. Economics of Innovation and New Technology, 19(1), 71-86.
De Benedictis, L., & Tajoli, L. (2011). The World Trade Network. The World Economy, 34(8),
1417-1454.
De Prato, G., & Nepelski, D. (2011). Global R&D network. Network analysis of international R&D centres. Seville, Spain: JRC-IPTS.
De Prato, G., Nepelski, D., & Stancik, J. (2011). Internationalisation of ICT R&D: Institute for
Prospective Technological Studies, Joint Research Centre, European Commission.
De Prato, G., Nepelski, D., Szewczyk, W., & Turlea, G. (2011). Performance of ICT R&D: Institute
de Rassenfosse, G., Dernis, H., Guellec, D., Picci, L., & van Pottelsberghe de la Potterie, B. (2011). A
corrected count of priority filings. Melbourne Institute of Applied Economic and Social
Research Working Paper, forthcoming.
Doz, Y. L., Santos, J., & Williamson, P. (2001). From Global to Metanational: How Companies Win
in the Knowledge Economy: Harvard Business Press.
Dunning, J. H. (1988). The Eclectic Paradigm of International Production: A Restatement and Some
Possible Extensions. Journal of International Business Studies, 19(1), 1-31.
Dunning, J. H. (1994). Multinational enterprises and the globalization of innovatory capacity.
Research Policy, 23(1), 67-88.
Edler, J., & Polt, W. (2008). International industrial R&D - policy challenges: introduction to the
special issue. The Journal of Technology Transfer, 33(4), 331-336.
Fagiolo, G., Reyes, J., & Schiavo, S. (2007). The Evolution of the World Trade Web: Laboratory of
Economics and Management (LEM), Sant'Anna School of Advanced Studies, Pisa, Italy. Florida, R. (1997). The globalization of R&D: Results of a survey of foreign-affiliated R&D
laboratories in the USA. Research Policy, 26(1), 85-103.
Freeman, C. (1995). The ‘National System of Innovation’ in historical perspective. Cambridge
Journal of Economics, 19(1), 5-24.
Freeman, L. C. (1978). Centrality in social networks conceptual clarification. Social Networks, 1(3),
215-239.
Gassler, H., & Nones, B. (2008). Internationalisation of R&D and embeddedness: the case of Austria.
The Journal of Technology Transfer, 33(4), 407-421.
Glänzel, W., & Schubert, A. (2005). Analysing Scientific Networks Through Co-Authorship. In H.
Moed, W. Glänzel & U. Schmoch (Eds.), Handbook of Quantitative Science and Technology
Research (pp. 257-276): Springer Netherlands.
Glänzel, W., Schubert, A., & Czerwon, H.-J. (1999). A bibliometric analysis of international scientific
cooperation of the European Union (1985–1995). Scientometrics, 45(2), 185-202.
Guellec, D., & Van Pottelsberghe de la Potterie, B. (2001). The internationalisation of technology
analysed with patent data. Research Policy, 30(8), 1253-1266.
Gulbrandsen, M., & Godoe, H. (2008). “We really don’t want to move, but...”: identity and strategy in
the internationalisation of industrial R&D. The Journal of Technology Transfer, 33(4),
379-392.
Han, Y.-J., & Park, Y. (2006). Patent network analysis of inter-industrial knowledge flows: The case
of Korea between traditional and emerging industries. World Patent Information, 28(3),
235-247.
Hausmann, R., & Hidalgo, C. (2009). The Building Blocks of Economic Complexity. Paper presented
at the Proceedings of the National Academy of Sciences.
Head, K., Mayer, T., & Ries, J. (2010). The erosion of colonial trade linkages after independence.
Journal of International Economics, 81(1), 1-14.
Koschützki, D., Lehmann, K. A., Peeters, L., Richter, S., Tenfelde-Podehl, D., & Zlotowski, O.
(2005). Centrality Indices. In U. Brandes & T. Erlebach (Eds.), Network Analysis:
Methodological Foundations (pp. 16–61): Springer-Verlag.
Kretschmer, H. (2004). Author productivity and geodesic distance in bibliographic co-authorship
networks, and visibility on the Web. Scientometrics, 60(3), 409-420.
Kuemmerle, W. (1999). The Drivers of Foreign Direct Investment into Research and Development:
An Empirical Investigation. Journal of International Business Studies, 30(1), 1-24.
Lai, R., D'Amour, A., Yu, A., Sun, Y., & Fleming, L. (2011). Disambiguation and Co-authorship
Networks of the U.S. Patent Inventor Database (1975 - 2010).
Narula, R. (2003). Globalization and Technology: Interdependence, Innovation Systems and Industrial
Narula, R., & Hagedoorn, J. (1999). Innovating through strategic alliances: moving towards
international partnerships and contractual agreements. Technovation, 19(5), 283-294.
Niosi, J., & Bellon, B. (1994). The global interdependence of national innovation systems: Evidence,
limits, and implications. Technology in Society, 16(2), 173-197.
Niosi, J., Manseau, A., & Godin, B. (2000). Canada's National System of Innovation. Montreal:
McGill-Queen’s University Press.
Patel, P., & Pavitt, K. (1991). Large Firms in the Production of the World's Technology: An Important
Case of "Non-Globalisation". Journal of International Business Studies, 22(1), 1-21.
Picci, L. (2010). The internationalization of inventive activity: A gravity model using patent data.
Research Policy, 39(8), 1070-1081.
Pittiglio, R., Sica, E., & Villa, S. (2009). Innovation and internationalization: the case of Italy. The
Journal of Technology Transfer, 34(6), 588-602.
Sachwald, F. (2008). Location choices within global innovation networks: the case of Europe. The
Journal of Technology Transfer, 33(4), 364-378.
Schmiele, A. (2011). Drivers for international innovation activities in developed and emerging
countries. The Journal of Technology Transfer, 1-26.
Shapira, P., Youtie, J., & Kay, L. (2011). National innovation systems and the globalization of
nanotechnology innovation. The Journal of Technology Transfer, 1-18.
Squartini, T., Fagiolo, G., & Garlaschelli, D. (2011). Rewiring World Trade. Part II: A Weighted
Network Analysis. ArXiv e-prints, 1103.1243.
Stefano, B., & Francesco, L. (2004). Knowledge networks from patent data: Methodological issues
and research targets: KITeS, Centre for Knowledge, Internationalization and Technology Studies, Universita' Bocconi, Milano, Italy.
Thomson, R. (2011). The globalisation of technology acquisition. Melbourne: Intellectual Property
Research Institute of Australia.
Turlea, G., Nepelski, D., De Prato, G., Simon, J.-P., Sabadash, A., Stancik, J., et al. (2011). The 2011
report on R&D in ICT in the European Union: Institute for Prospective Technological Studies, Joint Research Centre, European Commission.
Watts, D. J., & Strogatz, S. H. (1998). Collective dynamics of `small-world' networks. Nature,
393(6684), 440-442.
Yoon, J., Blumer, A., & Lee, K. (2006). An algorithm for modularity analysis of directed and
weighted biological networks based on edge-betweenness centrality. Bioinformatics, 22(24),