http://www.scirp.org/journal/am ISSN Online: 2152-7393 ISSN Print: 2152-7385
Nonparametric Regression Estimation with Mixed
Measurement Errors
Zanhua Yin, Fang Liu, Yuanfu Xie
College of Mathematics and Computer Science, Gannan Normal University, Ganzhou, China
Abstract
We consider the estimation of nonparametric regression models with predictors be-ing measured with a mixture of Berkson and classical errors. In practice, the Berkson error arises when the variable X of interest is unobservable and only a proxy of X can be measured while the inaccuracy related to the observation of the proxy causes an error of classical type. In this paper, we propose two nonparametric estimators of the regression function in the presence of either or both types of errors. We prove the asymptotic normality of our estimators and derive their rates of convergence. The fi-nite-sample properties of the estimators are investigated through simulation studies.
Keywords
Berkson Error, Classical Error, Deconvolution, Kernel Method, Mixed Measurement Errors
1. Introduction
Let
(
X Y1, 1)
,,(
X Yn, n)
denote a sequence of independent and identically distributed random vectors. In traditional non-parametric regression model analysis, one is in- terested in the following model( )
,i i i
Y =g X +e (1)
where g
( )
. is assumed to be a smooth, continuous but unknown function; therandom errors ei are assumed to be normally and independently distributed with
mean 0 and constant variance σ2; and
1, ,
i= n. Here, the predictor X is usually assumed to be directly observable without errors. Both the direct observation and error-free assumptions are however seldom true in most epidemiologic studies. For the violation of the error-free assumption, [1] considered an environmental study which studied the relation of mean exposure to lead up to age 10 (denoted as X) with
How to cite this paper: Yin, Z.H., Liu, F. and Xie, Y.F. (2016) Nonparametric Regres-sion Estimation with Mixed Measurement Errors. AppliedMathematics, 7, 2269-2284.
http://dx.doi.org/10.4236/am.2016.717179
Received: May 20, 2016 Accepted: November 27, 2016 Published: November 30, 2016
Copyright © 2016 by authors and Scientific Research Publishing Inc. This work is licensed under the Creative Commons Attribution International License (CC BY 4.0).
intelligence quotient (IQ) among 10-year-old children (denoted as Y) living in the neighborhood of a lead smelter. Each child had one measurement made of blood lead (denoted as W), at a random time during their life. The blood lead measurement (i.e., W) became an approximate measure of mean blood lead over life (X). However, if we were able to make many replicate measurements (at different random time points), the mean would be a good indicator of lifetime exposure. In other words, the measure- ments of X are subject to errors and W is a perturbation of X. In the measurement error literature, this is known as the classical error model and Model (1) becomes
( )
, ,i i i i i i
Y =g X +e W = X +ε (2)
where
(
e Xi, i,εi)
,i=1,,n, are mutually independent and ε represents the classical measurement error variable. Various methods and approaches for analyzing Model (2) such as deconvolution kernel approaches (e.g., [2][3][4]), design-adaptive local poly- nomial estimation method (e.g., [5]), methods based on simulation and extrapolation (SIMEX) arguments (e.g., [6][7][8][9]), and Bayesian approach (e.g., [10]) have been extensively studied in the literature.In many studies, it is however too costly or impossible to measure the predictor X exactly or directly. Instead, a proxy W of X is measured. For the violation of the direct observation assumption, [1] modified the aforementioned environmental study in which the children’s place of residence at age 10 (assumed known exactly) were classified into three groups by proximity to the smelter—close, medium, far. Random blood lead samples, collected as describe in the aforementioned design, were averaged for each group (denoted as W), and this group mean used as a proxy for lifetime exposure for each child in the group. Here, the same approximate exposure (proxy) is used for all subjects in the same group, and true exposures, although unknown, may be assumed to vary randomly about the proxy. This is the well-known Berkson error model. In other words, the predictor X are not directly observable and measurements on its surrogates W are available instead. The true predictor X is then a perturbation of W. The model of interest now becomes
( )
, ,i i i i i i
Y =g X +e X =W +δ (3)
where
(
e Wi, i,δi)
,i=1, 2,,n, are mutually independent. Model (3) was first con-sidered by [11] and the estimation of the linear Berkson measurement error models was discussed in [12]. Methods based on least squares estimation ([13]), minimum distance estimation ([14][15]), regression calibration ([16]) and trigonometric functions ([17]) have been studied.
with perfect accuracy. However, this may not be true in some situations. In such cases, W is observed through V =W+ε, where ε is a classical measurement error. [18]
presented a good discussion of the origins of mixed Berkson and classical errors in the context of radiation dosimetry. Under this mixture of measurement errors, we observe a random sample of independent pairs
(
V Yi, i)
, for i=1,,n, generated by( )
, , ,i i i i i i i i i
Y =g X +e X =W +δ V =W +ε (4)
where Wi fW , δi fδ , εi fε and ei are mutually independent, and the re-
spective error densities fδ and fε are assumed to be known. Due to its potentially
wide applications, statistical procedures for analyzing Model (4) has received more attention recently. For instance, a regression calibration approach was proposed by [19]
and [20] in a parametric context of random exposure. [21] considered a bayesian approach for a semi-parametric regression function. [22] developed a nonparametric density estimation approach for contaminated data with a mixture of Berkson and classical errors but without further extending to estimate the regression function. [23]
proposed a two-step nonparametric kernel method for estimating the regression function but its calculation is complicated. In this paper, we propose two non- parametric estimators for the regression function curve g
( )
. with the predictor Xbeing measured with either classical error, Berkson error, or a combination of both. The difficulty primarily depends on the relative smoothness of the error densities fδ and fε. When fδ is smooth enough (relative to fε), we are able to construct a nonparametric estimator that converges to the target curve at the parametric n rate.
For less smooth density fδ , we propose a kernel estimator that converges at rates ranging from n to rates that are close to the deconvolution rates.
This paper is organised as follows. In Section 2, we propose estimators for the regression function curve g
( )
. . We then derive the asymptotic normality of our estimators under some regularity conditions and give the rates of convergence in Section 3. Section 4 presents some numerical results from simulation studies. A brief discussion will be given in Section 5. All technical results and proofs are deferred to the Appendix.2. Proposed Estimators
Let
(
Y V1, 1)
,,(
Y Vn, n)
be a random sample from Models (4), and φX( )
t , φW( )
t ,( )
tδ
φ , φV
( )
t and φε( )
t be the characteristic functions of Xi, Wi, δi, Vi andi
ε , respectively. We have the following relationships:
( )
( ) ( )
,( )
( ) ( )
.X t W t δ t V t W t ε t
φ =φ φ φ =φ φ
Hence, if φε
( )
t does not vanish,( )
( ) ( ) ( )
.X t V t δ t ε t
φ =φ φ φ
Since φδ
( )
t and φε( )
t are assumed to be known, an estimate of φX( )
t can be( )
( ) ( ) ( )
( )
( )
1
1
ˆ ˆ , with ˆ n exp .
X V V j
j
t t t t t itV
n
δ ε
φ φ φ φ φ
=
= =
∑
Noticing that, if φ
( )
t is absolutely integrable, the characteristic function φ( )
t andits density function f x
( )
have the following relation( )
1(
) ( )
exp d ,
2π
f x =
∫
−itx φ t tunder the condition that φδ
( ) ( )
t φε t ∈L1( )
, the density estimator of Xi is thengiven by
( )
(
) ( )
(
)
1
1 1
ˆ exp ˆ d ,
2π
n
X X i
i
f x itx t t G x V
n
δ ε φ
=
=
∫
− =∑
− (5)where
( )
1( ) ( )
e d .
2π itx
Gεδ x =
∫
− φδ t φε t tAs a result, we propose the following estimator for g x
( )
( )
(
)
(
)
1 1 1 ˆ . 1 n i i i n i in G x V Y
g x
n G x V
δ ε δ ε = = − = −
∑
∑
(6) Example 1 Let the error densities fδ and fε in Model (4) be normal densities with mean zero and variances 2δ
σ and 2
ε
σ , respectively. It follows that
( ) ( )
2 21
1 exp
2
t t t
δ ε
φ φ = − σ
with
2 2 2
1 δ ε
σ =σ −σ . If we assume 2 2
δ ε
σ >σ , then the
ratio φδ
( ) ( )
t φε t is the characteristic function of another normal random variable. By (6), the estimator of g x( )
can be written as( )
( )(
)
( )(
)
1 1 0, 1 0, 1 1 ˆ 1 n i i i n i in x V Y
g x
n x V
σ σ ψ ψ = = − = −
∑
∑
where ψ(0,σ1)
( )
x is the density of the(
)
2 1Normal 0,σ variable. If 2 2
δ ε
σ <σ , the ratio
( ) ( )
t tδ ε
φ φ is not integrable, and the estimators (5) and (6) can not be calculated. To overcome this issue, we propose an alternative approach for estimating g x
( )
.Using a kernel function K x
( )
with a bandwidth h, we consider the following kernel estimator for fV( )
x( )
1
1
ˆ n i ,
V
i
x V
f x K
nh = h
−
=
∑
and an estimator for φV
( )
t is then given by( )
( ) ( )
1
1
ˆ n exp ,
V i K
i
t itV th
n
φ φ
=
=
∑
where φK
( )
t is the characteristic function of the kernel function K x( )
. Proceeding as above, we get an alternative estimator of fX( )
x by( )
1 1 , n i X i x Vf x K
nh h δ ε = − =
∑
where
( )
1( ) ( )
( )
e d .
2π itx
K
t h
K x t t
t h δ δ ε ε φ φ φ −
=
∫
(8)Therefore, when (6) is no longer valid, we propose the following estimator for g x
( )
( )
11 1 . 1 n i i i n i i x V
nh K Y
h g x x V nh K h δ ε δ ε = = − = −
∑
∑
(9)
Remark 1 To ensure that the proposed estimator (9) is well-behaved, we need to make the following assumption.
Condition A:
1. φε
( )
t ≠0 for all t; and2. suptφK
( ) ( ) ( )
t φδ t h φε t h < ∞ and∫
φK( ) ( ) ( )
t φδ t h φε t h dt< ∞. Example 2 We use the same model as in Example 1 with 2 2δ ε
σ <σ . In this case, to ensure (A2) to be valid, it is rather common to choose kernels that have a compactly supported characteristic function φK
( )
t . For example, we choose the sinc kernel( )
sin( )
πK x = x x , which has characteristic function φK
( )
t =1[−1,1]( )
t , the indicator function of the interval[
−1,1]
. From (8), we have( )
1( )
(
2 2)
22 0
1
cos exp d .
π 2
t
K x tx t
h ε δ δ ε σ σ − =
∫
Remark 21. The above two nonparametric estimators of fX
( )
x were given by [22];2. When the variance of ε in Models (4) is equal to 0, which is the Berkson error model, the estimator (6) becomes
( )
(
)
(
)
1 1 1 ˆ , 1 n i i i n i in f x V Y
g x
n f x V
δ δ = = − = −
∑
∑
(10)where fδ
( )
x is the density function of δ ; and;3. When the variance of δ in Models (4) is equal to 0, which is the classical error model, g x
( )
given in (9) reduces to the estimator of [2].3. Theoretical Properties
3.1. Asymptotic Results for g
In this section, we investigate the large-sample properties of the estimator g x
( )
at (9).For this purpose, we present the following regular conditions which are mild and can be found in [2].
Condition B:
1. e1,,en have zero means and uniformly bounded variances;
2. fW , fX and fε are bounded, and fX and g have bounded kth derivatives;
3. K x
( )
is a real and symmetric kernel and has finite moment of order k. Namely,( )
{ }, d 1 0
j
K j u K u u j
µ =
∫
= = for j=1,,k−1 and µK k, ≠0; and4. The conditional moment
(
2)
E Y +η W =u is bounded for all u and some η>0. Let
( )
1( )
h
K x =h K x h− . The mean squared error (MSE) of the estimator g x
( )
is described in the next Theorem.Theorem 1 ((MSCE)) Suppose that Conditions A and B hold. Then, for each x such that fX
( )
x >0,( ) ( )
{
}
( )
( )
( )
(
) ( ) ( )
{
}
( )
( )
{
( )
} (
)
(
)
2
2
2 2
2
1
d
1 1
d ,
X
X
h X
X
W X
f x
E g x g x
f x
K x v g v g x f v v
f x
K u f f x uh u o
n
nhf x
δ
ε τ ε
−
= − −
+ ∗ − +
∫
∫
(11)
where 2
( )
{
( )
}
2E Y g x W
τ ⋅ = − = ⋅
.
Explicit rates of convergence of the estimator g x
( )
can be found by examination of the asymptotic behaviour of the MSE. For the bias, using the Taylor expansion of the first term on the right-hand side of Equation (11), we have( )
(
)
( )
( )
2 2 2 2
Bias k k ,
k
g x =b x h +o h
where
( ) ( )
1( )
{
( ) ( )
}
( )( )
( )
( )( ) ( )
,1k k ! k !
k X K k X X
b x = − f− x µ g x f x k −g x f x k
.
The second term on the right-hand side of Equation (11) describes the variance of
( )
g x . The asymptotic behaviour of this term is more difficult to evaluate since it depends on the tail behaviour of the ratio φδ
( )
t φε( )
t , as [14] discussed, which can be classified into the following:1. An exponential ratio of order β is
( )
( )
( )
( )
0 1
0 exp 1 exp , as ,
d tβ tβ γ ≤φδ t φε t ≤d tβ tβ γ t → ∞ (12)
with d0, d1, γ, β >0 and β0, β ∈1 R.
2. A polynomial ratio of order β is
( )
( )
0 1 as ,
d t β φδ t φε t d t β t
− −
≤ ≤ → ∞ (13)
3.1.1. Asymptotic Mean Squared Error (AMSE)
In this section, we study the asymptotic behaviour of the MSE where φδ
( )
t φε( )
t behaves like an exponential or a polynomial.Theorem 2 Suppose that Conditions A and B hold and that the first half inequality of (12) is satisfied. Assume that φK
( )
t is supported on[
−1,1]
. Then, for each x such that fX( )
x >0, we have( )
(
)
2( )
2 1 221(
)
1
AMSE g x bk x h k n h exp 2 1h , β β
κ − − − γ
= +
with κ1 being some positive constant and
1
2 1 1
2
1
β
β β
>−
= .
When φε
( )
t is exponentially smoother than φδ( )
t , we obtain a slower logarith- mic rate which is similar to the deconvolution rate for supersmooth error given in [2]. More precisely, the optimal bandwidth is of order( ) ( )
1 12 ln
h=d γ β n − β with d≥1,
and the estimator g x
( )
then converges at the rate of(
logn)
kβ. Theorem 3 Suppose Conditions A and B hold, and that 2( )
2d K
t−β φ t t< ∞
∫
. Then,under the polynomial ratio (13), for each x such that fX
( )
x >0, we have( )
(
)
2( )
2( )
2
AMSE g x =bk x h k +κ λ h n,
with κ2 being some positive constant, and
( )
{ } { } 2 11 2 1 2 1
1 1
h hβ β β
λ −
< ≤ ≤
= + .
We obtain that, when φδ
( )
t φε( )
t behaves like a polynomial ratio of order β in the tail, the convergence rates range from n to deconvolution rate of ordinarysmooth error of [2]. More precisely, the optimal bandwidth is of order 1 2( )
const k
h ⋅n−
when 1 2≤ ≤β 1, and the estimator g x
( )
then converges at the rate of n . When1 2
β < , the optimal bandwidth is of order 1 2( 2 1)
const k
h ⋅n− −β+ and the estimator
( )
g x converges at the rate of nk(2k−2β+1).
3.1.2. Asymptotic Normality
The theorem below establishes asymptotic normality in the exponential ratio case. Theorem 4 Under the conditions of Theorem (2), and for bandwidth
( ) ( )
1 12 ln
h=d γ β n − β with d≥1,
( )
( )
(
( )
)
( )
(
)
( )
Bias
0,1 , var
d
g x g x g x
N g x
− −
→
where Bias
(
g x( )
)
=bk( )
x hk+o h( )
k and var(
g x( )
)
=o(
Bias(
g x( )
)
2)
. The next theorem establishes asymptotic normality in the polynomial ratio case. Theorem 5 Suppose that Conditions A and B hold and that the inequality of (13) is satisfied. Assume that t K( )
t dtβ φ −
< ∞
∫
and 2( )
2d K
t−β φ t t< ∞
∫
. Then, under( )
( )
2kh n O h
λ = and h→0 as n→ ∞, for each x such that fX
( )
x >0, we have( )
( )
(
( )
)
( )
(
)
( )
Bias
0,1 , var
d
g x g x g x
N g x
− −
→
the second term on the right-hand side of Equation (11). The proofs of all theorems are postponed to the Appendix.
3.2. Unknown Measurement Error Distribution
When the error densities are unknown, they can be readily estimated from additional observations (e.g., a sample from the error densities, replicated data or external data) and these estimates can be substituted into (6) and (9) to produce the estimate of g x
( )
. For sufficiently large sample size, the rates of convergence of the estimates remain unchanged when φδ and φε are replaced by their consistent estimators (e.g., [4][17][24]).
4. Simulation Studies
We study numerical properties of the estimators proposed in Section 2. Note that we have defined two estimators, at (6) and (9). The first exists when φδ
( ) ( )
t φε t is inte- grable, and the estimator (9) otherwise. We use the notations gˆ and g for the esti-mators (6) and (9) respectively. We use the notation gˆI for the estimator that ignores
the errors, that is, the estimator is the classical Nadaraya-Watson estimator of g
based on direct data from
(
Y Vi, i)
, i=1,,n. Note that gˆI is exactly equal to gwhen φδ
( )
t =φε( )
t . In addition, we use gˆC for the estimator of [23].We apply the various estimators introduced above to some simulated examples (see,
[23]):
1.
( )
( )
(
2)
5 sin 2 exp 16 50
g x = x − x (sinusoidal),
2.
( )
(
2)
150 10 25
g x = x + x+ − (sharp unimodal), and
3. g x
( )
=φ0,1.5( )
4x +φ1,2( )
4x +φ2,5( )
4x (asymmetric); where φµ σ, is the density of an(
)
2
Normal µ σ, variable. For each of the above
regression functions, we generate 200 data sets of n randomly sampled vectors
(
V1, ,Y1)
,(
Vn, Yn)
, as follows. We generate a random sample δ1,,δn from fδ, arandom sample ε1,,εn from fε and a random sample W1,,Wn from fW , and
put Xi=Wi+δi and Vi =Wi+εi , i=1,,n, where fW is the density of an
(
2)
Normal 0,σW variable, and we take fδ and fε to be either normal or Laplace with zero mean. Then we generate a random sample Y1,,Yn as Yi=g X
( )
i +ei, where the errors ei are normally distributed with zero mean and variance2
e
σ , where
( )
2 2
0.1
e g
σ = ×σ with 2
( )
gσ denoting the mean-squared deviation of g from its average value. We simply denoted δ Normal and εLaplace by
(
δ ε,) (
N,L)
, and other similar.In our simulations we consider sample sizes n=50,100, 250, and in each case we generate 200 samples from the distribution of the random vector
(
V Y,)
. Except if stated otherwise, we adopt the second order kernel K corresponding to( )
(
)
3 [ ]( )
2 1,1
1 1
K t t t
φ = − ⋅ − , which is necessary to calculate g and gˆC. For the band-
width h, it is necessary to calculate g, gˆI and gˆC, we select the value h that mini-
mises the cross-validation (CV) criterion,
{
est( )
}
2 1n
j j j j
CV =
∑
= Y −g− V , where the sub-We report the Integrated Squared Error,
{
est( )
( )
}
2ISE=
∫
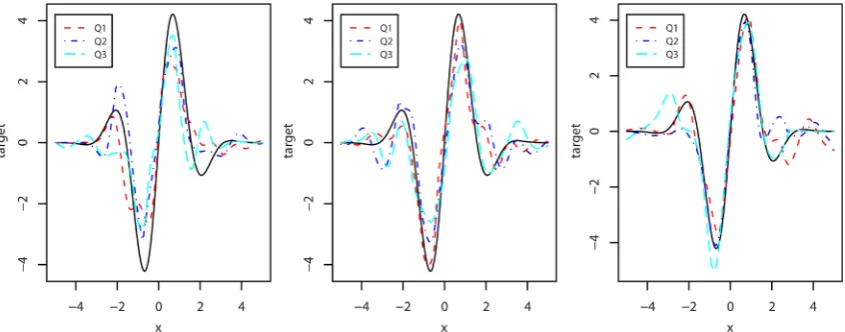
g x −g x dx, where gest( )
x [image:9.595.131.554.353.519.2]is the estimator considered. In all graphs, to illustrate the performance of an estimator, we show the estimated curves corresponding to the first (Q1), second (Q2) and third (Q3) quartiles of the ordered ISEs. The target curve is always represented by a solid curve. In the tables we provide the average values, denoted by MISE, of the 200 cal- culated ISEs.
Figure 1 and Table 1 illustrate the way in which the estimator improves as sample size increases. We compare, for various sample sizes, the results obtained for estimating curve (a) when WNormal 0,2
( )
, and( ) (
δ ε, N, L)
with the pair of variance ratios(
2 2 2 2)
,
W W
δ ε
σ σ σ σ equals (0.1, 0.4), and for estimating curve (b) when W
( )
Normal 0,2 and
(
δ ε,)
~ (N, L), (N, N), (L, L) or (L, N) with(
2 2, 2 2)
W W
δ ε
σ σ σ σ =
(
0.1, 0.4)
. We see clearly that, as the sample size increases, the quality of the estimators improves significantly in all cases.For any nonparametric method for regression problem, the quality of the estimator also depends on the discrepancy of the observed sample. That is, for any given family of densities fW, fδ and fε, and any given the noise-to-signal ratios
(
)
2 2 2 2
,
W W
δ ε
σ σ σ σ ,
the performance of the estimator depends on the variances of W , δ and ε. Here,
we compare the results obtained from estimating curve (c) for different values of
Figure 1. Estimation of curve (a) for samples of size n = 50 (left panel), n = 100 (middle panel) or n = 250 (right
panel), when WNormal 0,2
( )
, and( ) (
δ ε, N, L)
with(
2 2 2 2)
(
)
, 0.1,0.4 .
W W
δ ε
[image:9.595.125.553.625.704.2]σ σ σ σ = The solid curve is the target curve.
Table 1. MISE
(
4)
10−
× for estimation of curve (b) when WNormal 0,2
( )
, and( )
δ ε, ~ (N, L), (N, N), (L, L)or (L, N) with
(
2 2 2 2)
(
)
, 0.1,0.4
W W
δ ε
σ σ σ σ = .
n ( )δ ε,
Method
(N, L)
MISE ( )
,
δ ε
Method
(N, N)
MISE (L, L) MISE (L, N) MISE 50 gˆ at (6) 5.3524 g at (9) 8.3704 21.7584 9.9570
100 3.2803 6.8685 11.1636 6.7162
(
2 2 2)
, ,
W δ ε
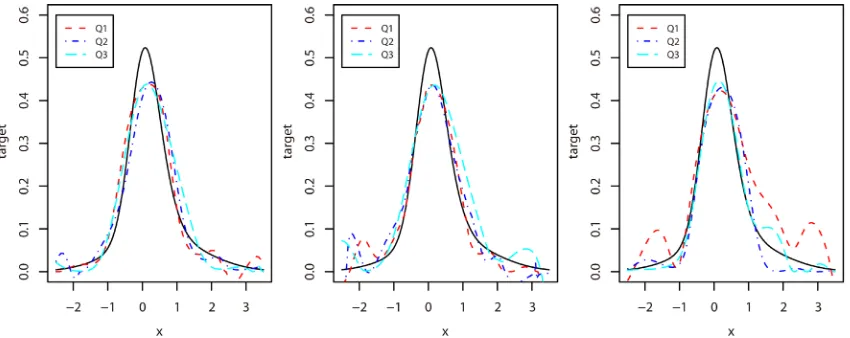
σ σ σ . As expected, Figure 2 shows that the best performance usually occur for smaller error variance (e.g.,
(
2 2 2)
(
)
, , 0.5, 0.05, 0.15
W δ ε
σ σ σ = ). It is noteworthy that the
effect of the variances on the estimator performance is obvious in model (4).
Finally, we compare gˆ (or g), gˆI and gˆC. Figure 3 shows the boxplots of the quantities of log ISE
(
O ISEI)
and log ISE(
O ISEC)
for estimating curve (a) when250
n= and WNormal 0, 2
( )
, where ISEO is the ISE of our proposed estimator, ISEI is the ISE of the estimator that ignores the errors, and ISEC is the ISE of theestimator of [23]. Here, each boxplot is constructed from 200 samples. Here, in panel (a)-(L-L) (or (a)-(N-N)), the mixed errors are both Laplace (or both normal). Here, and also in panel (a)-(N-L) (or (a)-(L-N)), the errors are
(
2)
Normal 0, δ
δ σ and ε
Laplace (or δ Laplace and Normal 0,
(
2)
εε σ ). In each panel, for X-axis = 1 to 7,
(
2 2 , 2 2)
W W
δ ε
σ σ σ σ = (0.1, 0.4), (0.1, 0.3), (0.2, 0.3), (0.2, 0.2), (0.3, 0.2), (0.3, 0.1) or (0.4, 0.1). The more a boxplot is located below the zero horizontal line, the better our method compared with the other two estimators. In the same situation, Table 2 and
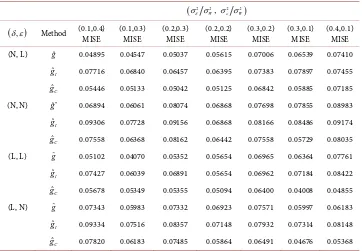
Table 3 report the average integrated square error (MISE) for estimating curves (b) and (c) respectively. As expected, our proposed estimator substantially outperformed the estimator that completely ignores any measurement errors. Our results show that our proposed estimator usually works better than the estimator proposed by [23] for estimating curves (a) and (b). It is noteworthy that the estimator proposed by [23] may perform better than our proposed estimator when curve (c) with 2 2
δ ε
σ >σ is esti- mated.
5. Discussion
[image:10.595.127.552.481.650.2]In this paper, we propose a new method for estimating non-parametric regression models with the predictors being measured with a mixture of Berkson and classical errors. The method is based on the relative smoothness of φδ and φε . When φδ is
Figure 2. Estimation of function (c) for samples of size n=250, when
(
2)
Normal 0, W
W σ , δLaplace and
(
2)
Normal 0, ε
ε σ with
(
2 2 2)
, ,
W δ ε
Figure 3. Boxplots of the quantities of log(ISEO/ISEI) (row 1) and log(ISEO/ISEC) (row 2) for
estimating regression curve (a) when WNormal 0, 2
( )
and n=250, for various errordensities fδ and fε and various values of
(
2 2 2 2)
,
W W
δ ε
σ σ σ σ .
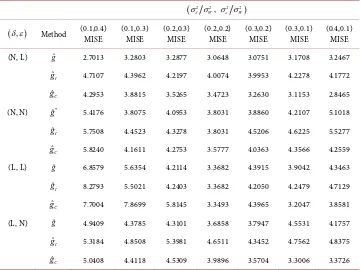
Table 2. MISE
(
4)
10−
× for estimation of curve (b) when WNormal 0, 2
( )
and n = 250, forvarious error densities fδ and fε and various values of
(
2 2 2 2)
,
W W
δ ε
σ σ σ σ .
(
2 2 2 2)
,
W W
δ ε
σ σ σ σ
(δ ε, ) Method (0.1,0.4)
MISE (0.1,0.3) MISE (0.2,0.3) MISE (0.2,0.2) MISE (0.3,0.2) MISE (0.3,0.1) MISE (0.4,0.1) MISE (N, L) gˆ 2.7013 3.2803 3.2877 3.0648 3.0751 3.1708 3.2467
ˆI
g 4.7107 4.3962 4.2197 4.0074 3.9953 4.2278 4.1772
ˆC
g 4.2953 3.8815 3.5265 3.4723 3.2630 3.1153 2.8465
(N, N) gˆ* 5.4176 3.8075 4.0953 3.8031 3.8860 4.2107 5.1018
ˆI
g 5.7508 4.4523 4.3278 3.8031 4.5206 4.6225 5.5277
ˆC
g 5.8240 4.1611 4.2753 3.5777 4.0363 4.3566 4.2559
(L, L) gˆ 6.8579 5.6354 4.2114 3.3682 4.3915 3.9042 4.3463
ˆI
g 8.2793 5.5021 4.2403 3.3682 4.2050 4.2479 4.7129
ˆC
g 7.7004 7.8699 5.8145 3.3493 4.3965 3.2047 3.8581
(L, N) gˆ 4.9409 4.3785 4.3101 3.6858 3.7947 4.5531 4.1757
ˆI
g 5.3184 4.8508 5.3981 4.6511 4.3452 4.7562 4.8375
ˆC
[image:11.595.193.554.432.702.2]Table 3. MISE for estimation of curve (c) when WNormal 0, 2
( )
and n = 250, for variouserror densities fδ and fε and various values of
(
2 2 2 2)
,
W W
δ ε
σ σ σ σ .
(
2 2 2 2)
,
W W
δ ε
σ σ σ σ
(δ ε, ) Method (0.1,0.4)
MISE (0.1,0.3) MISE (0.2,0.3) MISE (0.2,0.2) MISE (0.3,0.2) MISE (0.3,0.1) MISE (0.4,0.1) MISE (N, L) gˆ 0.04895 0.04547 0.05037 0.05615 0.07006 0.06539 0.07410
ˆI
g 0.07716 0.06840 0.06457 0.06395 0.07383 0.07897 0.07455
ˆC
g 0.05446 0.05133 0.05042 0.05125 0.06842 0.05885 0.07185
(N, N) ˆ*
g 0.06894 0.06061 0.08074 0.06868 0.07698 0.07855 0.08983
ˆI
g 0.09306 0.07728 0.09156 0.06868 0.08166 0.08486 0.09174
ˆC
g 0.07558 0.06368 0.08162 0.06442 0.07558 0.05729 0.08035
(L, L) g 0.05102 0.04070 0.05352 0.05654 0.06965 0.06364 0.07761
ˆI
g 0.07427 0.06039 0.06891 0.05654 0.06962 0.07184 0.08422
ˆC
g 0.05678 0.05349 0.05355 0.05094 0.06400 0.04008 0.04855
(L, N) g 0.07343 0.05983 0.07332 0.06923 0.07571 0.05997 0.06183
ˆI
g 0.09334 0.07516 0.08357 0.07148 0.07932 0.07314 0.08148
ˆC
g 0.07820 0.06183 0.07485 0.05864 0.06491 0.04676 0.05368
smooth enough (relative to φε ), we propose a nonparametric estimator (6) that converges to the target curve at the parametric n rate. For less smooth function φδ,
we propose a kernel estimator (9) that converges at rates ranging from n to rates
that are close to the deconvolution rates. Numerical results show that the new esti- mators are promising in terms of correcting the bias arising from the errors-in- variables. It generally preforms better than the approach proposed by [23]. The metho- dology can be readily extended to the prediction problem of nonparametric errors-in- variables regression (see, e.g., [16]). Extension of our method to the problems con- sidered in [5] is of future research interest.
Acknowledgements
This work was supported by Natural Science Foundation of Jiangxi Province of China under grant number 20142BAB211018.
References
[1] Armstrong, B.G. (1998) Effect of Measurement Error on Epidemiological Studies of Envi-ronmental and Occupational Exposures. Occupational and Environmental Medicine, 55, 651-656. https://doi.org/10.1136/oem.55.10.651
[2] Fan, J. and Truong, Y.K. (1993) Nonparametric Regression with Errors in Variables. Annals of Statistics, 21, 1900-1925. https://doi.org/10.1214/aos/1176349402
[4] Delaigle A., Hall, P. and Meister A. (2008) On Deconvolution with Repeated Measure-ments.Annals of Statistics, 36, 665-685. https://doi.org/10.1214/009053607000000884 [5] Delaigle, A., Fan, J. and Carroll, R.J. (2009) A Design-Adaptive Local Polynomial Estimator
for the Errors-in-Variables Problem. Journal of the American Statistical Association 104, 348-359. https://doi.org/10.1198/jasa.2009.0114
[6] Cook, J.R. and Stefanski, L.A. (1994) Simulation-Extrapolation Estimation in Parametric Measurement Error Models. Journal of the American Statistical Association, 89, 1314-1328. https://doi.org/10.1080/01621459.1994.10476871
[7] Stefanski, L.A. and Cook, J.R. (1995) Simulation-Extrapolation: The Measurement Error Jackknife. Journal of the American Statistical Association,90, 1247-1256.
https://doi.org/10.1080/01621459.1995.10476629
[8] Carroll, R.J., Maca, J.D. and Ruppert, D. (1999) Nonparametric Regression in the Presence of Measurement Error. Biometrika, 86, 541-554. https://doi.org/10.1093/biomet/86.3.541 [9] Staudenmayer, J. and Ruppert, D. (2004) Local Polynomial Regression and Simulation-
Extrapolation. Journal of the Royal Statistical Society: Series B,66, 17-30. https://doi.org/10.1046/j.1369-7412.2003.05282.x
[10] Berry, S.M., Carroll, R.J. and Ruppert, D. (2002) Bayesian Smoothing and Regression Splines for Measurement Error Problems. Journal of the American Statistical Association, 97, 160-169. https://doi.org/10.1198/016214502753479301
[11] Berkson, J. (1950) Are There Two Regression Problems? Journal of the American Statistical Association, 45, 164-180. https://doi.org/10.1080/01621459.1950.10483349
[12] Fuller, W. (1987) Measurement Error Models. Wiley, New York. https://doi.org/10.1002/9780470316665
[13] Huwang, L. and Huang, H.Y.S. (2000) On Errors-in-Variables in Polynomial Regression— Berkson Case. Statistica Sinica,10, 923-936.
[14] Wang, L. (2003) Estimation of Nonlinear Berkson-Type Measurement Error Models. Statis-tica Sinica,13, 1201-1210.
[15] Wang, L. (2004) Estimation of Nonlinear Models with Berkson Measurement Errors. An-nals of Statistics, 32, 2559-2579. https://doi.org/10.1214/009053604000000670
[16] Carroll, R.J., Delaigle, A. and Hall, P. (2009) Nonparametric Prediction in Measurement Error Models. ournal of the American Statistical Association, 104, 993-1003.
https://doi.org/10.1198/jasa.2009.tm07543
[17] Delaigle, A., Hall, P. and Qiu, P. (2006) Nonparametric Methods for Solving the Berkson Errors-in-Variables Problem. Journal of the Royal Statistical Society: Series B, 68, 201-220. https://doi.org/10.1111/j.1467-9868.2006.00540.x
[18] Schafer, D.W. and Gilbert, E.S. (2006) Some Statistical Implications of Dose Uncertainty in Radiation Dose-Response Analyses. Radiation Research, 166, 303-312.
https://doi.org/10.1667/RR3358.1
[19] Reeves, G.K., Cox, D.R., Darby, S.C. and Whitley, E. (1998) Some Aspects of Measurement Error in Explanatory Variables for Continuous and Binary Regression Models. Statistics in Medicine,17, 2157-2177.
https://doi.org/10.1002/(SICI)1097-0258(19981015)17:19<2157::AID-SIM916>3.0.CO;2-F [20] Schafer, M., Mullhaupt, B. and Clavien, P.A. (2002) Evidence-Based Pancreatic Head
Re-section for Pancreatic Cancer and Chronic Pancreatitis. Annals of Surgery,236, 137-148. https://doi.org/10.1097/00000658-200208000-00001
with Mixtures of Berkson and Classical Error, with Application to Fallout from the Nevada Test Site. Biometrics, 58, 13-20. https://doi.org/10.1111/j.0006-341X.2002.00013.x
[22] Delaigle, A. (2007) Nonparametric Density Estimation from Data with a Mixture of Berk-son and Classical Errors.Canadian Journal of Statistics, 35, 89-104.
https://doi.org/10.1002/cjs.5550350109
[23] Carroll, R.J., Delaigle, A. and Hall, P. (2007) Nonparametric Regression Estimation from Data Contaminated by a Mixture of Berkson and Classical Errors. Journal of the Royal Sta-tistical Society: Series B, 69, 859-878. https://doi.org/10.1111/j.1467-9868.2007.00614.x [24] Hu, Y. and Schennach, S.M. (2008) Identification and Estimation of Nonclassical Nonlinear
Errors-in-Variables Models with Continuous Distributions. Econometrica, 76, 195-216. https://doi.org/10.1111/j.0012-9682.2008.00823.x
Appendix
Proof of Theorem 1
Let
( )
{
( )
( )
}
( )
1 , 1n
n X j n j
A x = g x −g x f x =n−
∑
=U , where( )
{
}
1 ,
j
n j j
x V
U h K Y g x
h
δ ε
− −
= −
, we have
( )
{
( )
}
( )
( )
{
}
( )
1 , 1 d , jn j j
X
x V
E U h E E Y g x W E K W
h
x v
h K g v g x f v v
h δ ε − − − = − − = −
∫
(14) and( )
{
( )
}
( )
( )
{
} (
)
(
)
2 2 2 2 , 2 1 2 d d jn j j W
W
x V
E U h E Y g x W u E K W u f u u
h
h K u f f x hu u
δ ε
δ
ε τ ε
− − − = − = = = ⋅ ∗ −
∫
∫
(15)where 2
( )
{
( )
}
2E Y g x W
τ ⋅ = − = ⋅. The result follows immediately from 14 and 15.
Proofs of the Results of Section 3.1.1.
Lemma 1 Suppose that φK
( )
t is supported on[
−1,1]
, and φ ≠ε 0 for all t. Then, for1
2 1 1
2
1
β
β β
>−
= , we have
( )
2exp(
)
and{
( )
}
2d 2 2exp(
2)
,Kεδ x ∞ ≤Ch−β h−β γ
∫
Kεδ x x≤Ch−β h−β γwhere, here, and below, C denotes a generic positive and finite constant.
Proof. It follows from (A2) of Condition A that dε ≡mint M≤ φε
( )
t >0 for some large enough constant M >0. Since φδ( )
t ≤1, we have( ) ( )
( ) ( ) ( )
( )
( )
( )
(
)
( )
(
)
1 1 1 1 1 1 1 1 1 2π dd 2π exp d
d exp d
K
K K
t Mh Mh t
K
t Mh Mh t
K x t t h t h t
d t t t d t h t h t
C t t Ch h t t
δ
ε δ ε
β β
ε
β
β β
φ φ φ
φ φ γ
φ γ +∞ − −∞ − −
≤ < ≤
− −
≤ < ≤
≤ ≤ + ≤ +
∫
∫
∫
∫
∫
The conclusion follows from
( )
[ ]
( )
(
)
1 1 1 1 1 1 1 1 1 1 1 1 1 1 1 1,d ln ln 1,
1. Mh
Mh Mh t
Mh
C t O
t t C t O h
C t O h
β β β β β β β + < ≤ + +
= > −
= = = −
= < −
∫
The proof for the other result is similar and requires Parseval's Theorem. From (14) and Lemma 1, we have
( )
2(
2 21(
)
)
, exp 2 1 .
n j
The proof of Theorem 2 follows from the expressions of E U
( )
n j, and( )
2, n j E U . The proof of Theorem 3 is the same as the proof of Theorem 2, but in this case we need the following lemma.
Lemma 2 Suppose that φ ≠ε 0 for all t, t K
( )
t dtβ φ −
< ∞
∫
and( )
2 2d K
t−β φ t t< ∞
∫
. Then, we have( )
{
( )
}
2( )
and d
Kεδ x ∞ ≤Chβ
∫
Kεδ x x≤Chλ hwith
( )
h h2 11{ 1 2} 1{1 2 1} ββ β
λ −
< ≤ ≤
= + .
The proof of Lemma 2 is similar to the proof of Lemma 1 and is omitted.
Proofs of the Results of Section 3.1.2.
A standard decomposition gives
( ) ( )
1( ) ( )
X n
g x −g x = f− x A x , fX
( )
x goes in pro-bability to fX
( )
x and thus we only need to prove the asymptotic normality for( )
n
A x . As given in [25], a sufficient condition for the following asymptotical normality
( )
( )
( )
, ,
1
,
0,1
n
n j n j
j
n j
U nE U
N nvar U
=
−
→
∑
is that the Lyapounov's condition holds, i.e., for some η >0,
( )
{
}
2
,
1 2
2 2
,
0. n j
n j
E U
n E U
η
η η
+
+ =
Letting
( )
{
( )
2}
J u =E Y+g x +η W =u , we have
( )
{
(
)
}
( ) ( )
( )
{
( )
}
2
2 1
,
2 1
d d
max d .
n j W
E U J u h K x u v h f u f v u v
Ch K u K u u
η
η δ
ε ε
η
η δ δ
ε ε
+
+ −
− −
∞
= − −
≤
∫∫
∫
Under the conditions given in the theorem 4, we can prove that
( )
{
(
)
}
(
2)
2 2 1
, exp 2 .
n j
E U +η =O h−β + − −η η +η h−β γ
Under the conditions given in the theorem 5, we can prove that
( )
( )(
)
2 1
, .
n j
E U +η =O λ h hβ− η
Submit or recommend next manuscript to SCIRP and we will provide best service for you:
Accepting pre-submission inquiries through Email, Facebook, LinkedIn, Twitter, etc. A wide selection of journals (inclusive of 9 subjects, more than 200 journals)
Providing 24-hour high-quality service User-friendly online submission system Fair and swift peer-review system
Efficient typesetting and proofreading procedure
Display of the result of downloads and visits, as well as the number of cited articles Maximum dissemination of your research work
Submit your manuscript at: http://papersubmission.scirp.org/