Spatial and Temporal Variation of Normalized Difference
Vegetation Index (NDVI) and Rainfall in the North East
Arid Zone of Nigeria
Christiana F. Olusegun1*, Zachariah D. Adeyewa2
1
Department of Physical and Chemical Sciences, Elizade University, Ilara-Mokin, Nigeria
2
Department of Meteorology, Federal University of Technology, Akure, Nigeria Email: *[email protected], *[email protected]
Received June 3, 2013; revised July 2, 2013; accepted July 10,2013
Copyright © 2013 Christiana F. Olusegun, Z. D. Adeyewa. This is an open access article distributed under the Creative Commons Attribution License, which permits unrestricted use, distribution, and reproduction in any medium, provided the original work is properly cited.
ABSTRACT
This study examines the spatial and temporal variation of onset and cessation of rainfall and greenness in the North East Arid Zone of Nigeria. Onset and cessation of greenness dates were determined from mean monthly time series of Nor- malized Difference Vegetation Index (NDVI) using Advance Very High Resolution Radiometer (AVHRR) data for five meteorological stations in the zone for a period of nineteen years (1981-1999). Lowest growing days of six weeks were observed in Nguru (12.53˚N, 10.28˚E, alt. 343 m), Potiskum (11.42˚N, 11.02˚E, alt. 415 m) and Maiduguri (11.51˚N, 13.05˚E, alt. 354 m), while Yola (12.28˚N, 9.14˚E, alt. 174 m) and Bauchi (10.17˚N, 9.49˚E, alt. 609 m) have growing days of 15 and 16 weeks respectively. Highest rate of greenness of 0.18/month was observed in Maiduguri while the lowest rate of green-up of 0.07/month was observed in Bauchi. Similarly, highest rate of senescence (0.08/month) was observed in Bauchi while lowest rate of senescence (0.04/month) was observed in Nguru.
Keywords: NDVI; Onset of Greenness; Cessation of Greenness; Rainfall
1. Introduction
The close relationship between rainfall and the growth of vegetation has made it possible to use Normalized Dif- ference Vegetation Index (NDVI) data as a proxy for pre-cipitation variation over land. The Normalized Difference Vegetation Index (NDVI) can be calculated from satellite imagery and is generally recognised as a reliable index of ground vegetation cover [1]. Satellite data processed into Normalized Difference Vegetation Index (NDVI) can be used to indicate onset and cessation of greenness, rate of green-up and senescence, growing days and growing sea- son. Most previous regional-scale studies were based on time series of remotely sensed indicators of vegetation greenness, mainly the Normalized Difference Vegetation Index (NDVI), and rainfall measurements from ground stations. NDVI has been extensively and qualitatively used to infer changes in vegetation response to rainfall in seasonally arid regions [2]. Le Houérou [3] concluded that the monthly NDVI could be best explained by a linear cor- relation with rainfall. The correlation was achieved when
the rainfall of the preceding two months was also includ- ed. Quantitative variations of satellite derived vegetation index over Africa were also provided by Adeyewa [4]. His analysis of anomalies in the NDVI showed that sig- nificant reductions in the vegetative activities are in the western, eastern and southern part of Africa, while the western and central part witnessed increased activities for different time period between the years 1981-1999. NDVI is a good indicator of the ability for vegetation to absorb photosynthetically active radiation and has been widely used by researchers to estimate green biomass [5], leaf area index [6] and patterns of productivity [7] because the internal mesophyll structure of healthy green leaves strongly reflects NIR radiation, and leaf chlorophyll and other pigments absorb a large proportion of the red VIS radiation [8,9].
This study is focused on the North East Arid Zone of Nigeria which lies between 12˚N and the Niger border and 10˚E meridian and the Cameroon border. The cli- mate of the North East Arid Zone of Nigeria is semi-arid in nature because the ratio of average rainfall to average potential evapotranspiration is between 0.20 and 0.45 *
[10]. The vegetation in North East Arid zone of Nigeria is mainly Sudan or Sahel Savannah and it has also been confirmed that crop yields in this zone is dependent on rainfall amounts and distribution [11-13]. The annual rainfall in semi-arid regions has been observed to be de- clining for more than five decades now, resulting in sig- nificant decrease in the length of the growing season in this region. Inconsistent rainfall amount and distribution always resulted in very low crop yield on an annual basis [14]. However, accurate determination of onset of green- ness is important for high crop yield. It is therefore im- perative for us to determine the time lag between onset of greenness and onset of rainfall. Another peculiar feature of this zone is the short rainy season between June/July and September/October immediately followed by a long dry season. Therefore, this research work is aimed at de- termining onset and cessation of rainfall and greenness, time lag between onset and cessation of rainfall and greenness, growing days and growing seasons besides rate of green-up and rate of senescence in the North East Zone of Nigeria.
2. Materials and Methods
The Normalized difference Vegetation Index (NDVI) is calculated as the difference between near infrared (NIR) and visible reflectance value normalized over the sum of both [15].
NDVI is therefore estimated as: NIR VIS NIR VIS
where VIS is the land surface reflectance in the visible wavelength (0.58 - 0.68 micrometer) and NIR is the land surface reflectance in the near infrared wavelength (0.725 - 1.1 micrometer).
Hulme [16], classified the numerous approaches to- wards the determination of growing season determination into two categories. The first category is the determina- tion of growing season using standardized meteorologi- cal variables such as the magnitude of annual rainfall [16-19] and evapotranspiration is one of the categories. The second category is when the growing season is de- termined from absolute daily or monthly total rainfall [20-26]. Growing seasons in the North East Arid zone of Nigeria were determined in this research using NDVI.
Monthly rainfall data archived at The Nigerian Mete- orological Agency, Oshodi, Lagos, which covers the time period of January 1981 through to December 1999, was used for analysis in this research. The NDVI data were extracted from the Pathfinder AVHRR Land (PAL) Global 8 km, 10-day composite, Normalized Difference Vegetation Index (NDVI) product archived at the God- dard Earth Sciences, Distributed Active Centre (GES- DAAC). The data covers the time period from January 1981 through December 1999. The PAL 10-day data were originally created from the Pal 8-km daily product
using a temporal re-sampling method based on maximum NDVI values. The Pal 8 km daily data were spatially re- sampled based on maximum NDVI values, from the Ad- vanced Very High Resolution Radiometer (AVHRR), Global Area Coverage (GAC) data, which has a nominal resolution of 4km. The data were analyzed for five sta- tions The rainfall synoptic stations used to represent the North East Arid Zone are Nguru (12.53˚N, 10.28˚E, alt. 343 m), Potiskum (11.42˚N, 11.02˚E, alt. 415 m) and Maiduguri (11.51˚N, 13.05˚E, alt. 354 m), Yola (12.28˚N, 9.14˚) and Bauchi (10.17˚N, 9.49˚E) for the years 1981- 1999.
Data Analysis
Onset of greenness was empirically determined using Equation (1)
Onset of greenness
1 4 NDVI max NDVI min NDVI max
(1)
Cessation of greenness was also empirically obtained by determining the time the maximum NDVI had de- creased by 30%.
In determining onset and cessation of rainfall Ilesanmi [17], method was adopted. Onset occurs when cumula- tive rainfall reaches 8% of the total rainfall while cessa- tion occurs when cumulative rainfall reaches 90% of the total rainfall. Growing season was determined by con- sidering the length of time between onset date of green- ness and cessation date of greenness. The rate of green- up and rate of senescence was determined using Equa- tions (2) and (3)
max
NDVI Onsetofgreenness
Rate of greenup
Growingdays
(2)
max
NDVI Cessationofgreenness
Rate of senescence
Brown days
(3) The NDVI data used in this work were made ready by further analyzing the Pathfinder AVHRR Land (PAL) data through a previous study byAdeyewa [4]. Program codes were written for all the thirty stations with the center latitude and longitude, start latitude, stop latitude, start longitude and stop longitude for each station. The steps of making the data ready have been described by Adeyewa [4]. These are some excerpts of the analytical steps taken:
Read data in binary form (unzipped data) from the compressed data.
Convert raw data to scaled format in order to obtain the NDVI data.
Combine the three 10-day composites available or each month into a singular monthly dataset using the maximum observed NDVI for each pixel in the particular station.
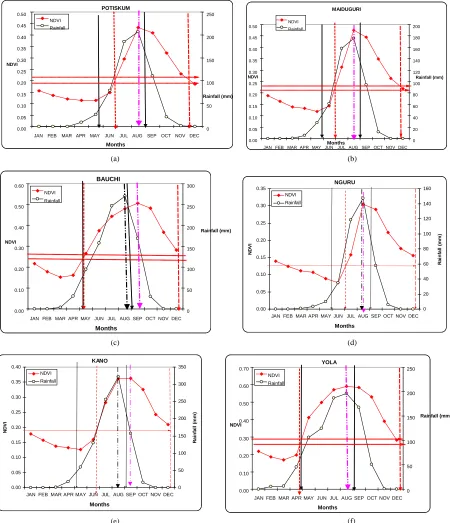
records. Potiskum. Onset of rainfall occurs in the fourth week of the month of May while onset of greenness was observed in the fourth week of June. Onset of greenness occurs in June as a result of the northward movement of the Inter tropical Convergence Zone (ITCZ) which then brings about the availability of sufficient rainfall necessary for Estimate monthly and annual averages of NDVI for
five stations in Nigeria.
3. Results and Discussion
Figure 1(a) shows the rainfall and NDVI variation at
POTISKUM 0.00 0.05 0.10 0.15 0.20 0.25 0.30 0.35 0.40 0.45 0.50
JAN FEB MAR APR MAY JUN JUL AUG SEP OCT NOV DEC
Months NDVI 0 50 100 150 200 250 Rainfall (mm) NDVI Rainfall MAIDUGURI 0.00 0.05 0.10 0.15 0.20 0.25 0.30 0.35 0.40 0.45 0.50
JAN FEB MAR APR MAY JUN JUL AUGSEPOCTNOVDEC Months NDVI 0 20 40 60 80 100 120 140 160 180 200 Rainfall (mm) NDVI Rainfall
(a) (b)
BAUCHI 0.00 0.10 0.20 0.30 0.40 0.50 0.60
JANFEBMARAPRMAY JUN JULAUGSEPOCTNOVDEC
Months NDVI 0 50 100 150 200 250 300 Rainfall (mm) NDVI Rainfall NGURU 0.00 0.05 0.10 0.15 0.20 0.25 0.30 0.35
JAN FEB MAR APR MAY JUN JUL AUG SEP OCT NOV DEC
Months NDV I 0 20 40 60 80 100 120 140 160 R a in fa ll ( m m ) NDVI Rainfall
(c) (d)
KANO 0.00 0.05 0.10 0.15 0.20 0.25 0.30 0.35 0.40
JAN FEB MAR APR MAY JUN JUL AUG SEP OCT NOV DEC
Months NDV I 0 50 100 150 200 250 300 350 R a in fa ll ( mm) NDVI Rainfall YOLA 0.00 0.10 0.20 0.30 0.40 0.50 0.60 0.70
JAN FEB MAR APR MAY JUN JUL AUGSEPOCTNOVDEC
Months NDVI 0 50 100 150 200 250 Rainfall (mm) NDVI Rainfall
(e) (f)
[image:3.595.74.524.174.697.2]the emergence of greenness. However, the time lag be- tween onset of rainfall and greenness was observed to be four weeks. Cessation of rainfall occurs in the first week of September while cessation of greenness was observed in the first week of December. The time lag between cessation of rain and cessation of greenness is twelve weeks. Maximum rainfall and NDVI occur simultane- ously in August. Growing days is one month two weeks. Growing season spans from June to December. The rate of green-up was calculated to be 0.16 while the rate of senescence was 0.07.
Determined onset of rainfall and onset of greenness occur in the fourth week of May and first week of July respectively as shown in Figure 1(b) for Maiduguri sta- tion, the time lag between onset of rainfall and onset of greenness is five weeks. Cessation of rainfall and green- ness occurs in the first week of September and December respectively. Time lag between cessation of rainfall and greenness is twelve weeks. The peak of rainfall and NDVI was observed in August. Growing days is one month two weeks while growing season spans from June to December. The rate of green-up is 0.18 while rate of senescence is 0.07.
Also onset of rainfall and greenness for Bauchi was obtained from the variation pattern of rainfall and NDVI shown in Figure 1(c). Onset of rainfall and greenness occur in the first week of May. No time lag was observed between onset of rainfall and greenness in this station. Cessation of rainfall occurs in the first week of Septem-ber while cessation of greenness was observed in the fourth week of December. Time lag between cessation of rainfall and cessation of greenness is fifteen (15) weeks. Maximum rainfall and NDVI occur in August and Sep-tember respectively and the time lag being one month. Growing days is four months. The growing season spans from May to December and the rate of green-up is 0.07 while the rate of senescence is 0.08.
At Nguru, onsets of rainfall occur in the fourth week of May while onset of greenness was observed in the first week of July as shown in Figure 1(d). The time lag be- tween onset of rainfall and onset of greenness is one month one week. Cessation of rainfall occurs in the first week of September while cessation of greenness was observed in the fourth week of December and the lag is fifteen (15) weeks. NDVI and rainfall peaks in August. Growing days is one and a half month. Growing season spans from July to December. The rate of green-up is 0.11 while the rate of senescence is 0.04.
At Kano Station, onset of rainfall and greenness was observed in the first week of May and fourth week of June respectively for Kano station as depicted in Figure 1(e). The time lag between onset of rainfall and onset of greenness is seven weeks. Cessation of greenness was observed in the fourth week of December wile cessation
rainfall was observed first week of September. Time lag between cessation of rainfall and cessation of greenness is fifteen (15) weeks. Inter-Annual variation of rainfall and NDVI attains its maximum level in August and Septem- ber respectively and the lag is one month. Growing days is two months three weeks. Growing season spans from June to December. The rate of green-up and senescence is 0.06.
Determined onset of rainfall and greenness in Yola was observed in the fourth week of April while cessation of rainfall and greenness occur in the first week of Sep- tember and fourth week of December respectively as shown Figure 1(f). Time lag between cessation of rain- fall and cessation of greenness is fifteen (15) weeks. Rainfall and NDVI peaks in August. Growing days is three months three weeks. Growing season spans from April to December. Rate of green-up is 0.08 while the rate of senescence is 0.07.
Accurate timing of onset and cessation of rainfall can be determined using onset and cessation of greenness analysis obtained from analysis of NDVI data. In most parts of North East Arid Zone of Nigeria, false onset of rain and early cessation of rain is prevalent as a result of the haphazard pattern of rainfall distribution [27-33].
Comparison between rate of green-up and senescence is shown in Figure 2. It was observed that Maiduguri has the highest rate of green-up. This implies that accelera- tion of photosynthetic activity is high in this area when compared to other areas in this zone. This may be due to the presence of high temperature regimes mostly observ- ed in this area at most times throughout the year. This supports the fact that the sun is a prominent factor in photosynthesis. Bauchi has the highest rate of senescence. This implies that rate of decreasing photosynthetic activ- ity is highest in this zone. Hence, plants are forced to stop growing in this region at a shorter time interval more than other region in the North East arid Zone.
4. Conclusion
This research work has been able to reveal the ability of remotely sensed satellite derived NDVI in the monitoring of greenness of vegetation in North East Arid zone of
0.00 0.05 0.10 0.15 0.20
Stations
rate of greenup
[image:4.595.308.538.606.709.2]rate of senescence
Nigeria. It has also revealed to us that the long-term yearly pattern of NDVI is dependent on the climatic characteristic of each station in the North East Arid zone of Nigeria. The time lag existing between onset of green- ness and onset of rainfall if disseminated to the farmers in this region will help enhance crop yield and food se- curity. In all the stations considered in this research, NDVI peaks in August/September thus confirming the unimodal distribution of rainfall in the North East Arid Zone of Nigeria. The study also established that the growing season in this region though short spanning be- tween May/June to September/October can be maximally utilised if predetermined. Deforestation must be discour- aged in this zone and afforestation project should be car- ried out. Finally, if the accurate timing of growing season is disseminated to the farmers promptly then the use of irrigation practice will be adopted when necessary and genetically improved drought resistant crop can be planted in the North East arid zone of Nigeria.
REFERENCES
[1] T. Hess, W. Stephens and G. Thomas, “Modelling NDVI from Decadal Rainfall Data in the North East Arid Zone of Nigeria,” Journal of Environmental Management, Vol. 48, 1996, pp. 249-261.
[2] E. F. Lambin, P. Cashman, A. Moody, B. H. Parkhurst, M. H. Pax and C. B. Schaaf, “Agricultural Production Moni- toring in the Sahel Using Remote Sensing: Present Possi- bilities and Research Needs,” Journal of Environmental Management, Vol. 38, No. 4, 1993, pp. 301-322. http://dx.doi.org/10.1006/jema.1993.1047
[3] A. D. Malo and S. E. Nicholson, “A Study of Rainfall and Vegetation Dynamics in the African Sahel Using Nor- malized Difference Vegetation Index,” Journal of Arid Environments, Vol. 19, No. 1, 1990, pp. 1-24.
[4] Z. D. Adeyewa, “Satellite Derived Vegetation Index over Africa,” PGD Dissertation, African Regional Centre for Space Science and Technology Education, Obafemi Awolowo University, 2003.
[5] S. D. Prince, C. J. Tucker and F. Rosental, “Satellite Re- mote Sensing of Primarchy Production: Comparison of Results for Sahelian Grassland 1981-1988,” International
Journal of Remote Sensing, Vol. 12, No. 6, 1991, pp.
1301-1312.
http://dx.doi.org/10.1080/01431169108929727
[6] G. Asar, E. T. Kanemasu, G. P. Miller and R. L. Weiser, “Light Interception and Leaf Area Estimates from Mea- surements of Grass Canopy Reflectance,” IEEE Transac- tions on Geosciences and Remote Sensing, Vol. 24, 1986, pp. 76-82.
[7] S. N. Goward, D. G. Dye, S. Turner and S. Liang, “The University of Maryland Improved Global Vegetation In- dex,” International Journal of Remote Sensing, Vol. 15, No. 17, 1994, pp. 3365-3395.
[8] J. A. Gausman, C. J. Tucker and P. J. Sellers, “Global Monthly AVHRR Climatology,” Boulder NOAA NESDIS,
National Geophysical Data Centre (CD Rom), 1995.
[9] P. J. Sellers and D. S. Schimel, “Remote Sensing of the Land Biosphere and Biogeochemistry in the EOS Era: Science Priorities, Methods and Implementation—EOS Land Biosphere and Biogeochemical Panels,” Global Planet Change, Vol. 7, No. 4, 1993, pp. 279-297. http://dx.doi.org/10.1016/0921-8181(93)90002-6
[10] H. N. Le Houérou, “Climate Change, Drought and Deser- tification,” Journal of Arid Environments, Vol. 34, No. 2, 1996, pp. 133-185.
http://dx.doi.org/10.1006/jare.1996.0099
[11] J. M. Kowal and D. T. Knabe, “An Agro Climatological Atlas of the Northern States of Nigeria,” Ahmadu Bello University Press, Zaria, 1972.
[12] N. Peacock and J. Hemrich, “Light and Temperature Re- sponses in Sorghum,” Agrometeorology of Sorghum and Millet in the Semi-Arid Tropics, 42, ICRISAT Centre, 1984.
[13] I. J. Ekpoh, “Estimating the Sensitivity of Crop Yields to Potential Climate Change in North-Western Nigeria,”
Global Journal of Pure and Applied Sciences, Vol. 5, No. 3, 1999, pp. 303-308.
[14] M. J. Mortimore, “Adopting to Drought: Farmers, Fam- ines and Desertification in West Africa,” Cambridge Uni- versity Press, Cambridge, 1989.
http://dx.doi.org/10.1017/CBO9780511720772
[15] J. C. Eidenshink, “The 1990 Conterminous US AVHRR Data Set,” Photogrammetric Engineering and Remote Sensing, Vol. 58, No. 6, 1992, pp. 809-813.
[16] M. Hulme, “Secular Changes in Wet Season Structure in Central Sudan,” Journal of Arid Environment, Vol. 13, No. 1, 1987, pp. 31-46.
[17] O. O. Ilesanmi, “An Empirical Formulation of the Onset, Advance and Retreat of Rainfall in Nigeria,” Tropical Geography, Vol. 34, No. 1, 1972, pp. 17-34.
[18] P. Benoit, “The Start of the Growing Season in Northern Nigeria,” Agricultural Meteorology, Vol. 18, No. 2, 1977, pp. 91-99.
http://dx.doi.org/10.1016/0002-1571(77)90042-5
[19] A. B. Shaw, “An Analysis of Rainfall Regimes on the Coastal Region of Guyana,” Journal of Climatology, Vol. 7, No. 3, 1986, pp. 291-302.
http://dx.doi.org/10.1002/joc.3370070307
[20] M. W. Walter, “Length of the Rainy Season in Nigeria,”
Nigerian Geographical Journal, Vol. 10, 1967, pp. 123- 128.
[21] E. G. Davey, F. Mattie and S. I. Solomon, “An Evaluation of Climate and Water Resources for the Development of Agriculture in the Sudan Savannah Zone of West Africa,” World Meteorological Organization (WMO) Special En- vironment Report No. 9, Geneva, 1976.
[22] R. D. Stern, M. D. Dennett and D. J. Garbutt, “The Start of the Rains in West Africa,” Journal of Climatology, Vol. 1, No. 1, 1981, pp. 59-68.
http://dx.doi.org/10.1002/joc.3370010107
culture, Vol. 18, No. 3, 1982, pp. 223-236. http://dx.doi.org/10.1017/S001447970001379X
[24] O. J. Olaniran and G. N. Summer, “A Study of Climatic Variability in Nigeria Based on the Onset, Retreat and Length of the Rainy Season,” International Journal of Climatology, Vol. 9, No. 3, 1989, pp. 253-269.
http://dx.doi.org/10.1002/joc.3370090304
[25] N. Singh, “The Duration of the Rainy Season over Dif- ferent Parts of India,” Theoretical and Applied Climatol- ogy, Vol. 37, No. 1-2, 1986, pp. 51-62.
http://dx.doi.org/10.1007/BF00866104
[26] R. Ananthakrishnan and M. R. Soman, “Onset of the South West Monsoon over Kerala: 1901-1980,” Journal of Climatology, Vol. 8, No. 3, 1998, pp. 283-296.
[27] M. V. L. Sivakumar, “Predicting Rainy Season Potential from the Onset of Rains in Southern Sahelian and Su- danian Climatic Zones of West Africa,” Agricultural and Forest Meteorology, Vol. 42, No. 4, 1988, pp. 295-305. http://dx.doi.org/10.1016/0168-1923(88)90039-1
[28] D. O. Adefolalu, “Rainfall Trends in Nigeria,” Journal of
Theoretical and Applied Climatology, Vol. 37, No. 4,
1986, pp. 205-219.
http://dx.doi.org/10.1007/BF00867578
[29] R. C. N. Anyadike, “Seasonal and Annual Rainfall Varia- tions over Nigeria,” International Journal of Climatology, Vol. 13, No. 5, 1993, pp. 567-580.
http://dx.doi.org/10.1002/joc.3370130507
[30] T. Aondover and W. Ming-Ko, “Changes in Rainfall Cha- racteristics of Northern Nigeria,” International Journal of Climatology, Vol. 18, No. 11, 1998, pp. 1261-1271. http://dx.doi.org/10.1002/(SICI)1097-0088(199809)18:11 <1261::AID-JOC302>3.0.CO;2-Z
[31] I. J. Ekpoh, “Rainfall and Peasant Agriculture in Northern Nigeria,” Global Journal of Pure and Applied Sciences, Vol. 5, No. 1, 1999, pp. 123-128.
[32] A. Dai, P. Lamb, K. E. Trenberth, M. Hulme, P. D. Jones and P. Xie, “The Recent Sahel Drought Is Real,” Interna- tional Journal of Climatology, Vol. 24, No. 11, 2004, pp. 1323-1331. http://dx.doi.org/10.1002/joc.1083