ISSN Online: 2152-7199 ISSN Print: 2152-7180
Identification of Students at Risk for Attention
Deficit Disorder with Hyperactivity Using the
Response to Intervention Model (RTI)
Giseli Donadon Germano, Simone Aparecida Capellini
Investigation Learning Disabilities Laboratory (LIDA), Speech and Hearing Sciences Department, São Paulo State University “Júlio de Mesquita Filho” UNESP, Marília, Brazil
Abstract
The use of Response to Intervention Model (RTI) has been described in the literature as an important tool for early identification of students at risk of learning problems. However, such studies are rare in the Brazilian population. This study aimed to use the response to intervention model (RTI) as an early identification procedure for At-tention Deficit Disorder (ADD) students from 1st grade level of elementary school in Brazilian population. A total of 118 students participated of this study, aged between 6:0 and 6:11 (years:months), from 1st grade level, of both genders. The study was di-vided into three phases. In the first phase, all students were tested individually with Visual Attention Test software (TAVIS) composed of three tasks: selective attention, alternating attention and sustained attention. Because it was an initial study, all stu-dents were submitted to the Remediation Program with Attention and Working Memory (RAWM) in phase 2. The program consists of attention skills and phono-logical working memory skills (7 individual sessions, 40 minutes each). In phase 3, the students were submitted to the TAVIS. As results, from 118 students, 106 stu-dents concluded all 3 phases, which 34 stustu-dents (32%) met the risk criteria for ADD after being submitted to the program. Of these, 34 students, 15 students (46.7%) re-sponded to the intervention, while 19 students (59.3%) not rere-sponded. These stu-dents who not responded to the intervention program were sent to multidisciplinary care for monitoring and subsequent confirmation of the diagnosis of ADD. The findings of this study able us to conclude that RTI model can be used as an early identification tool for student at risk of attention in the early years literacy deficit.
Keywords
Attention Deficit Disorder/Hyperactivity, Response to Intervention Model (RTI), Early Identification, Assessment, Education
How to cite this paper: Germano, G. D., & Capellini, S. A. (2016). Identification of Stu- dents at Risk for Attention Deficit Disorder with Hyperactivity Using the Response to Intervention Model (RTI). Psychology, 7, 1824-1838.
http://dx.doi.org/10.4236/psych.2016.714169
Received: October 28, 2016 Accepted: December 2, 2016 Published: December 5, 2016
Copyright © 2016 by authors and Scientific Research Publishing Inc. This work is licensed under the Creative Commons Attribution International License (CC BY 4.0).
1. Introduction
Response to Intervention model (RTI) is defined by the National Research Center on Learning Disabilities (NRCLD) as an assessment and intervention process for syste-matic monitoring student progress and making decisions about the need for education changes or increasing intensification services using progress monitoring information
(Johnson, Mellard, Fuchs, & McKnight, 2006).
The main purpose of RTI is to prevent academic and behavioral problems and help identifying students with specific learning difficulties (Reutebuch, 2008). Roth,
Dough-erty, Paul and Adamczyk (2010) described RTI as a model of intervention that is
possi-ble the early identification of students with language disorders, learning and reading problems and thus, a model that provides a cognitive-linguistic instruction that sup-ports these students to overcome their difficulties during the literacy period. RTI has been described in the literature with the following levels: 1) multiple levels, 2) evalua-tion system, 3) protocol and 4) educaevalua-tional intervenevalua-tions based on evidence. There is not necessarily an even relationship between one level and another; also, the levels may overlap depending on the need for intervention (Barnes & Harlacher, 2008).
The principle of multiple levels is one of the most described in the international lite-rature (Hale, 2008; Johnson et al., 2006) and is often developed on three levels. Ac-cording with the authors, level 1 has the aim to identify risk for behavioral and learning problems using procedures based on the academic curriculum of these students, so it would be able to verify if these students reached the expected results for its own group-class. At level 2, the aim is to determine the type of intervention that will be used to assist the student to overcome their difficulties (specific intervention). In addition, in this level, the student must receive a specific intervention, where the teacher in the classroom can count on with help of speech therapists, psychologists, occupational the-rapists or specialized teachers to determine the best intervention model addressed to the teacher or directed to student individually or in-group. At this level 2, it’s important to verify if the student presented or not presented response to intervention. If is the case that the student did not responded, this will imply that he hasn’t overcome his learning or behavioral difficulties, so he must be send to an interdisciplinary assess-ment, which will occur at level 3. In the latter level, the aim will be to perform an inter-disciplinary diagnosis and to check for indication for a specialized service or for special education.
Thus, the use of the RTI model allows classifying the student at his appropriate le-vels, but also monitoring his progress in relation to the teaching-learning process
(Coyne & Harn, 2006; National Association of State Directors of Special Education,
NASDSE, 2006). This means that the data collected in the evaluation should facilitate
Disabili-ties Roundtable, 2005).
However, despite international developments with the use of RTI in school popula-tion has been occurred in the last decades (Gresham, 2002; Coyne & Harn, 2006; John-son et al., 2006; NASDSE, 2006; Barnes & Harlacher, 2008; Roth et al., 2010; Hale,
2012). However, in Brazil there are few researches using the response to intervention
model, that has been published, such as the use of RTI model for early identification of student at risk of dyslexia (Refundini, Martins, & Capellini, 2010; Fadini & Capellini, 2011; Fukuda & Capellini, 2011; Martins & Capellini, 2011; Andrade, Andrade, &
Ca-pellini, 2014; CaCa-pellini, Cesar, & Germano, 2015) and only recently for ADHD (Capellini,
Silva, & Germano, 2015; Germano & Okuda, 2015; Germano, Silva, & Capellini, 2015).
The Diagnostic and Statistical Manual of Mental Disorders (American Psychiatric
Association, APA, 2013) Attention Deficit Hyperactivity Disorder (ADHD) by the
per-sistent presence of inattention signs and/or hyperactivity-impulsivity that end up inter-fering with the language development, motor, social and academics impairments.
Among the damages described in the literature, students with ADHD have academic difficulties, such as poor performance in reading and writing activities, logical-mathe- matical reasoning, reading comprehension, motor skills resulting from neuropsycho-logical changes (DuPaul, Weyandt, & Janusis 2011; Dyck & Piek, 2014). Although there is a vast literature about low academic performance and how this affects the student progress throughout academic life, there is only a few studies about the early identifica-tion and intervenidentifica-tion with students at risk for ADHD. This reinforces the idea that it is imperative and necessary the improvements of studies about early identification and interventions in school context, particularly during the early years of literacy.
Among the options of intervention in the classroom, Sayal, Hornsey, Warren,
Mac-Diarmid and Taylor (2006) described a training program with teachers, which the aim
was to teach them to identify students at risk for ADHD by themselves, in order to faci-litate recommendations to specialized services for further diagnoses. This study in-volved only teachers and was divided into four phases. Phase 1 consisted of a training of recognition, which teachers should indicate which student would fill signs of inat-tention and/or hyperactivity, using the criteria described in the Diagnostic and statis-tical manual of mental disorders—DSM-IV (APA, 1994).
The survey was repeated after six years. Sayal, Merrell, Tymms and Kasim (2015)
conducted a follow-up survey to investigate the impact of the interventions described above, with the application of tests to re-evaluate the performance of students who were identified as risk for ADHD. According to the results, the authors reported that there was a relationship between the symptoms of inattention and poor academic perfor-mance. The same relationship was not observed when compared to impulsivity symp-toms. The authors concluded that behavioral and educational interventions could maximize the potential of interventions.
Haraway (2012) conducted a survey in order to provide an overview of possible
evaluation methods, taking in account the needs of students with ADHD, using the model of RTI (combination of layers) and also using an intervention models for posi-tive behavior. The author described that normally, RTI model includes three layers. In the first layer, all the students were submitted to assessments and interventions with academic and behavioral strategies. In the behavioral field, such strategies include training students for appropriate behaviors (i.e. knowledge of classroom routines), and supported by a system of recognition/reinforcing positive behavior. The results of the evaluations were analyzed, providing the basis for the preparation of layer 2, which was designed to complement layer 1, but including intervention in small groups and moni-toring of students’ progress. Layer 3 was designed for a direct intervention with small number of students who have not made progress. The author referred that it was possi-ble to use RTI model (layers 1 and 2), but also, this study showed the possibility of car-rying out assessments or surveys based on curriculum content, involving math skills, reading and spelling skills, and then use this content to select or program the assess-ments subtests. After this selection, the author indicated that the academic process could be graphically represented, favoring communication with parents and other pro-fessionals in the teaching-learning process.
Also, in the same study, another example given by the author was regarding the combination of layers 2 and 3 of RTI model. It was possible monitoring students’ pro- gress, referring to a direct observation of behavior that was carried out in the class-room, that is, to compute and to record the occurrence of a behavior (i.e. the number of times the student talked without permission or the number of minutes the student kept sit). Initially, one researcher or teacher should select a target behavior and then perform the collection within a specified period. For convenience, the viewer can convert beha-viors to percentage to allow quick comparison. This information will help educators and consultants to determine if the target behavior is specific to the student or indicates that the problem may be due the classroom management.
Andrade, Andrade and Capellini (2014) reported that the most common model and
layer 2, the students identified as “at risk” (i.e. those who do not responded adequately to the intervention of layer 1 or universal screening) receive a secondary intervention (also called intervention Layer 2), characterized by instruction directed at small groups of 3 to 4 students with weekly or fortnightly monitoring of their progress. At layer 3, those who still didn’t responded to an intervention are redirected to a diagnosis pro- cesses.
Fuchs and Fuchs (2006) highlighted three aspects considered as essential to the
im-plementation of these models: 1) systematization of identification processes, interven-tion and evaluainterven-tion of responsiveness, 2) involvement of highly trained professionals through continuous training, and 3) reasoning on scientific evidence regarding both monitoring, content strategies and interventions, as well as the monitoring of student progress.
Thus, according to described above, the hypothesis of this study is that students at risk for Attention Deficit Disorder (ADD) could be identified by using layer 1 of the RTI model, i.e. assessment and intervention using visual attention skills and phonolog-ical working memory skills.
Thus, this study aimed to use the first layer of Response to Intervention model (RTI) as an early identification and intervention procedure for identification of students at risk for Disorder Attention Deficit Disorder (ADD) of 1st grade level of elementary school.
2. Method
This study was approved by the Ethics under the Protocol 0663/2013 the Faculty of Philosophy and Sciences, São Paulo State University Committee “Júlio de Mesquita Filho” (FFC/UNESP).
Participated of this study 118 students aged from 6:0 years-old to 6:11 years-old, of both sex, from 1st grade level of elementary school. As exclusion criteria for this re-search, it was considered: students with sensory, motor or cognitive impairment and students who did not present signature of the Consent and Informed Term. Inclusion criteria: students who present signature of the Consent and Informed Term, students without presence of sensory, motor or cognitive impairment constant in school records. This study was focused the first layer of the RTI model, and was composed of three phases, being performed in a period of 6 months.
As procedure, this study was divided into three phases, such as pre-testing, interven-tion and post-testing procedures. In the first phase, all students were tested individually using Visual Attention Test Software (TAVIS-4, Duchesne & Mattos, 1997). This test was applied in a single session (duration of 20 to 30 minutes). The student was assessed in a separate and silent room of the school. The student was placed in front of a com-puter, and received a joystick. The instruction consisted that the student must press the button of the joystick after Examiner orientation regarding the task. Visual Attention Test Software (TAVIS-4, Duchesne & Mattos, 1997; Coutinho, Mattos, Araújo, &
At-tention and Visual Sustained AtAt-tention as described below:
- Task 1: Visual Selection Attention Task. It consists in making the student to re-spond selectively to a target stimulus, ignoring the presence of other stimuli (distrac-tors). This task is the presentation of sequential stimuli (colored animals, i.e. yellow and green hippopotamus, blue and red squirrel, green lion) and it was required that the student to identify a target (specific colored animal, i.e. yellow hippopotamus with black spot on body) among several other distractors stimuli, responding exclusively to it. The stimulus was presented one by one at computer screen. Thus, Coutinho et al.
(2007) reported that in addition to the attention capacity, the task requires visual
scan-ning (ability to follow with their eyes a set of information in line) and it’s an important ability to visual selectivity. The result of this task may be indicative of problems with attention or selectivity skills.
- Task 2: Visual Alternate Attention Task. In this task, the student should pay atten-tion and respond alternately to two different parameters equal/different. At the com-puter screen, geometric shapes were presented. When the forms were shown in green, the student should press the button if the forms were identical (e.g. Circle with circle). When the forms were presented in red, the student should press the button if the forms were different (e.g. Circle with square). This alternation task requires the ability to change the focus of attention among different parameters of the same concept
(Coutinho et al., 2007).
- Task 3: Visual Sustained Attention Task. This task requires the student to sustain attention to the computer screen for a long period, in order to respond quickly to the emergence of a stimulus. On the computer screen, the stimulus presented was a clock that appeared in different positions on the screen. The stimulus appeared and then disappeared. The student should pay attention to the screen because the stimulus ap-peared again after a randomized time interval in another position on the screen. This task primarily demand sustained attention, being a long-term task (lasts six minutes for students with 7 minutes).
The software itself performs the score. There are three types of punctuation. First punctuation is obtained by the number of correct answers (NCA). Second punctuation is the number of errors per omission (NEO), which consists of not detecting the occur-rence of a target stimulus, failing to respond to this or responding very slowly (not pressing the button of joystick). The third punctuation is the number of errors per ac-tion (NEA), which consists of responding in the absence of the stimulus target, or pressing the joystick button when there is no stimulus on the screen (task 3) or against the appearance of a non-target stimulus (tasks 1 and 2). The report errors per action can help us to assess the tendency to impulsiveness of the student. This parameter is particularly important in the diagnosis of Attention Deficit Disorder (ADD) in each of the three tasks (Duchesne & Mattos, 1997).
mean values above percentile 25 for number of errors per omission and for number of errors per action). This percentile was chosen in an attentive to select a great number of student at risk, considering a preventive aspect. If a student met this criteria, he or she was considerate as “at risk” for ADD and was addressed to phase 2.
In phase 2, the students “at risk” were submitted to the Remediation Program with Attention and Working Memory (RAWM; Capellini, Silva, & Germano, 2015;
Germa-no, Silva, & Capellini, 2015) in phase 2 of this study. The program consisted of 8
ses-sions, applied individually, twice a week, with sessions lasting 30 to 40 minutes in the school class period in a separate room. The program was composed by figures of subs-tantives, previously selected by linguistic criterions (Germano & Capellini, 2015).
In this program, activities were designed to work the working memory skills and attention, based in Baddeley (1986) Model. For working memory skills were developed activities such as grouping of figures by semantic category (animals and fruits); Figures grouping (animals and fruits) according with the initial letter (alphabet target); organi-zation of stories in sequence with figures; sequential memory with figures and letters; create mental images (relate sentence with figures; relate numbers with geometric shapes and form sequences of numbers). For attention skills, it was prepared activities such as finding differences between the two pictures; figures finding and words find-ings; visuospatial relationship with figures, geometric shapes and letters; memory game with figures and letters; creating mental images (create phrases and numbers using fig-ures and geometric shapes).
In the third phase, all students were re-tested individually using Visual Attention Test Software (TAVIS-4, Duchesne & Mattos, 1997).
3. Results
Initially, 118 students were selected from the first grade level of elementary school. However, 12 students were excluded for not performing all intervention sessions pro-vided in this study due to excessive absences. Thus, 106 students participated in all phases. The classification of the socioeconomic level was performed based on the statis-tical study of the Socioeconomic Development Index (Foundation of Economy and
Sta-tistics, 2003), thus guaranteeing the homogeneity of the sample from an average
so-cioeconomic point of view.
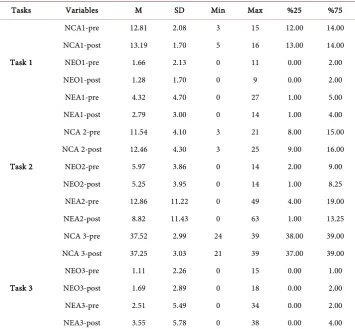
Table 1 shows the distribution of mean, standard deviation, minimum and
maxi-mum values, values of percentiles 25 and 75. Therefore, it was used as cutoff point per-centile 25, such as mean values below perper-centile 25 for number of correct answers (NCA) and mean values above percentile 25 for number of errors per omission (NEO) and for number of errors per action (NEA). This criterion was used both in the pre-testing analysis as in post-testing. In addition, the students selected to be submitted to the remediation program should fulfil those criterion in at least five of the nine va-riables that composed the elaborate remediation procedure.
sub-mitted to Remediation Program with Attention and Working Memory (RAWM;
Capel-lini, Silva, & Germano, 2015; Germano, Silva, & CapelCapel-lini, 2015) in phase 2. Table 2
shows the distribution the results of the comparison of pre and post-testing of Visual Attention Test Software (TAVIS-4, Duchesne & Mattos, 1997), using Wilcoxon Signed Ranks Test.
In Table 2, there was a statistical difference in task 1 (selectivity) for number of
er-rors per action (NEA). There was diminish of mean when comparing pre and post- testing. This finding suggest that students improved their attention in selecting a stimu-li target and a reducing in impulsivity behavior. There was a statistical difference in task 2 (alternation attention) for all variables number of correct answers (NCA), number of errors by omission (NEO) and number of errors per action (NEA), showing a reducing of numbers of errors in post-testing and an increasing in the number of correct an-swers, suggesting a positive interference of the remediation program.
[image:8.595.196.552.352.681.2]In addition, there was a statistical difference in task 3 (task of sustained attention) of number of errors by omission (NEO) and number of errors per action (NEA). Howev-er, there was an increase of the number of errors by omission and errors by action. This
Table 1. Distribution of mean (M), standard deviation (SD), minimum (min) and maximum
values (max), percentiles values 25 (25%) and 75 (75%) of the students in TAVIS-4 tasks.
Tasks Variables M SD Min Max %25 %75
NCA1-pre 12.81 2.08 3 15 12.00 14.00 NCA1-post 13.19 1.70 5 16 13.00 14.00
Task 1 NEO1-pre 1.66 2.13 0 11 0.00 2.00
NEO1-post 1.28 1.70 0 9 0.00 2.00
NEA1-pre 4.32 4.70 0 27 1.00 5.00
NEA1-post 2.79 3.00 0 14 1.00 4.00
NCA 2-pre 11.54 4.10 3 21 8.00 15.00 NCA 2-post 12.46 4.30 3 25 9.00 16.00
Task 2 NEO2-pre 5.97 3.86 0 14 2.00 9.00
NEO2-post 5.25 3.95 0 14 1.00 8.25
NEA2-pre 12.86 11.22 0 49 4.00 19.00 NEA2-post 8.82 11.43 0 63 1.00 13.25 NCA 3-pre 37.52 2.99 24 39 38.00 39.00 NCA 3-post 37.25 3.03 21 39 37.00 39.00
NEO3-pre 1.11 2.26 0 15 0.00 1.00
Task 3 NEO3-post 1.69 2.89 0 18 0.00 2.00
NEA3-pre 2.51 5.49 0 34 0.00 2.00
NEA3-post 3.55 5.78 0 38 0.00 4.00
Table 2. Distribution of mean, standard deviation (SD) and p value between pre and post-testing TAVIS-4.
Tasks Variables n Mean Standard deviation p-value
NCA1-pre 106 12.81 2.084 0.15
Task 1 NCA1-post 106 13.19 1.702
NEO1-pre 106 1.66 2.133 0.11
NEO1-post 106 1.28 1.695
NEA1-pre 106 4.32 4.704 0.00*
NEA1-post 106 2.79 3.004
NCA 2-pre 106 11.54 4.108 0.01*
Task 2 NCA 2-post 106 12.46 4.301
NEO2-pre 106 5.97 3.863 0.02*
NEO2-post 106 5.25 3.955
NEA2-pre 106 12.86 11.222 0.00*
NEA2-post 106 8.82 11.436
Task 3 NCA 3-pre 106 37.52 2.990 0.36
NCA 3-post 106 37.25 3.036
NEO3-pre 106 1.11 2.265 0.04*
NEO3-post 106 1.69 2.899
Legend: NCA: number of correct answers; NEO: number of errors by omission; NEA: number of errors per action. Wilcoxon Signed Ranks Test (*p < 0.05).
result suggest that there was a maintenance of an attention deficit or an impulsivity by the students for task 3 (Sustained attention Task), which indicates a possible mainten-ance of sustained attention deficit for a greater time interval, demonstrating a lack of response of students and so, confirming the presence of students “at risk” for ADHD.
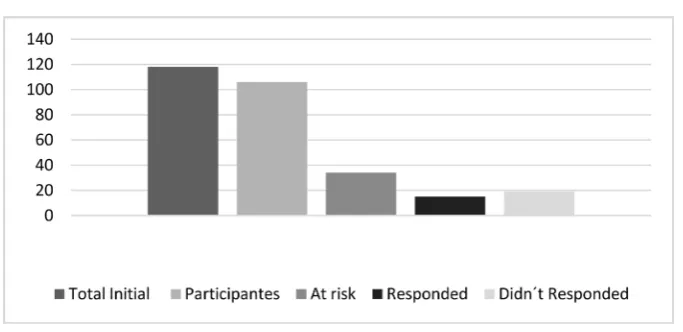
As results, from 118 students, 106 students concluded all 3 phases, which 34 students (32.07%) met the risk criteria for ADHD after being submitted to the program. Of these 34 students, we found that 15 students (44.12%) responded to the intervention, while 19 students (55.88%) not responded.
Of the total of 106 school participants, 34 students (32.07%) met the criteria de-scribed above. After being subjected to elaborate remediation program (RAMT), the students were again submitted to TAVIS and was reapplied the same cutoff criteria in order to see which school not respond to the intervention, that is, who did not have performance improvement post-testing situation. From these 34 students (Figure 1). These students who not responded to remediation program developed in this study were referred to specialized care for monitoring and subsequent confirmation of the diagnosis of ADHD. Figure 1 resume the findings of this study.
4. Discussion
Figure 1. Distribution of students according to the Model Response to Intervention (RTI).
to intervention that occurred in 55.88% (19 students) of the sample. This represents a great advance in terms of diagnostic and innovation in educational policy in Brazil, since as a common procedure is to direct students to a health care center in later ages.
The purpose of early identification is to determine which children have developmen-tal problems that may be obstacles to learning or that place children at risk. Develop-ment in infants, toddlers, and preschoolers is characterized by broad variability in rates and patterns of maturation. For some children, differences and delays in abilities are temporary and are resolved during the normal course of development. For other child-ren, delays may persist in different domains of functioning, necessitating the child’s re-ferral for targeted screening and/or comprehensive evaluation (National Joint
Com-mittee on Learning Disabilities, NJCLD, 2005).
There is a consensus in the literature that the identification and early prevention of risk students for learning disabilities and attention is a fundamental and important pre-diagnostic procedure in the educational context, since it allows us to influence a high plasticity phase of neurocognitive systems involved in the acquisition of written language at the same time can prevent the development of a school gap too much which causes the low academic performance (Catts, Fey, Zhang, & Tomblin, 2001; Germano & Okuda, 2015; Reynolds & Shaywitz, 2009; Capellini, Cesar, & Germano, 2015; Fletcher
& Vaughn, 2009).
The students from this study showed an improvement from in task 1 and task 2 from Visual Attention Test Software (TAVIS-4, Duchesne & Mattos, 1997; Coutinho, Mattos,
Araújo, & Duchesne, 2007). In task 1 (Visual Selection Attention Task) the students
improved their performance, that consists in making the student to respond selectively to a target stimulus, ignoring the presence of other stimuli (distractors). In task 2 (Vis-ual Alternate Attention Task), the students improved their ability to change the focus of attention among different parameters of the same concept.
respond to the appearance of a stimulus for all the tasks already mentioned (Coutinho
et al., 2007).
The first type of errors (number of errors by omission) was described by Coutinho et
al. (2007) has an indicative of attention or selectivity. The second type of errors number
of errors per action may be related to impulsivity problem (Coutinho et al., 2007).
Slo-bodin, Cassuto and Berger (2015) described that sustained attention, characterized as
the ability to concentrate on a specific stimulus over a period of time, develops slower. Meanwhile, other functions, such as inhibitory control, an important component of executive function that allows for the suppression of actions and resistance to interfe-rence from irrelevant stimuli, do not show a clear developmental trajectory.
Studies investigating sustained attention in students with ADHD have rather consis-tently shown that these students have frequent lapses of attention during continuous performance tasks. In contrast, studies investigating selective attention have shown children with ADHD to have intact selective attention on a variety of tasks, including visual search, visuospatial orienting, perceptual load, and perceptual discrimina-tion-distractibility tasks (McAvinue et al., 2015).
An inability to sustain attention is one of the hallmark symptoms of ADHD. The re-sults of this study were also supported by McAvinue et al. (2015), who tested 25 stu-dents using the Sustained Attention to Response Task (SART). The results showed evi-dence that students with ADHD showed an impaired ability to sustain attention during the SART, as evidenced by a significantly higher number of errors.
These results were also founded in Tsal, Shalev and Mevorach (2005). The authors assessed participants with attention-deficit/hyperactivity disorder (ADHD) using four tasks uniquely assessing the functions of selective attention, executive attention, tained attention, and orienting of attention. The results showed that deficits in sus-tained attention were the most pronounced, characterizing most participants with ADHD and deficits in each of the other three functions characterized more than half of these participants. Different participants with ADHD revealed different clusters of at-tentional deficits. These results call for a revision of leading theories of ADHD that identify the core of the pathology as a sole deficit in executive functions
Thus, Stern and Shalev (2013) investigated the relation and impact of sustained at-tention and the number of correct answers reading performance. The researchers re-vealed that participants with good sustained attention answered significantly more questions correctly and read the text faster compared to participants with medium sus-tained attention and compared to participants with poor sussus-tained attention. The au-thors highlighted that good sustained attention is related to successful reading com-prehension not only when comparing good and poor participants in sustained attention but more so when comparing good and average participants in sustained attention.
Studies also have reported the positive effect in attention training over the years.
Tamm et al. (2013) referred that researchers have turned to investigate attention
studies of attention training in ADHD also provide initial support for improvements on untrained measures of attention and academic efficiency.
Likewise, regarding with intervention programs for students with ADHD, Rapport et
al. (2013) referred that, of the executive functions and related attentional processes
re-viewed, only working memory (WM) central executive processes and vigilance/sustained attention abilities were associated with large magnitude deficits and related to core symptoms and/or functional outcomes in children with ADHD.
5. Conclusion
The results of this research point to the need to (re)think the importance of knowledge and identification of the individual profile of abilities and difficulties for each grade level, especially in early years, which literacy plays a great roll. Furthermore, the early identification of students at risk for ADHD in the classroom context favors to contem-plate individual needs with early intervention, thereby minimizing the impact of atten-tion and phonological working memory difficulties in reading and writing learning.
The findings of this study showed that the use of the RTI model could be used as an early identification tool for students at risk of attention deficit in the early years of lite-racy, as the population of this study.
Despite the fact of being a recent study using RTI model in Brazilian population, it is important to highlight that from 106 students, 19 students (59.3%) not responded to intervention. These findings bring an important contribution for public educational policy regarding the need of more studies using RTI model in early grade level. In addi-tion, this highlight the necessity of orientation of teachers and clinicians to ensure the observation of manifestation in school context, the necessity of the application of sys-tematic screenings for early identification and monitoring students progression, and finally, to observe the need of adaptation strategies and implementation of curricular adaptations to encourage these students in academic activities in the classroom.
Acknowledgements
To Brazilian National Council for Scientific and Technological Development (CNPq) for supporting this research (Universal Notice MCT/CNPq number 14/2012).
References
American Psychiatric Association (APA). (1994). Diagnostic and Statistical Manual of Mental Disorders—DSM-IV (4th ed). Washington DC: APA.
American Psychiatric Association. (2013). Diagnostic and Statistical Manual of Mental Disorders (DSM-5). American Psychiatric Pub.
Andrade, O. V. C. A., Andrade P. E., & Capellini, S. A. (2014). Response to Intervention Model: RTI: How to Identify and Intervene with Children at Risk for Learning Disorders. São José dos Campos: Pulse Editorial.
Baddeley, A. D. (1986). Working Memory. Oxford: Oxford University Press.
https:/doi.org/10.1353/etc.0.0000
Capellini, S. A., César, A. B. P. C., & Germano, G. D. (2015) Early Identification of Reading Problems: Preliminary Study with Students of 1st Grade. Procedia-Social and Behavioral Sci- ences, 174, 1351-1355. https:/doi.org/10.1016/j.sbspro.2015.01.758
Capellini, S. A., Silva, E. C., & Germano, G. D. (2015). The Use of the Response to Intervention Model (RTI) for the Identification of Attention Deficit Hyperactivity Disorder. In: A. C. Ma-chado, K. K. Borges, & S. F. Bello (Eds.), Attention Deficit/Hyperactivity Disorder (ADHD): Clinical and Educational Practice (pp. 119-132). Marília, SP: FUNDEPE Editora, FUNDEPE Publishing.
Catts, H. W., Fey, M. E., Zhang, X., & Tomblin, J. B. (2001). Estimating the Risk of Future Read-ing Difficulties in Kindergarten Children: A Research-Based Model and Its Clinical Imple-mentation. Language, Speech, and Hearing Services in Schools, 32, 38-50.
Coutinho, G., Mattos, P., Araujo, C., & Duchesne, M. (2007). Attention-Deficit/Hyperactivity Disorder: Diagnostic Contribution of a Computerized Assessment of Visual Attention. Arc-hives of Clinical Psychiatry, 34, 215-222. https:/doi.org/10.1590/S0101-60832007000500003
Coyne, M. D., & Harn, B. A. (2006). Promoting Beginning Reading Success through Meaningful Assessment of Early Literacy Skills. Psychology in the Schools, 43, 33-43.
https:/doi.org/10.1002/pits.20127
Duchesne, M., & Mattos, P. (1997). Normatization of a Computerized Visual Attention Test (TAVIS). Archives of Neuropsychiatry, 55, 62-69.
DuPaul, G. J., Weyandt, L. L., & Janusis, G. M. (2011). ADHD in the Classroom: Effective Inter-vention Strategies. Theory into Practice, 50, 35-42.
https:/doi.org/10.1080/00405841.2011.534935
Dyck, M. J., & Piek, J. P. (2014). Developmental Delays in Children with ADHD. Journal of At-tention Disorders, 18, 466-478. https:/doi.org/10.1177/1087054712441832
Fadini, C. C., & Capellini, S. A. (2011). Efficacy of Phonological Skills Training Program in Children under Risk of Dyslexia. Revista CEFAC, 13, 856-865.
https:/doi.org/10.1590/S1516-18462011005000025
Fletcher, J., & Vaughn, S. (2009). Response to Intervention: Preventing and Remediating Aca-demic Difficulties. Child Development Perspectives, 3, 30-37.
https:/doi.org/10.1111/j.1750-8606.2008.00072.x
Foundation of Economy and Statistics (2003). Índice de Desenvolvimento Socioeconômico (Idese). Porto Alegre: FEE. http://www.fee.tche.br/sitefee/pt/content/estatisticas/pg_idese.php Fuchs, D., & Fuchs, L. S. (2006). Introduction to Response to Intervention: What, Why, and How
Valid Is It? Reading Research Quarterly, 41, 93-99. https:/doi.org/10.1598/RRQ.41.1.4
Fukuda, M. T. M., & Capellini, S. A. (2011). Phonological Skills and Grapheme-Phoneme Train-ing Correspondence in Children under Dyslexia Risk. Revista CEFAC, 13, 227-235.
https:/doi.org/10.1590/S1516-18462010005000074
Germano, G. D., & Capellini, S. A. (2015). Metalinguistic Skills Evaluation (PROHFON): Cha-racterization and Comparison of Students’ Performance. Psychology: Research and Review, 28,
378-387
Germano, G. D., & Okuda, P. M. M. (2015). The Use of the Response to Intervention Model (RTI) for Early Identification of Attention Deficit Hyperactivity Disorder (ADHD) and Deve-lopmental Coordination Disorder (DCD). In O. V. C. A. Andrade, P. M. M. Okuda, & S. A. Capellini (Org.), Topics in Learning Disorders—Part IV (pp. 211-222). Marília-SP/Brazil: FUNDEPE: Academic Culture.
Model (RTI) for Identification of Children with Attention Deficit Hyperactivity Disorder (ADHD). II Meeting on Child Development—II IBNequinho. Salvador.
Goodman, R. (1997). The Strengths and Difficulties Questionnaire: A Research Note. Journal of Child Psychology and Psychiatry, 38, 581-586.
https:/doi.org/10.1111/j.1469-7610.1997.tb01545.x
Gresham, F. M. (2002). Responsiveness to Intervention: An Alternative Approach to the Identi-fication of Learning Disabilities. In: R. Bradley, L. Danielson, & D. P. Hallahan (Eds.), Identifi-cation of Learning Disabilities: Research to Practice (pp. 467-519). Mahwah, NJ: Erlbaum. Hale, J. B. (2012). Response to Intervention: Guidelines for Parents and Practitioners. USA.
http://www.wrightslaw.com
Haraway, D. L. (2012). Monitoring Students with ADHD within the RTI Framework. The Beha-vior Analyst Today, 13, 17-21. https:/doi.org/10.1037/h0100720
Johnson, E., Mellard, D. F., Fuchs, D., & Mcknight, M. A. (2006). Responsiveness to Intervention (RTI): How to Do It. Lawrence, KS: National Research Center on Learning Disabilities. Learning Disabilities Roundtable (2005). Comments and Recommendations on Regulatory Issues
under the Individuals with Disabilities Education Improvement Act of 2004, Public Law 108-446. USA. http://www.copyright.gov/legislation/pl108-446.pdf
Martins, M. A., & Capellini, S. A. (2011). Early Intervention in Students at Risk for Dyslexia: Li-terature Review. Revista CEFAC, 13, 749-755.
https:/doi.org/10.1590/S1516-18462011005000028
McAvinue, L. P., Vangkilde, S., Johnson, K. A., Habekost, T., Kyllingsbæk, S., Bundesen, C., & Robertson, I. H. (2015). A Componential Analysis of Visual Attention in Children with ADHD.
Journal of Attention Disorders, 19, 882-894. https:/doi.org/10.1177/1087054712461935
National Association of State Directors of Special Education (2006). Response to Intervention: Policy Considerations and Implementation. Alexandria, VA: NASDSE Inc.
National Joint Committee on Learning Disabilities (2005). Responsiveness to Intervention and Learning Disabilities. USA. http://www.ldonline.org/njcld
Rapport, M. D., Orban, S. A., Kofler, M. J., & Friedman, L. M. (2013). Do Programs Designed to Train Working Memory, other Executive Functions, and Attention Benefit Children with ADHD? A Meta-Analytic Review of Cognitive, Academic, and Behavioral Outcomes. Clinical Psychology Review, 33, 1237-1252. https:/doi.org/10.1016/j.cpr.2013.08.005
Refundini, D. C., Martins M. A., & Capellini S. A. (2010). Grapheme-Phoneme Correspondence Training in Students at Risk for Dyslexia. Revista Psicopedagogia, 27, 191-201.
http://pepsic.bvsalud.org/scielo.php?script=sci_arttext&pid=S0103-84862010000200005&lng= en&tlng
Reutebuch, C. K. (2008). Succeed with a Response-to-Intervention Model. Intervention in School and Clinic, 44, 126-128. https:/doi.org/10.1177/1053451208321598
Reynolds, C. R., & Shaywitz, S. E. (2009). Response to Intervention: Ready or Not? Or, from Wait-to-Fail to Watch-Them-Fail. School Pschology Quaterly, 24, 130-145.
https:/doi.org/10.1037/a0016158
Roth, F. P., Dougherty, D. P., Paul, D. R., & Adamczyk, D. (2010). RTI in Action: Oral Language Activities for K-2 Classrooms. Rockville, MD: American Speech-Language-Hearing Associa-tion.
Sayal, K., Hornsey, H., Warren, S., MacDiarmid, F., & Taylor, E. (2006). Identification of Child-ren at Risk of Attention Deficit/Hyperactivity Disorder. A School-Based Intervention. Social Psychiatry and Psychiatric Epidemiology, 41, 806-813.
Sayal, K., Merrell, C., Tymms, P., & Kasim, P. (2015). Academic Outcomes Following a School- Based RCT for ADHD: 6-Year Follow-Up. Journal of Attention Disorders, Epub.
https:/doi.org/10.1177/1087054714562588
Slobodin, O., Cassuto, H., & Berger, I. (2015). Age-Related Changes in Distractibility Develop-mental Trajectory of Sustained Attention in ADHD. Journal of Attention Disorders, Epub.
https:/doi.org/10.1177/1087054715575066
Stern, P., & Shalev, L. (2013). The Role of Sustained Attention and Display Medium in Reading Comprehension among Adolescents with ADHD and without It. Research in Developmental Disabilities, 34, 431-439. https:/doi.org/10.1016/j.ridd.2012.08.021
Tamm, L., Epstein, J. N., Peugh, J. L., Nakonezny, P. A., & Hughes, C. W. (2013). Preliminary Data Suggesting the Efficacy of Attention Training for School-Aged Children with ADHD.
Developmental Cognitive Neuroscience, 4, 16-28. https:/doi.org/10.1016/j.dcn.2012.11.004
Tsal, Y., Shalev, L., & Mevorach, C. (2005). The Diversity of Attention Deficits in ADHD the Prevalence of four Cognitive Factors in ADHD versus Controls. Journal of Learning Disabili-ties, 2, 142-157. https:/doi.org/10.1177/00222194050380020401
Submit or recommend next manuscript to SCIRP and we will provide best service for you:
Accepting pre-submission inquiries through Email, Facebook, LinkedIn, Twitter, etc. A wide selection of journals (inclusive of 9 subjects, more than 200 journals)
Providing 24-hour high-quality service User-friendly online submission system Fair and swift peer-review system
Efficient typesetting and proofreading procedure
Display of the result of downloads and visits, as well as the number of cited articles Maximum dissemination of your research work
Submit your manuscript at: http://papersubmission.scirp.org/