Customer Satisfaction, Perceived Service
Quality and Mediating Role of Perceived
Value
Malik, Saif Ullah
Institute of Business Management, Karachi, Pakistan
1 February 2012
Online at
https://mpra.ub.uni-muenchen.de/54733/
Customer Satisfaction, Perceived Service Quality
and Mediating Role of Perceived Value
Saif Ullah Malik
Institute of Business Management, Karachi, Pakistan E-mail: [email protected]
Received: June 10, 2011 Accepted: November 1, 2011 Published: February 1, 2012 doi:10.5539/ijms.v4n1p68 URL: http://dx.doi.org/10.5539/ijms.v4n1p68
Abstract
The main objective of this study is to first find out perceived service quality using SERVQUALand then the role of perceived value as a mediating variable in the service sector of Pakistan. Both descriptive and inferential statistical techniques are used to analyze the effects of independent variables (i.e. perceived service quality) on customer satisfaction (dependent variable) and the role of mediating variable (i.e. perceived value). Stepwise regression analysis is used to examine the effect of the mediating variable (i.e. perceived value) on customer satisfaction. Perceived value was found strongly correlated with satisfaction. Results suggested that perceived value is an important factor in customers’ evaluation of satisfaction. Unlike other studies, I use an aggregate score for perceived service quality instead of service quality characteristics.
Keywords: Perceived service quality, Service expectation, Service perception, Perceived value, Customer satisfaction and SERVQUAL
1. Introduction
It is the regular trend for companies to conduct customer satisfaction surveys to know customer’s point of view (Frank and Enkawa, 2007). Ultimately, improvements on the basis of such surveys are usually considered as improvements in the competitive position of the firm, which ultimately results in better offerings and better customer service (Frank and Enkawa, 2007). With the growth in size of the service sector of the global economy, services are distributed regionally, nationally, and globally and are earning a larger portion of an organizations’ revenues and the quality of their services plays a very important role in customer satisfaction (Landrum, Prybutok, Zhang and Peak, 2009). This paper seeks to identify the level of customer satisfaction in the services sector. It will enable business owners, managers, decision makers and other researchers to identify the best practices in the service sector.
It is easier to compete on the basis of price for products as compared to services (Edvardsson, Johnson, Gustafsson and Strandvik, 2000). They also suggested that companies should establish a system that ensures that all activities lead towards customer satisfaction. According to a market economy businesses compete to satisfy customers and economic prosperity is based on increase in customer satisfaction (Anderson and Fornell, 2000). An interesting view given by Anderson and Fornell, (2000) is that suppliers compete for shoppers, but shoppers do not fight for products. So Anderson and Fornell, (2000) divided customer satisfaction into three determinants: perceived service quality, perceived value and customer expectations. Perceived service quality is expected to have a direct and positive influence on customer satisfaction. Concept of expectations is the standard against performance outcomes (Szymanski and Henard, 2001). Therefore, if consumer’s actual outcomes exceed expectations, the consumer will be considered as satisfied otherwise if expectations exceed outcomes, consumer will be considered as dissatisfied (Szymanski and Henard, 2001). Dagger and Sweeney, 2007 argued that due to intense competition in the service sector, service providers are laying more emphasis on service quality to achieve market leadership.
Phusavat, (2006) explained another important factor regarding importance of customer satisfaction: that perceived value both directly and indirectly influences customer satisfaction. In some industries quality may have a significant positive relationship on customer satisfaction which may not be the case in other industries (Al-Hawari and Ward, 2006).
Here, this study will measure the mediating role of perceived value as attributed by a customer to service quality and customer satisfaction. The main objectives of this study are to find out perceived service quality through gap model (Service perception vs. Service expectation). Later, mediating role of perceived value will be studied. The perceived value (price to quality ratio) and perceived service quality should exert a positive influence on customer satisfaction as evident from literature.
2. Literature review
2.1 Customer satisfaction
In marketing literature the concept of customer satisfaction is the main outcome of marketing practices and occupies an important position in both theory and practice (Churchill and Surprenant, 1982). Satisfaction is the consumer’s good judgment about pleasure versus displeasure (Moliner, Sa´nchez, Rodrı´guez and Callarisa, (2007). Moliner et al, (2007) pointed out two ways:
1) Cognitive nature (which is the comparison between expectations and performance) 2) Affective nature (association with feeling of pleasure)
Lenka, Suar and Mohapatra, (2009) called technology and tangible aspects of service quality the attributes of the service firm as ‘hard quality’ and Customers’ satisfaction is a combination of two responses such as cognitive and affective response to service encounters while, service quality is the overall assessment of a firm’s service delivery system. So, service quality is the delivery of services while satisfaction is customers’ experiences with services. Customers’ assessment of the product/service depends on its demand and the availability of alternative services in the market and information available to the customer. The customer then makes a comparison on the basis of these factors (Lenka et al, 2009). During the evaluation process if customers’ expectations are met with the service; they are more likely to feel satisfied with the service. Positive perception of service quality is the indication of the customers’ satisfaction (Lenka et al, 2009). Generally, customer satisfaction is affected by customer expectations or hopes prior to receiving a service and can be calculated by the following equation given by Parasuraman et al, (1988): “Customer Satisfaction = Perception of Performance – Expectations” . Here differentiation between service expectations and service perceptions must be made because service expectations are an amalgamation of a customer’s predictions about what is likely to happen during a service transaction as well as the wants and desires of that customer. Service perceptions can be defined as a customer’s judgments, which narrate to the superiority of a service (Parasuraman et al, 1988). Reimann et al, (2008) concluded this complex concept into an equation which is
Service Perception – Service Expectation = Perceived Service Quality →Customer satisfaction.
This equation makes the concept of perceived service quality and customer satisfaction very simple. This equation also shows that both perceived service quality and customer satisfaction can be managed and controlled by the service provider. According to the framework of the ACSI theory and research it was revealed that perceived quality is considered as the first determinant of overall customer satisfaction and research strongly recommends that expectation and experienced services have a direct and positive effect on overall customer satisfaction (Fornell et al., 1996,p. 9). Thus, it is evident that ACSI measures perceived quality based on two main components of consumption experience: (1) customization and (2) reliability (Fornell et al., 1996). So from responses we can calculate or compute the perceived service quality (Fornell et al., 1996). Another important aspect revealed by Takala et al, (2006) is that while measuring customer satisfaction individual score is not important but aggregate score is important.
2.2 Perceived service quality
relationships between service quality and customer satisfaction exist. But perceived service quality can be managed by treating employees rightly (Yoo and Park, 2007).
The definition of service quality can be given on the basis of the results of Parasuraman et al, (1988), who state, “Perceived service quality is therefore viewed as the degree and direction of discrepancy between consumers’ perceptions and expectations” (p. 17).Turel and Serenko, (2004) further argued that Perceived quality (PQ) is the actual experience of a customer about service. Jamali, (2007) found a positive relationship between service quality and customer satisfaction. Iglesias and Guille´n, (2004) revealed that perceived quality has a direct and positive influence on the level of customer satisfaction. Quicker delivery of service would be perceived as high service quality, while a slower delivery would be perceived as low service quality (Reimann, Lünemann and Chase, 2008).
Szymanski and Henard, (2001) divided the functions of expectations in satisfaction into two: one is the anticipation of satisfaction; the other is the role of expectations as comparative referents. When we discuss expectations as anticipation, the customer thinks that expectations have a direct influence on satisfaction levels. Hence, the concept of expectations is the standard against which performance outcomes are measured. If consumer’s actual outcomes exceed expectations, the consumer will be called satisfied and in the same way if expectations exceed outcomes, consumer will be called dissatisfied.
Ueltschy, Laroche, Eggert and Bindl, (2007) revealed while comparing US and Japan in context that high performance will lead towards high expectations which will eventually yield high customer satisfaction and high perceived service quality. Omachonu, Johnson and Onyeaso, (2008) explained that according to the American Customer Satisfaction Index (ACSI), customer expectations are evaluated by asking the customer to recall the level of quality they expected on the basis of their knowledge about service or goods and actual experience with a goods or services. Based on these basic questions, responses are obtained from the customer on the three basic questions given by Fornell et al., 1996, p. 10)
a) Overall expectation with goods or services b) Expectations regarding customization and c) Expectations regarding reliability.
Hamer, (2006) advises the practitioners that the service performance received by consumers should exceed their expectations. The gap between expectation and perceived service quality (PSQ) is related to the consumer satisfaction/dissatisfaction. So, Hamer, (2006) suggested some managerial implications which are the practice of “under-promising and over-delivering”. From this result, managers should look for lesser consumers’ expectations (i.e. under-promise) in order to ensure they can go above those expectations (i.e. over deliver). But another view is that due to gap in expectation and performance, service quality perceptions result that under-promising (i.e. lower consumers’ expectations) will result in lower quality perceptions; high expectations of service performance will be associated with high perceptions of service quality. Hamer, (2006), therefore suggested that managers who want to increase customer perceived quality should decrease the gap between expected quality and actual received service by the raising of expectations instead of trying to maximize the gap between delivered service and expectations. Expectations can be taken as equivalent to perceptions of service quality before use of service. These perceptions before the use of service are then expectations, according to perceived performance, and become perceptions of quality after use of service (Hamer, 2006). Hamer, (2006) pointed out some disadvantages of low expectations e.g. if consumers expect low service they will perceive the service firm as a relatively low quality service provider. Even, if the service firms exceed consumers’ expectations they will still be perceived as low quality providers of the service. If the firm went in “under-promising” phenomenon, than the expectations could not be revised up to a level which is beneficial to a firm. Thus “under-promising” will result in lower levels of perceived service quality. Therefore, it is important to remember that it is better to meet high expectations than to exceed low expectations (Hamer, 2006). The gap between perceived performance and expectations can be taken as a measure of perceived service quality. The gap between perceived and expected quality can be well measured by SERVQUAL (Hamer, 2006). Hence, Perceived Service Quality = Service Perception – Service Expectation
2.3 Perceived value
quality (Edvardsson et al, (2000). According to Ekloef, Hackl and Westlund, (1999) quantitative examples relating to service sectors are more than in the manufacturing sector and most studies revealed the trend towards reduced customer satisfaction levels. They argued that production in the economic system also depends on quality as perceived by the customers. So, it is necessary to make straightforward measurement of price changes with respect to customers’ perceptions on the quality of the products and services. Matzler et al, (2006) argued that if perceived quality is more than perceived costs, customer value is high and vice versa. They called this concept as Price-Quality ratio. If price is high, the satisfaction with price will be high (Matzler et al, 2006). If there are no hidden costs and if prices do not change unexpectedly customers will perceive high price reliability. They pointed out another important dimension of consumers’ reaction to prices viz; if consumers think price is unfair; they will be not be able to pay it. A firm should not mainly focus on competitors’ prices rather firms should focus on providing the right quality at the right price to the customer.
Ladhari and Morales, (2008) argued that though it is a very important concept, only few research have investigated the antecedents and the consequences of perceived service value in detail. To develop a long term relationship with customers, perceived service value is very important for managers of business. Frank and Enkawa, (2007) revealed that consumer satisfaction can be raised in two ways: either by delivering higher consumer-perceived quality at the same price or by delivering the same quality at a lower price. Frank and Enkawa, (2007) thus found the relationship between perceived value and customer satisfaction. Where perceived value (PV) includes the price dimension to perceived quality and, therefore, it is the perception of quality for money (Turel and Serenko, 2004).
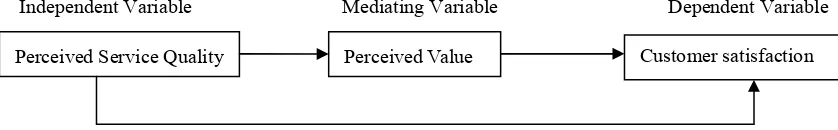
3. Theoretical frame work
Insert Figure1 here 4. Hypothesis
H1: Perceived service quality has positive influence on customer satisfaction.
H2: Perceive value mediates the affect of Perceived service quality on customer satisfaction.
5. Methodology
5.1 Data collection and instruments
This paper measures customer satisfaction in the services sector. The data will be from four main service industries viz banking, transport, courier, and telecommunication. From each industry we took one company which is providing services to many customers or has a large customer base. 400 questionnaires were distributed using convenience sampling technique out of which 78 questionnaires from transport, 77 from banking, 81 from courier and 79 from telecom sectors were collected and finally after rejecting some incomplete questionnaires that were received. A total of 75 from each industry were taken. Therefore, a total of 300 is the sample for the whole service sector in the region which is a response of 75%.
This paper first measures the gap between service perception and service expectation of a customer about service and then its impact on customer satisfaction was checked. A four item Customer satisfaction questionnaire of Hennig-Thurau (2004) on 7-points likert scale was used. Perceived value is measured via the 5 items derived from Dodds et al, (1991) on 7-points likert scale and for perceived service quality 22 items of expectation and 22 items of perceived service quality SERVQUAL by Parasuraman et al, (1988) on 7-points likert scale was used. This paper will use SERVQUAL scale which is the most widely used measure in service sector.
5.2 SERVQUAL
indicating their expectations of the service delivered by excellent firms in a service sector and the second reflecting their perceptions of the service delivered by a service provider within that sector. However, one item E10 was missed erroneously, so 21 items were taken for both service expectation and service perception. SERVQUAL is based on the intention that service quality can be measured as the gap concept which is gap between the service that customers expect and the performance they perceive to have received (Landrum et al, 2009). In this study we will take the total scores of all variables.
We measured Service perception (SP) as,
SP=(SP1+SP2+SP3+SP4+SP5+SP6+SP7+SP8+SP9+SP10+SP11+SP12+SP13+SP14+SP15+SP16+SP17+SP18 +SP19+SP20+SP21+SP22)/22
While, Service Expectation (SE) is measured as,
SE=(SE1+SE2+SE3+SE4+SE5+SE6+SE7+SE7+SE8+SE9+SE+SE11+SE12+SE13+SE14+SE15+SE16+SE17+ SE18+SE19+SE20+SE21+SE22)/22
So, our final equation for Perceived Service Quality will be
Perceived Service Quality (PSQ) = Service Perception (SP) – Service Expectation (SE) While Perceived Value (PV) and Customer Satisfaction (CS) are measured as,
Perceived Value (PV) = (PV1+ PV2 + PV3 + PV4 + PV5)/5 Customer Satisfaction (CS) = (CS1 + CS2 + CS3 + CS4)/4
5.3 Methodology
A statistical package (SPSS) version 17.0 is used to analyze the questionnaire data. Firstly, the validity and reliability of measurement scales is measured. Secondly, Pearson correlation analysis and descriptive statistics is conducted to analyze the constructs and test direct relationship between independent variable and dependent variable. Thirdly, stepwise regression analysis is used to examine the mediating effect of perceived value of perceived service quality on customer satisfaction. By using stepwise regression analysis, this study may assess the direct relationship between independent and dependent variables as well as show the causal relationship and the nature of relationship between variables. It can accurately quantify the magnitude and direction of each independent variable, and vary the mediating variable relationship between many independent variables and one dependent variable. The mediator variable can be clearly measured when a previously significant effect of predictor variables is reduced to non significant or reduced in terms of effect size after the inclusion of mediator variables into the analysis (Baron and Kenny, 1986).
5.4 Reliability analysis of scale
Table 1 shows that the survey questionnaires have 21 items for service expectation and 21 items for service perception, perceived value (5 items) and customer satisfaction (4 items). The Kaiser-Mayer-Olkin Test (KMO) which is a measure of sampling adequacy was carried out for each variable and the results indicated that it was acceptable and all variables exceeded the minimum standard of 0.6, all results were significant in Bartlett’s test of sphericity, Alpha values for these scale items were service expectation 0.746, service perception 0.689, Perceived Value 0.843 and Customer Satisfaction 0.837. All variables exceeded the acceptable standard of reliability analysis. These statistical results showed that the measurement scales used in this study met the acceptable standard of validity and reliability analysis as shown in Table 1.
Insert Table 1 here
6. Results and analysis
6.1 Regression and correlations analysis
The results of testing mediating model using a stepwise regression analysis are shown in Table 4. In this model testing, independent variable in Step 1 was then followed by entering, mediating variable in Step 2. An examination of multicollinearity in the coefficients table shows that the tolerance values for the relationship between the independent variable (i.e. perceived service quality) and the dependent variable (i.e., customer satisfaction) were 0.986., indicating the variables were not affected by multicollinearity problem.
The addition of these variables in this step had explained only 9.4 percent of the variance in dependent variable. Step 2 revealed that the relationship between perceived service quality and customer satisfaction was significant (β=.534, p<0.001) when perceived value was included in the analysis, therefore H2 supported. Specifically, the addition of perceived value in the analysis had provided implication that the previous significant relationship between perceived service quality and customer satisfaction (Step 1: β=.309, p<0.001) did not change to non significant (Step 2: β=.239, p<0.001), but the effect size of such relationships was decreased. In terms of explanatory power, the addition of perceive value in Step 2 had explained 37.5 percent of the variance in dependent variable. Statistically, these results showed that after the addition of perceived value in the analysis, the strength of relationship between perceived service quality and customer satisfaction has increased, indicating that perceived value does act as a partial mediating variable in the relationship between perceived service quality and customer satisfaction.
Insert Table 2 here Insert Table 3 here Insert Table 4 here 7. Discussion and managerial implications
The finding for this research shows that perceived value does act as a partial mediating variable in the overall relationship between perceived service quality and customer satisfaction. The mediating variable can be clearly measured when a previously significant effect of predictor variables is reduced to non significant or reduced in terms of effect size after the inclusion of mediator variables into the analysis (Baron and Kenny, 1986).
In terms of theoretical contribution, this study confirms that perceived value has mediated the effect of perceived service quality on customer satisfaction. Unlike other studies, this study uses an aggregate score for perceived service quality instead of service quality characteristics. This finding is consistent with studies by Parasuraman et al., (1985) and Yunus, Ismail, Juga and Ishak (2009). The finding has confirmed service quality research literature mostly published in Western countries.
With respect to practical contribution, the findings of this study can be used as a guideline by management to improve the service quality program in their organizations. Specifically, the design and management of service quality may be improved if managers emphasize on the finding of this study.
This study confirms that price is an important contributor in customer satisfaction in Pakistan. Service organizations in Pakistan should not only consider improving customer satisfaction but also target on improving the customer perceptions of overall service quality and should increase consumer perceived value. Moreover, convincing customers that they are getting high value from the firm should be a key advertising objective of the firm. Customers are watchful of the costs of obtaining the service, and costs material in relation to satisfaction. In competitive environments, managers should not only focus on service quality which is just one side of the satisfaction equation, but also carefully assess price rivalry as it will be reflected in customers’ evaluation of perceived value. They should be alerted to the fact that there might be tradeoffs required between increasing quality and increasing prices.
8. Conclusion
This study revealed that customer satisfaction is significantly related with perceived service quality and perceived value. As the gap between perception and expectation is negative we can concluded that customer has more expectation than then they actual received. If management wants to enhance customers’ satisfaction evaluations, it would be more beneficial to influencing customers’ perceptions of the service performance than altering their expectations. Perceived value was found strongly correlated with satisfaction. This study confirms that perceive value does act as a partial mediating role in the relationship between service quality and customer satisfaction. In terms of explanatory power, the addition of perceived value in Step 2 had explained 37.5 percent of the variance in dependent variable instead of previously 9.4 percent variance in step 1. Statistically, these results showed that after the addition of perceived value in the analysis, the strength of relationship between perceived service quality and customer satisfaction has increased, indicating that perceive value does act as a partial mediating variable in the relationship between perceived service quality and customer satisfaction. 9. Limitations
variables in consumers’ judgments of perceived value. Another important limitation is that service expectation and service perception is measured at the same time which may mislead the respondent.
References
Agus, A. Barker, S., & Kandampully, J. (2007). An exploratory study of service Quality in the Malaysian public service sector. International Journal of Quality & Reliability Management, Vol. 24 No. 2, pp. 177-190. http://dx.doi.org/10.1108/02656710710722284
Al-Hawari, M., & Ward, T. (2006). The effect of automated service quality on Australian banks’ financial performance and the mediating role of customer satisfaction. Marketing Intelligence & Planning, Vol. 24 No. 2, pp. 127-147. http://dx.doi.org/10.1108/02634500610653991
Anderson, E.W., & Fornell, C. (2000). Foundations of the American Customer Satisfaction Index. Total Quality Management, Vol. 11, No. 7, S869± S882.
Baron, R.M., & Kenny, D.A. (1986). This moderator-mediator variable distinction in social psychological research: Conceptual, strategic and statistical considerations. Journal of Personality and Social Psychological,
51, 1173-1182. http://dx.doi.org/10.1037/0022-3514.51.6.1173
Churchill, G.A., & Surprenant, C. (1982). an Investigation in to the determinants of Customer Satisfaction.
Journal of Marketing Research, Vol. XIX, 491-504. http://dx.doi.org/10.2307/3151722
Dagger, T.S., & Sweeney, J .C. (2007). Service Quality Attribute Weights How Do Novice and Longer-Term Customers Construct Service Quality Perceptions? Journal of Service Research, Volume 10, No. 1, August 2007 22-42. http://dx.doi.org/10.1177/1094670507303010
Dodds, W.B., Monroe, K.B., & Grewal, D. (1991). Effects of price, brand, and store information on buyers’ product evaluations. Journal of Marketing Research, 28(3), 307-319. http://dx.doi.org/10.2307/3172866
Edvardsson, B., Johnson, M.D., Gustafsson, A., & Strandvik, T. (2000). The effects of satisfaction and loyalty on Products and growth: products versus services. Total Quality Management, Vol. 11, No. 7, S917± S927. Eklof, J.A., & Westlund, A.H. (2002). The pan-European customer satisfaction index programme-current work and the way ahead. Total Quality Management, Vol. 13, No. 8, 1099-1, 106.
Fornell, C., Johnson, M.D., Anderson, E. W, Jaesung Cha, & Bryant, B. E. (1996). The American Customer Satisfaction Index: Nature, Purpose, and Findings. Journal of Marketing, Vol. 60 (October 1996), 7-18. http://dx.doi.org/10.2307/1251898
Frank, B., & Enkawa, T. (2007). How Economic Growth Affects Customer Satisfaction: A Study from Germany. Proceedings of the 13th Asia Pacific Management Conference, Melbourne, Australia, 115-120.
Gilbert, G. R., & Veloutsou, C. (2006). A cross-industry comparison of customer Satisfaction. Journal of Services Marketing, 20/5, 298–308. http://dx.doi.org/10.1108/08876040610679918
Hamer, L.O. (2006). A confirmation perspective on perceived Service quality. Journal of Services Marketing, 20/4 (2006), 219–232. http://dx.doi.org/10.1108/08876040610674571
Hennig-Thurau, Thorsten (2004). Customer-Orientation of Service Employees: It’s Impact on Customer Satisfaction, Commitment, and Retention. International Journal of Service Industry Management, Vol. 15, No. 5, pp. 460-478. http://dx.doi.org/10.1108/0956423041056493
Iglesias, M.P., & Yagu¨e Guille´n, M.J. (2004). Perceived quality and price: their impact on the satisfaction of restaurant customers. International Journal of Contemporary Hospitality Management, Volume 16, Number 6, pp. 373-379. http://dx.doi.org/10.1108/09596110410550824
Jaiswal, A.K. (2008). Customer satisfaction and service quality measurement in Indian call centers. Managing Service Quality, Vol. 18, No. 4, 2008, pp. 405-416. http://dx.doi.org/10.1108/09604520810885635
Jiang, Y., & Wang, C.L. (2006). The impact of affect on service quality and satisfaction: the moderation of service contexts. Journal of Services Marketing, 20/4, 211–218. http://dx.doi.org/10.1108/08876040610674562 Ladhari, R., & Morales, M. (2008). Perceived service quality, perceived value and Recommendation a study among Canadian public library users. Library Management, Vol. 29, No. 4/5, pp. 352-366. http://dx.doi.org/10.1108/01435120810869129
Journal of an Emerging Trans discipline, Volume 12. [Online] Available: http://inform.nu/Articles/Vol12/ISJv12p017-035Landrum232.pdf
Lenka, U., Suar, D., & Mohapatra, P. K. (2009). Service Quality, Customer Satisfaction, and Customer Loyalty in Indian Commercial Banks. The Journal of Entrepreneurship, 18, 1, 47–64. http://dx.doi.org/10.1177/097135570801800103
Matzler, K., Wurtele, A., & Renzl, B. (2006). Dimensions of price satisfaction: a study in the retail banking industry. International Journal of Bank Marketing, Vol. 24, No. 4, pp. 216-231. http://dx.doi.org/10.1108/02652320610671324
Moliner, M.A., Sa´nchez, J., Rodrı´guez, R. M., & Callarisa, L. (2007). Perceived relationship quality and post-purchase perceived value: An integrative framework. European Journal of Marketing, Vol. 41, No. 11/12, pp. 1392-1422. http://dx.doi.org/10.1108/03090560710821233
Mont. O., & Plepys, A. (2003). Customer satisfaction: review of literature and application to the product-service systems. Final report to the Society for Non-Traditional Technology, Japan. [Online] Available: http://agroinfo.dyndns.org/inside/template/1587_customersatisfaction1.pdf
Omachonu, V., Johnson, W.C., & Onyeaso, G. (2008). An empirical test of the drivers of overall customer satisfaction: evidence from multivariate Granger causality. Journal of Services Marketing, 22/6, 434–444. http://dx.doi.org/10.1108/08876040810901855
Parasuraman, A., Zeithaml, V, A., & Berry, L.L. (1988). SERVQUAL: A Multiple-Item Scale for Measuring Consumer Perceptions of Service Quality. Journal of Retailing, Volume 64, Number 1. http://dx.doi.org/10.1016/S0148-2963(99)00084-3
Reimann, M., Lünemann, U. F., & Chase, R.B. (2008). Uncertainty Avoidance as a Moderator of the Relationship between Perceived Service Quality and Customer Satisfaction. Journal of Service Research, Volume 11, Number 1, August, 63-73. http://dx.doi.org/10.1177/1094670508319093
Szymanski, D.M., & Henard, D.H. (2001). Customer Satisfaction: A Meta-Analysis of the Empirical Evidence.
Journal of the Academy of Marketing Science, Volume 29, No. 1, pages 16-35.
http://dx.doi.org/10.1177/009207030102900102
Takala, J., Bhufhai, A., & Phusavat, K. (2006). Proposed verification method for the content suitability of the customer satisfaction survey. Industrial Management & Data.
Turel, O., & Serenko, A. (2004). User Satisfaction with Mobile Services in Canada. Proceedings of the Third International Conference on Mobile Business, M-Business.
Ueltschy, L., Laroche, M., Eggert, A., & Bindl, U. (2007). Service quality and satisfaction: an international comparison of professional Services perceptions. Journal of Services Marketing, 21/6 410–423. http://dx.doi.org/10.1108/08876040710818903
Yoo, D. K, & Park J.A. (2007). Perceived service quality analyzing relationships among employees, customers, and financial performance. International Journal of Quality & Reliability Management, Vol. 24, No. 9, pp. 908-926. http://dx.doi.org/10.1108/02656710710826180
Yunus, N.K.Y, Ismail, A., Juga, Z.R., and Ishak, S. (2009). Service quality dimensions, perceive value and customer satisfaction: ABC relationship model testing. IBEJ, Vol.2, Issue 1, 1-18.
Table 1. Results of validity and reliability analysis
Measures Items KMO Bartlett's Test of Sphericity
Cronbach’s Alpha
Service Expectation 21 0.806 3614.391 0.746 Service Perception 21 0.819 3532.36 0.689 Perceive Value 5 0.838 595.458 0.843 Customer
Satisfaction
Table 2. Demographic characteristics of respondents
Gender Frequency Percent Average monthly
income Frequency Percent Male 227 75.7 Below Rs.10,000 39 13.0 Female 73 24.3 Rs.10,000-20,000 176 58.7
[image:10.595.128.440.233.381.2]Total 300 100.0 Rs.30,000-40,000 51 17.0 Married 93 31.0 Rs.50,000-100,000 23 7.7 Single 205 68.3 Above Rs.100,000 8 2.7
Table 3. Correlation between variables and descriptive statistics
Variable Mean Standard Deviation
Component
Pearson Correlation
1 2 3
Customer Satisfaction
4.2758 1.44099 1.000
Perceived Service Quality
-.3311 .64823 .306*** 1.000
Perceived Value 4.3407 1.33201 .565*** .127 1.000 Note: Significant level at ***p<0.001 Reliability estimation are shown diagonally
Table 4. Results for stepwise regression analysis
Variables Dependent Variable (Customer Satisfaction) Model 1 Model 2 Independent Variable
Perceived Service Quality 0.306*** 0.239*** Mediating Variable
Perceive Value 0.534***
R Square .094 .375
Adjusted R Square .091 .371
F 30.896*** 89.032***
R Square Change .094 .281
F Change 30.896*** 130.437*** Note: value significant at ***p<0.001
Independent Variable Mediating Variable Dependent Variable
Figure 1. Theoretical frame work
[image:10.595.135.431.427.601.2] [image:10.595.57.476.628.693.2]