Influence of Cr
3+
Ion on the Dielectric Properties of Nano
Crystalline Mg-Ferrites Synthesized by Citrate-Gel
Method
M. Raghasudha1, D. Ravinder2*, P. Veerasomaiah3
1Department of Chemistry, Jayaprakash Narayan College of Engineering, Mahabubnagar, India; 2Department of Physics, Nizam College, Basheerbagh Osmania University, Hyderabad, India; 3Department of Chemistry, Osmania University, Hyderabad, India. Email: *[email protected]
Received May 17th, 2013; revised June 18th, 2013; accepted June 27th, 2013
Copyright © 2013 M. Raghasudha et al. This is an open access article distributed under the Creative Commons Attribution License, which permits unrestricted use, distribution, and reproduction in any medium, provided the original work is properly cited.
ABSTRACT
Mixed Mg-Cr Nano ferrites having the compositional formula MgCrxFe2−xO4 (where x = 0.0, 0.1, 0.3, 0.5, 0.7, 0.9 and
1.0) were synthesized using Citrate-Gel auto combustion method. Structural characterization was carried out by XRD Analysis which confirmed the formation of single phase cubic spinel structure without any impurity peak. The dielectric properties such as Dielectric constant (ε'), Dielectric Loss tangent (tan δ) and AC conductivity (σAC) of Mg-Cr nano fer-
rites were studied at room temperature in the frequency range of 2 Hz - 2 MHz using Agilent E4980A Precision LCR meter.The dielectric constant, loss tangent and AC conductivity shows a normal behavior with frequency. A qulitative explanation is given for composition and frequency dependance of the dielectric constant, dielectric loss tangent and AC conductivity of the nano ferrite. The loss tangent for the synthesized samples was found to be decreased from 0.09 to 0.054 in higher frequency region showing the potential applications of these materials in high frequency micro wave devices. On the basis of these results the explanation of dielectric mechanism in Mg-Cr ferrites is suggested.
Keywords: Dielectric Constant; Dielectric Loss Tangent; Mg-Cr Nano Ferrites; LCR Meter
1. Introduction
Nano ferrites have many applications in high frequency devices and they play a useful role in technological ap- plications. One important characteristic of ferrites is their high values of resistivity, low magnetic and dielectric losses [1] which make them ideal for high frequency ap- plications. Owing to the dielectric behavior, they are some- times called multiferroics. They are commercially impor- tant because they can be used in, many devices such as Phase Shifter, high frequency transformer cores, switches, resonators, computers, TVs and mobile phones [2,3]. Die- lectric properties of ferrites are dependent upon several factors, including method of preparation, chemical com- position and grain size [4,5]. Since MgFe2O4 and related
ferrites are widely used components in micro wave family due to their high electrical resistivity, low magnetic and dielectric losses [6,7] we investigated the dielectric be- havior of these ferrites over wide range of frequencies at room temperature. In this study, we prepared nano sized
MgCrxFe2−xO4 compounds containing different levels of
Cr with the assumption that dielectric properties would be improved by substitution of Fe3+ ions with Cr3+ ions. Sub-
stitution of Magnesium Ferrites with Cr3+ ions at B site
should be effective in enhancing the electrical resistivity. In the present work the aim of Cr3+ ion substitution for
Fe3+ ions is to reduce dielectric loss. In this article we
report the influence of Cr substitution on structural and dielectric properties of MgCrxFe2−xO4 ferrites synthesized
by Citrate-gel auto combustion method as a function of frequency and composition at room temperature.
2. Experimental
2.1. Synthesis of Mg-Cr Ferrites
Ferrites with chemical formula MgCrxFe2−xO4 (x = 0.0,
0.1, 0.3, 0.5, 0.7, 0.9 and 1.0) have been prepared by the Citrate-gel auto combustion method using high purity AR grade of Magnesium Nitrate—(Mg(NO3)26H2O), Ferric
Nitrate—(Fe(NO3)29H2O), Chromium Nitrate—
(Cr(NO3)29H2O), Citric acid—(C6H8O7·H2O), Ammonia
—(NH3) as starting materials for the synthesis. Required
quantities of metal nitrates were dissolved in a minimum quantity of distilled water and mixed together. Aqueous solution of Citric acid was then added to the mixed metal nitrate solution. Ammonia solution was then added with constant stirring to maintain PH of the solution at 7. The
resulting solution was continuously heated on the hot plate at 100˚C up to dryness with continuous stirring. A viscous gel has resulted. Increasing the temperature up to 200˚C lead the ignition of gel. The dried gel burnt com- pletely in a self propagating combustion manner to form a loose powder. The burnt powder was ground in Agate Mortor and Pistle to get a fine Ferrite powder. Finally the burnt powder was calcined in air at 500˚C temperature for four hours and cooled to room temperature.
2.2. Characterization
The structural characterization of powders was carried out by X-Ray Diffractometer to analyze the phase and crystallite size. For dielectric measurements the powders were added with a small amount 2% PVA as a binder to press the powders into circular pellets of diameter 13mm and thickness 1 mm applying a pressure of 5 tons. The prepared pellets were sintered at 500˚C for four hours in air in muffle furnace for the densification of the sample. For dielectric measurements silver paint was applied on both sides of the pellets and air dried to have good ohmic contact. The dielectric measurements were made using Agilent E4980A Precision LCR meter at room tempera- ture in the frequency range 20 Hz to 2 MHz.
Using LCR meter the dielectric parameters such as Ca- pacitance of the pellet, tan δ (loss tangent) and Capaci- tance of air with the same thickness as the pellet were measured.
The real part of the dielectric constant (ε') was deter- mined from the following formula [8]
Air p
C C
where ε' = Real part of dielectric constant; Cp = Capaci-
tance of the Pellet in Faraday; CAir = Capacitance of Air
in Faraday.
The imaginary part of the dielectric constant (ε") or dielectric loss was measured by using the following rela- tion [9]
tan
The Ac conductivity was calculated using the values of frequency (f) and loss tangent factor as [9]
0
2π tan
AC f
where ε0= Constant permittivity of free space = 8.854 ×
10−12 F/m; ε' = Real part of dielectric constant; tan δ =
loss tangent.
3. Results and Discussion
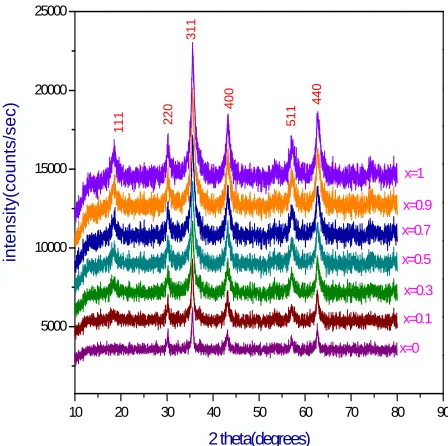
3.1. Structural CharacterizationThe structural characterization of all the nano-ferrites was carried out by X-ray Diffraction. From the analysis the 2 theta and intensity data were used and graphs were plotted as shown in Figure 1. From the X-ray diffraction pattern, crystalline phases were identified by comparison with reference data from the ICSD card No. 71-1232 for Magnesium ferrites. All Bragg reflections have been in- dexed which confirms the formation of a well defined single phase cubic spinel structure without any impurity peak. The strongest reflection comes from (311) plane that indicates spinel phase. The XRD patterns of all the Chromium substituted Magnesium ferrites showed the homogeneous single phased cubic spinel belonging to the space group Fd3m (confirmed by ICSD Ref 71-1232).
The crystallite size (D) was calculated for all the com- positions using high intensity peak (311) from Scherrer’s formula [10] and was in the range of 7 to 23 nm.
Lattice parameter (a) of the individual composition was calculated by using the following formula
2 2 2
a d h k l
where a = lattice parameter; d = interplanar spacing; hkl
= the miller indices.
The lattice parameter was found to decrease linearly with increase of Cr3+ ions in the Mg-Cr nano-ferrites
system indicating that the system obeys Vegard’s law [11].
10 20 30 40 50 60 70 80 90
5000 10000 15000 20000 25000
x=1
x=0.9
x=0.7
x=0.5
x=0.3
x=0.1
x=0
440
511
400
311
220
111
inte
n
s
it
y
(co
un
ts/se
c
)
[image:2.595.310.534.483.706.2]2 theta(degrees)
3.2. Dielectric Properties
3.2.1. Dielectric Constant (ε' and ε")
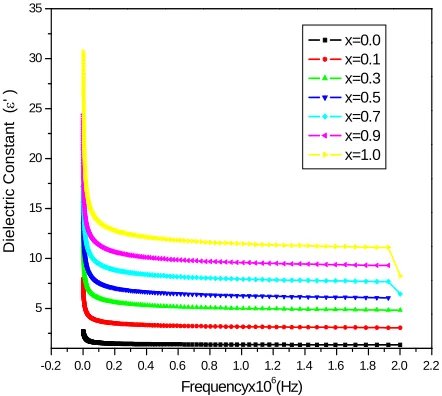
The frequency dependence of the real and imaginary part of dielectric constant (ε' and ε") for all the samples was studied at room temperature in the range of 20 Hz to 2 MHz. Figures 2 and 3 depict the variation of the real and imaginary part of the dielectric constant (ε' and ε") as a function of frequency for mixed ferrites
MgCrxFe2−xO4 with different compositions (x = 0.0, 0.1,
0.3, 0.5, 0.7, 0.9 and 1.0). It is observed that all the sam- ples have higher dielectric constant at lower frequency 20 Hz and there is a decreasing trend in value with increasing frequency from 1000 Hz to 2 MHz which is a normal behavior of ferromagnetic materials. The decrease in ε' is sharp initially from 20 Hz to 1000 Hz (lower frequency) and then ε' value decreases slowly with the increase in frequency and showed almost frequency independent be- havior at high frequency regions [12]. Similar behavior was observed in our publications on Mg-Zn Ferrites (Ra- vinder and Latha, 1999), Li-Cd ferrites (Radha and Rav-inder, 1995). This normal dielectric behavior of spinel ferrites was attributed to the lagging of existing charge carriers (hopping electrons) between Fe2+ and Fe3+ ions
at localized sites, where the Fe2+ ions were formed in the
samples during the sintering process at high temperature, responsible for polarization behind the applied field as its frequency increases [13,14]. The data revealed that none of the samples exhibit any anomalous behavior of peak- ing. The variation of dielectric constant with frequency may be explained on the basis of space-charge polariza- tion phenomenon [15]. According to this, dielectric ma- terial has well conducting grains separated by highly re- sistive grain boundaries. On the application of electric field, space charge accumulates at the grain boundaries
-0.2 0.0 0.2 0.4 0.6 0.8 1.0 1.2 1.4 1.6 1.8 2.0 2.2 5
10 15 20 25 30 35
Dielec
tr
ic
Cons
tan
t
(
' )
Frequencyx106(Hz)
[image:3.595.310.538.511.708.2]x=0.0 x=0.1 x=0.3 x=0.5 x=0.7 x=0.9 x=1.0
Figure 2. Variation of real part of dielectric constant ε' with frequency.
and voltage drops mainly at grain boundaries [16]. Koops proposed that grain boundary effect is more at low fre- quencies [16]. As the frequency increased beyond a cer- tain limit the electron exchange between Fe2+ and Fe3+
ions does not follow the variations in applied field, so the value of dielectric constant becomes constant. According to Maxwell and Wagner [17,18] two layer model, space- charge polarization is because of the inhomogeneous die- lectric structure of the material. It is formed by large well conducting grains separated by thin poorly conducting intermediate grain boundaries. Rabinkin and Novikova [19] pointed out that polarization in ferrites is similar to that of conduction. The electron exchange between Fe2+
and Fe3+ ions results in local displacement of electrons in
the direction of applied field that determines polarization. Polarization decreases with increasing value of frequency, and then reaches a constant value. It is due to the fact that beyond a certain frequency of external field, the electron exchange Fe2+↔ Fe3+ cannot follow the alternating field.
The high value of dielectric constant at lower frequency is due to the predominance of the species like Fe2+ ions,
oxygen vacancies, grain boundary defects, etc. [18] while the decrease in dielectric constant with frequency is na- tural that is any species contributing to the polarizability is found to show the applied field lagging behind at higher frequencies [20].
3.2.2. Loss Tangent (tan δ)
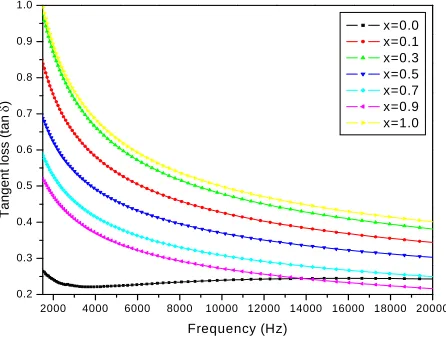
The value of tan δ measures the loss of electrical energy from the applied electric field into the samples at different frequencies. It is observed that the tan δ shows a de- creasing trend with increasing in frequency. The loss tangent (tan δ) is defined as the ratio of the loss or resistive current to the charging current in sample. Also it is known that there is strong correlation, between the conduction
0.0 0.5 1.0 1.5 2.0
0 5 10 15 20 25 30
x=0.0 x=0.1 x=0.3 x=0.5 x=0.7 x=0.9 x=1.0
Di
el
ec
v
tri
c con
s
ta
nt
(
")
[image:3.595.61.282.512.710.2]frequency X 10 6(Hz)
mechanism and the dielectric constant behavior (Polari- zation mechanism) in ferrites. Variation of tan δ (the loss tangent) as a function of frequency (20 Hz to 2 MHz) at room temperature for all compositions is shown in Figure 4. The tan δ decreases with the increasing frequency which is normal behavior of any ferrite materials. The values of dielectric loss tangent decrease from 0.09 (x = 0.1) to 0.054 (x = 0.9) at 2 MHz. This shows that with increase in Cr concentration the energy losses decrease at high frequencies. The low loss values at higher frequen- cies show the potential applications of these materials in high frequency micro wave devices. From the figure it is clear that the loss decreases rapidly in the low frequency region while the rate of decrease is slow in high-frequency region and it shows an almost frequency independent behavior in high frequency region. The behavior can be explained on the basis that in the low frequency region, which corresponds to a high resistivity (due to the grain boundary), more energy is required for electron exchange between Fe2+ and Fe3+ ions, as a result the loss is high. In
the high frequency region, which corresponds to a low resistivity (due to the grains), small energy is required for electron transfer between the two Fe ions at the octahe- dral site. Moreover, the dielectric loss factor also de- pends on a number of factors such as stoichiometry, Fe2+
content, and structural homogeneity which in turn de- pend upon the composition and sintering temperature of the samples [21].
3.2.3. AC Conductivity (σAC)
Conductivity is the physical property of a material which characterizes the conducting power inside the material. The electrical conductivity in ferrites is mainly due to the hopping of electrons between the ions of the same element presented in more than one valence state. Figure 5 shows the variation of the AC conductivity (σAC) of mixed Mg-
Cr ferrites of all compositions as a function of frequency
2000 4000 6000 8000 10000 12000 14000 16000 18000 20000 0.2
0.3 0.4 0.5 0.6 0.7 0.8 0.9 1.0
Tangen
t los
s
(
tan
)
Frequency (Hz)
x=0.0 x=0.1 x=0.3 x=0.5 x=0.7 x=0.9 x=1.0
[image:4.595.316.530.540.716.2]
Figure 4. Variation of dielectric loss tangent (tan δ) with frequency.
in the range of 20 Hz to 2 MHz at room temperature. At low frequency range the AC conductivity was nearly independent of the frequency and showed an increasing trend with increase in frequency for all the samples. This behavior is akin to Maxwell-Wagner type. The dielectric structure of ferrites is given by Koops phenominologics theory and Maxwell-Wagner theory [18,22]. At lower fre- quencies the conductivity was found low due to the grain boundaries that are more active which acts as hindrance for mobility of charge carriers and hence the hopping of Fe2+ and Fe3+ ions is less at lower frequencies. As the
frequency of applied field is increased, the conductive grains become more active thereby promoting the hopping between Fe2+ and Fe3+ ions and also responsible for cre-
ating charge carriers from different centers. These charge carriers take part in the conduction phenomenon thereby increasing the AC conductivity. The linear increase in conductivity was observed with frequency that confirms the polaron type of conduction. The frequency dependent conduction is attributed to small polarons [23]. At higher frequency where conductivity increases greatly with fre- quency, the transport is dominated by contributions from hopping infinite clusters.
3.2.4. Compositional Dependence of Dielectric Parameters (ε', ε", tan δ and σAC)
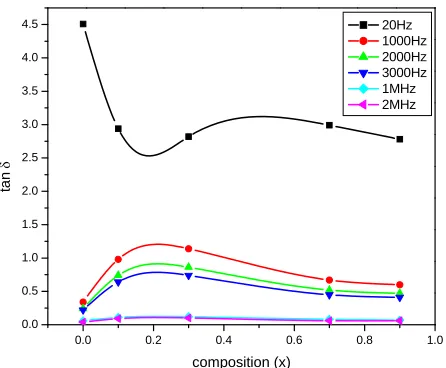
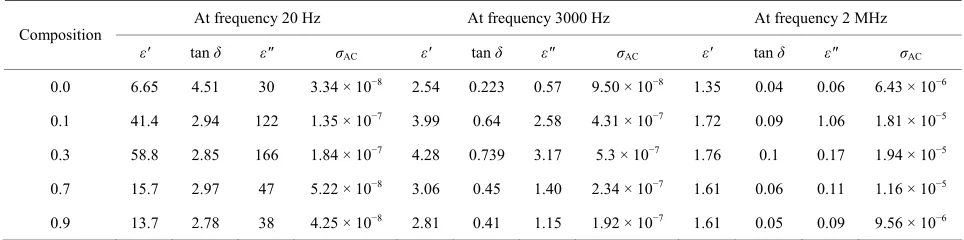
Figures 6-9 represent the variation of dielectric parame- ters (ε', ε", tan δ and σAC) as a function of Cr composition
at selected frequencies (20 Hz, 1000 Hz, 2000 Hz, 3000 Hz, 1 MHz and 2 MHz) respectively. It can be seen that all the dielectric parameters ε', ε", tan δ and σAC increase
upto 10% of Cr doping, thereafter, these parameters de- crease with further doping of Cr which is clear from Ta- ble 1. It shows the values of dielectric parameters for dif- ferent compositions of the Mg-Cr ferrite system at par- ticular frequencies. The initial increase in dielectric cons- tant up to x = 0.3 may be due to the formation of Fe3+
1 2 3 4 5 6
0 20 40 60 80 100
7
x=0.0 x=0.1 x=0.3 x=0.5 x=0.7 x=0.9 x=1.0
AC co
nd
uc
tiv
ity
x
10
6 (oh
m
.m
)
-1
Log F (Hz)
[image:4.595.61.284.542.711.2]
0.0 0.2 0.4 0.6 0.8 1 0
10 20 30 40 50 60
.0
Dielect
ric
Cons
ta
nt
(
')
Composition (x)
[image:5.595.313.535.85.265.2]20Hz 1000Hz 2000Hz 3000Hz 1MHz 2MHz
Figure 6. Variation of ε' with composition at selected fre- quencies.
0.0 0.2 0.4 0.6 0.8 1.0
-20 0 20 40 60 80 100 120 140 160 180
Dielectric Loss
(
")
Composition (x)
20Hz 1000Hz 2000Hz 3000Hz 1MHz 2MHz
Figure 7. Variation of ε" with composition at selected fre- quencies.
0.0 0.2 0.4 0.6 0.8 1.0
0.0 0.5 1.0 1.5 2.0 2.5 3.0 3.5 4.0 4.5
ta
n
composition (x)
[image:5.595.63.286.85.266.2]20Hz 1000Hz 2000Hz 3000Hz 1MHz 2MHz
Figure 8. Variation of tan δ with composition at selected Frequencies.
0.0 0.2 0.4 0.6 0.8 1.0
0.000000 0.000005 0.000010 0.000015 0.000020
AC conductiv
ity
Composition(x)
[image:5.595.60.286.306.488.2]1000Hz 2000Hz 3000hz 1MHz 2MHz
Figure 9. Variation of σAC with composition at selected fre- quencies.
ions on octahedral sites. This typical behavior can be ex- plained on the basis that in Cr containing ferrites, Cr ions prefer to occupy the octahedral coordination until the ratio of Cr substitution becomes greater than 60%, where- after, Cr ions may increase in tetrahedral sites causing migration of equal number ions to the octahedral sites [24]. The behavior can be explained by assuming that the mechanism of dielectric polarization is similar to that of the conduction in ferrites (Robinkin and Novikova, 1960). They observed that the electronic exchange interaction between Fe2+↔Fe3+ results in local displacement of the
electrons in the direction of an electric field which de- termines the polarization of ferrites. The presence of Fe2+
ions in excess amount favors the polarization effect [25]. Thus more dispersion was observed in the sample with low Cr3+ ion substitution. This is because at low Cr3+
concentration the presence of Fe2+ ions is in excess
amount. As the Cr3+ ion substitution increased it occupies
the octahedral site in the ferrite system, thereby decreas- ing the number of Fe3+ ions and there is a least possibility
of electronic exchange interaction between Fe2+↔Fe3+,
which results in decrease in dielectric parameters with in- creasing Cr content in the present system. Table 1 shows the values of dielectric parameters for different composi- tions of the Mg-Cr ferrite system at selected frequencies.
4. Conclusions
We have successfully synthesized single phase
MgCrxFe2−xO4 nano ferrites with cubic spinel structure
through Citrate-gel auto combustion method with very fine crystallite size of the particles ranging from 7 - 23 nm.
[image:5.595.62.285.525.709.2]Table 1. Dielectric parameters of different compositions of MgCrxFe2−xO4 at selected frequencies (20 Hz, 3000 Hz and 2 MHz).
At frequency 20 Hz At frequency 3000 Hz At frequency 2 MHz Composition
ε' tan δ ε" σAC ε' tan δ ε" σAC ε' tan δ ε" σAC
0.0 6.65 4.51 30 3.34 × 10⁻⁸ 2.54 0.223 0.57 9.50 × 10⁻⁸ 1.35 0.04 0.06 6.43 × 10⁻⁶
0.1 41.4 2.94 122 1.35 × 10⁻⁷ 3.99 0.64 2.58 4.31 × 10⁻⁷ 1.72 0.09 1.06 1.81 × 10⁻⁵
0.3 58.8 2.85 166 1.84 × 10⁻⁷ 4.28 0.739 3.17 5.3 × 10⁻⁷ 1.76 0.1 0.17 1.94 × 10⁻⁵
0.7 15.7 2.97 47 5.22 × 10⁻⁸ 3.06 0.45 1.40 2.34 × 10⁻⁷ 1.61 0.06 0.11 1.16 × 10⁻⁵
0.9 13.7 2.78 38 4.25 × 10⁻⁸ 2.81 0.41 1.15 1.92 × 10⁻⁷ 1.61 0.05 0.09 9.56 × 10⁻⁶
A normal dispersion in dielectric parameters (ε', ε", tan δ) with frequency was observed for all samples and this has been explained on the basis of space charge polarization mechanism as discussed in Maxwell- Wagner model.
AC conductivity measurement indicates that with in- crease in Cr3+ substitution Mg-Cr nano ferrites, AC
conductivity increases linearly with frequency which suggest that the conduction in the present system may be due to the polaron hopping mechanism.
The values of dielectric loss tangent decrease from 0.09 (x = 0.1) to 0.054 (x = 1.0) at 2 MHz. This shows that with increase in Cr concentration in Mg-Cr nano ferrites the energy losses decrease at high frequencies. The low loss values at higher frequencies show the potential applications of these materials in high fre- quency micro wave devices.
5. Acknowledgements
One of the authors (MRS) is grateful to K. S. Ravikumar, Chairman, Jayaprakash Narayan College of Engineering, Mahabunagar (Dist) for his support and continuous en- couragement in carrying out research work. One of the authors (D.R) is grateful to Prof. T. L. N. Swamy, Prin- cipal Nizam College for his encouragement to carry out this research work. The authors are thankful to Prof. C. Gyana Kumari, Head, Department of Chemistry, Osma- nia University, Hyderbad for her encouragement in car- rying out the research activities.
REFERENCES
[1] Y. Yamamoto and J. Makino, “Core Losses and Magnetic Properties of Mn-Zn Ferrites with Fine Grain Sizes,”
Journal of Magnetism and Magnetic Materials, Vol. 133, No. 1-3, 1994, pp. 500-503.
doi.10.1016/0304-8853(94)90607-6.
[2] J. Smit and H. P. G. Wijn, “Ferrites,” John and Wiley & Sons, Inc., Hoboken, 1959, p. 136.
[3] M. Sugimoto, “The Past, Present, and Future of Ferrites,”
Journal of Ceramic American Society, Vol. 82, No. 2,
1999, p. 269.
[4] K. Kondo, T. Chiba and S. Yamada, “Effect of Micro- structure on Magnetic Properties of Ni-Zn Ferrites,” Jour- nal of Magnetism and Magnetic Materials, Vol. 541, 2003, p. 254.
[5] M. P. Reddy, G. Balakrishnaiah, W. Madhuri, M. Ven- kata Ramana, N. Rammanohar Reddy, K. V. Siva Kumar, V. R. K. Murthy and R. Ramakrishna Reddy, “Structural, Magnetic and Electrical Properties of NiCuZn Ferrites Prepared by Microwave Sintering Method Suitable for MLCI Applications,” Journal of Physis and Chemistry of Solids, Vol. 71, 2010, p. 1373.
[6] L. B. Kong, Z. W. Li, G. Q. Lin and Y. B. Gan, “Mag- neto-Dielectric Properties of Mg-Cu-Co Ferrite Ceramics: II. Electrical, Dielectric, and Magnetic Properties,” Jour- nal of American Ceramic Society, Vol. 90, 2007, p. 2014. doi:10.1111/j.1551-2916.2007.01691.x
[7] Y. Konseoglu, H. Kavas and B. Aktas, “Surface Effects on Magnetic Properties of Superparamagnetic Magnetite Nanoparticles,” Physics Status Solidi A, Vol. 203, 2006, p. 1595. doi:10.1002/pssa.200563104
[8] S. L. Gupta and S. Gupta, “Electricity, Magnetism and Electronics,” Vol. 1, Jaiprakash Nath and Company, 1991, p. 60.
[9] E. Pervaiz and I. H. Gul, “Enhancement of Electrical Properties Due to Cr+3 Substitution in Co-Ferrite Nano Particles Synthesized by Two Chemical Techniques,”
Journal of Magnetism and Magnetic Materials, Vol. 324, No. 22, 2012, pp. 3695-3703.
doi.10.1016/j.jmmm.2012.05.050
[10] B. D. Cullity, “Elements of XRD,” Addison Weseley Pub- lishing, Redading, 1959, p. 132.
[11] M. J. Iqbal, M. N. Ashiq, P. Hernandez-Gomezb and J. M. Munoz, “Synthesis, Physical, Magnetic and Electrical Pro- perties of Al-Ga Substituted Co-Precipitated Nanocrystal- line Strontium Hexaferrite,” Journal of Magnetism and Magnetic Materials, Vol. 320, 2007, No. 6, pp. 881-886. doi.10.1016/j.jmmm.2007.09.005
[12] B. Chandra Babu, V. Naresh, B. Jayaprakash and S. Bud- dhudu, “Structural, Thermal and Dielectric Properties of Lithium Zinc Silicate Ceramic Powders by Sol-Gel Me- thod,” Ferro Electrics Letter, Vol. 38, 2011, p. 124. [13] S. Sindhu, M. R. Antharaman, B. P. Thampi, K. A. Ma-
Properties of Rubber Ferrite Composites Containing Mixed Ferrites,” Bulletin Materials Science, Vol. 24, 2001, pp. 623-629. doi.10.1007/BF02704011
[14] A. A. Zaky and R. Hawley, “Dielectric Solids,” Rout- ledge and Kegan Paul Ltd., London, 1990, p. 21
[15] N. Rezlescu and E. Rezlescu, Physics Status Solidi A, Vol. 23, 1974, p. 575
[16] I. H. Gul, A. Maqsood, M. Naeem and M. Naeem Ashiq, “Optical, Magnetic and Electrical Investigation of Cobalt Ferrite Nanoparticles Synthesized by Co-Precipitation Route,” Journal of Alloys and Compounds, Vol. 507, No. 1, 2010, pp. 201-206. doi.10.1016/j.jallcom.2010.07.155 [17] J. C. Maxwell, “Electricity and Magnetism,” Vol. 1, Ox-
ford University Press, Oxford, 1929.
[18] K. W. Wagner, “Zur Theorie der Unvolkommenen Di- Elektrika,” American Physics, American Physics, Vol. 40, 1913, p. 817.
[19] I. T. Rabinkin and Z. I. Novikova, “Ferrites,” IZV Acad. Nauk USSR Minsk, 1960.
[20] B. Baruwati, K. M. Reddy, V. Sunkara, R. K. Manorama, O. Singh and J. Prakash, “Tailored Conductivity Behavior
in Nanocrystalline Nickel Ferrite,” Applied Physics Let- ters, Vol. 85, No. 14, 2004. doi.10.1063/1.1801685 [21] R. S. Devan and B. K. Chougule, “Effect of Composition
on Coupled Electric Magnetic and Dielectric Properties of Two Phase Particulate Magnetoelectric Composite,” Jour- nal of Applied Physics, Vol. 101, No. 1, 2007, Article ID: 014109
[22] C. G. Koops, Physics Revision, “On the Dispersion of Resistivity and Dielectric Constant of Some Semiconduc- tors at Audiofrequencies,” Vol. 83, No. 1, 1951, pp. 121- 124. doi.10.1103/PhysRev.83.121
[23] D. Alder and J. Fienleib, “Electrical and Optical Proper- ties of Narrow-Band Materials,” Physics Revision B, Vol. 2, 1970, p. 3112. doi.10.1103/PhysRevB.2.3112
[24] D. Elkony, “Egypt,” Journal of Solids, Vol. 27, No. 2, 2004, p. 285.
[25] S. E. Shirsath, B. G. Toksh, M. K. L. Mane, V. N. Dhage, D. R. Shengule and K. M. Jadhav, “Frequency, Tempera- ture and In+3 Dependent Electrical Conduction in NiFe