0095-1137/06/$08.00⫹0 doi:10.1128/JCM.02596-05
Copyright © 2006, American Society for Microbiology. All Rights Reserved.
Multilocus Sequence Typing Scheme for
Enterococcus faecalis
Reveals
Hospital-Adapted Genetic Complexes in a Background of
High Rates of Recombination
Patricia Ruiz-Garbajosa,
1* Marc J. M. Bonten,
2,3D. Ashley Robinson,
4Janetta Top,
2,3Sreedhar R. Nallapareddy,
5Carmen Torres,
6Teresa M. Coque,
1Rafael Canto
´n,
1Fernando Baquero,
1Barbara E. Murray,
5Rosa del Campo,
1and Rob J. L. Willems
2,3Servicio de Microbiologı´a, Hospital Universitario Ramo´n y Cajal, Madrid, Spain1; Eijkman-Winkler Institute for Microbiology,
Infectious Diseases and Inflammation,2and Division of Acute Internal Medicine and Infectious Diseases,3University Medical
Center Utrecht, Utrecht, The Netherlands; Department of Microbiology and Immunology, New York Medical College,
Valhalla, New York4; Center for the Study of Emerging and Reemerging Pathogens, University of Texas, Houston,
Texas5; and Departamento de Agricultura y Alimentacio´n, Universidad de La Rioja, Logron˜o, Spain6
Received 14 December 2005/Returned for modification 1 February 2006/Accepted 28 March 2006
A multilocus sequence typing (MLST) scheme based on seven housekeeping genes was used to investigate the epidemiology and population structure ofEnterococcus faecalis. MLST of 110 isolates from different sources and geographic locations revealed 55 different sequence types that grouped into four major clonal complexes (CC2, CC9, CC10, and CC21) by use of eBURST. Two of these clonal complexes, CC2 and CC9, are particularly fit in the hospital environment, as CC2 includes the previously described BVE clonal complex identified by an alternative MLST scheme and CC9 includes exclusively isolates from hospitalized patients. Identical alleles were found in genetically diverse isolates with no linkage disequilibrium, while the different MLST loci gave incongruent phylogenetic trees. This demonstrates that recombination is an important mechanism driving genetic variation inE. faecalisand suggests an epidemic population structure forE.faecalis. Our novel MLST scheme provides an excellent tool for investigating local and short-term epidemiology as well as global epidemiology, population structure, and genetic evolution ofE.faecalis.
Although classically considered a commensal of the gastro-intestinal tracts of humans and animals rather than a special-ized human pathogen, enterococci have become extremely rel-evant in hospital-acquired infections. Their ability to acquire specific genetic traits, such as virulence and antibiotic resis-tance determinants that could increase their fitness in such a complex ecosystem, has been recognized (18). The paradigm of this evolutionary development is the emergence and spread of vancomycin-resistant enterococci (VRE) (20).
Among enterococcal species,Enterococcus faecalisis respon-sible for most human infections in both community and hos-pital settings. Though resistance to vancomycin and penicillins is very rare,E. faecalisseems to harbor a broader repertoire of potential virulence traits thanE. faecium(34). However, little is known about the relationship between the population struc-ture and global epidemiology ofE. faecalis. Different molecu-lar typing methods have been developed to analyzeE.faecalis
epidemiology (3, 11, 19, 36, 37, 40). Pulsed-field gel electro-phoresis (PFGE) is considered a practical “gold standard” due to its high discriminatory abilities (3, 37), but the most impor-tant limitation of PFGE is its low interlaboratory reproducibil-ity and its unsuitabilreproducibil-ity for both global and long-term epide-miology studies or for phylogenetic or population structure studies.
For many different bacterial species, the most appropriate
technique for global and long-term epidemiology studies is multilocus sequence typing (MLST) (38). MLST provides an unambiguous nomenclature for genotypes, and clones and data are easily stored in databases that can be exchanged between different laboratories via the Internet (1). ForE. faecium, the development of an MLST scheme has been critical in the understanding of global epidemiology, genetic evolution, and population structure (14, 41). A previous MLST scheme based on three highly variable antigen-encoding genes (salA,ace, and
efaA) and six housekeeping genes was used to study a collec-tion of 21E. faecalisisolates involved in outbreaks or harbor-ing unusual antibiotic resistances (22).
In the present work, we describe a novel MLST scheme for
E. faecalisbased on seven housekeeping genes that is used to
study a large collection (110 strains) ofE. faecalisisolates from different sources and geographic areas. Our results indicate that this scheme can be proposed as a new and reliable reference typing scheme, as it allows short-term and long-term epidemiological studies ofE. faecalis and its popula-tion biology.
(Part of this work has been presented at the 44th Inter-science Conference on Antimicrobial Agents and Chemother-apy, 2004 [Washington, D.C.], and at the Second International American Society for Microbiology-Federation of European Microbiological Societies Conference on Enterococci, 2005 [Helsingør, Denmark].)
MATERIALS AND METHODS
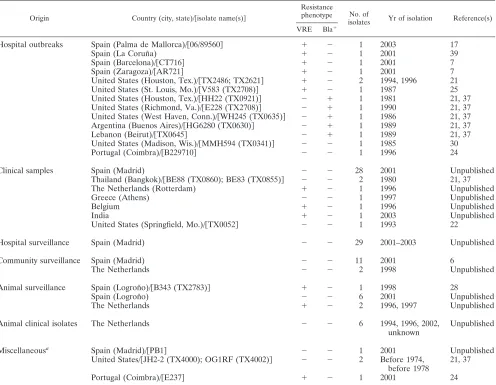
Bacterial isolates and species identification.A total of 110E. faecalisisolates from different host origins and geographic locations were selected (Table 1). To
* Corresponding author. Mailing address: Servicio de Microbiologı´a, Hospital Universitario Ramo´n y Cajal, Ctra. de Colmenar Km 9.100, Madrid 28034, Spain. Phone: 913368330. Fax: 913368809. E-mail: pruizg [email protected].
2220
on May 16, 2020 by guest
http://jcm.asm.org/
compare the discriminatory powers of MLST and PFGE, we selected a set of 40 of the total isolates originating from both blood cultures (28) and fecal samples (12). Species identification ofE. faecaliswas performed by PCR using primers specific for both theD-alanine ligase (ddl) gene and theefaAgene (3).
MLST scheme.Initially, internal fragments from 12 housekeeping genes were amplified and sequenced. Based on PCR and sequencing robustness, low ratios of nonsynonymous to synonymous mutations, and a high Simpson’s index of diversity (D) of the individual loci and of the combinations of the seven genes, a final combination of the following seven genes with dispersed locations on the chromosome (minimal distance between loci, 137 kb) was selected:gdh (glucose-6-phosphate dehydrogenase),gyd(glyceraldehyde-3-phosphate dehydrogenase),
pstS(phosphate ATP binding cassette transporter),gki(putative glucokinase),
aroE(shikimate 5-dehydrogenase),xpt(shikimate 5-dehydrogenase), andyiqL
(acetyl-coenzyme A acetyltransferase) (Table 2).
Internal fragments from the final set of seven genes were amplified by PCR with the following sets of primers:gdh-1, GGCGCACTAAAAGATATGGT, andgdh-2, CCAAGATTGGGCAACTTCGTCCCA;gyd-1, CAAACTGCTTAG CTCCAATGGC, andgyd-2, CATTTCGTTGTCATACCAAGC;pstS-1, CGGA ACAGGACTTTCGC, andpstS-2, ATTTACATCACGTTCTACTTGC;gki-1, GATTTTGTGGGAATTGGTATGG, andgki-2, ACCATTAAAGCAAAATG ATCGC;aroE-1, TGGAAAACTTTACGGAGACAGC, andaroE-2, GTCCTG TCCATTGTTCAAAAGC; xpt-1, AAAATGATGGCCGTGTATTAGG, and
xpt-2, AACGTCACCGTTCCTTCACTTA; andyqiL-1, CAGCTTAAGTCAAG TAAGTGCCG, andyqiL-2, GAATATCCCTTCTGCTTGTGCT.
PCR conditions for all amplification reactions were as follows: initial
[image:2.585.46.542.81.466.2]dena-turation at 94°C for 5 min; 30 cycles at 94°C for 30 s, 52°C for 30 s, and 72°C for 1 min; and final extension at 72°C for 7 min. Reactions were performed in 25-l volumes usingTaqpolymerase SphaeroQ (Leiden, The Netherlands). PCR prod-ucts were purified with a kit from QIAGEN, Inc. (Hilden, Germany), and sequenced with PCR forward and reverse primers, an ABI PRISM Big Dye cycle sequencing ready reaction kit (Perkin-Elmer, Applied Biosystems, Foster City, Calif.), and an ABI 3700 DNA sequencer (Perkin-Elmer).
TABLE 1. Molecular characteristics of theE. faecalisisolates included in this work
Origin Country (city, state)/关isolate name(s)兴
Resistance
phenotype No. of
isolates Yr of isolation Reference(s) VRE Bla⫹
Hospital outbreaks Spain (Palma de Mallorca)/关06/89560兴 ⫹ ⫺ 1 2003 17
Spain (La Corun˜a) ⫹ ⫺ 1 2001 39
Spain (Barcelona)/关CT716兴 ⫹ ⫺ 1 2001 7
Spain (Zaragoza)/关AR721兴 ⫹ ⫺ 1 2001 7
United States (Houston, Tex.)/关TX2486; TX2621兴 ⫹ ⫺ 2 1994, 1996 21 United States (St. Louis, Mo.)/关V583 (TX2708)兴 ⫹ ⫺ 1 1987 25 United States (Houston, Tex.)/关HH22 (TX0921)兴 ⫺ ⫹ 1 1981 21, 37 United States (Richmond, Va.)/关E228 (TX2708)兴 ⫺ ⫹ 1 1990 21, 37 United States (West Haven, Conn.)/关WH245 (TX0635)兴 ⫺ ⫹ 1 1986 21, 37 Argentina (Buenos Aires)/关HG6280 (TX0630)兴 ⫺ ⫹ 1 1989 21, 37
Lebanon (Beirut)/关TX0645兴 ⫺ ⫹ 1 1989 21, 37
United States (Madison, Wis.)/关MMH594 (TX0341)兴 ⫺ ⫺ 1 1985 30
Portugal (Coimbra)/关B229710兴 ⫺ ⫺ 1 1996 24
Clinical samples Spain (Madrid) ⫺ ⫺ 28 2001 Unpublished
Thailand (Bangkok)/关BE88 (TX0860); BE83 (TX0855)兴 ⫺ ⫺ 2 1980 21, 37
The Netherlands (Rotterdam) ⫹ ⫺ 1 1996 Unpublished
Greece (Athens) ⫺ ⫺ 1 1997 Unpublished
Belgium ⫹ ⫺ 1 1996 Unpublished
India ⫹ ⫺ 1 2003 Unpublished
United States (Springfield, Mo.)/关TX0052兴 ⫺ ⫺ 1 1993 22
Hospital surveillance Spain (Madrid) ⫺ ⫺ 29 2001–2003 Unpublished
Community surveillance Spain (Madrid) ⫺ ⫺ 11 2001 6
The Netherlands ⫺ ⫺ 2 1998 Unpublished
Animal surveillance Spain (Logron˜o)/关B343 (TX2783)兴 ⫹ ⫺ 1 1998 28
Spain (Logron˜o) ⫺ ⫺ 6 2001 Unpublished
The Netherlands ⫹ ⫺ 2 1996, 1997 Unpublished
Animal clinical isolates The Netherlands ⫺ ⫺ 6 1994, 1996, 2002,
unknown
Unpublished
Miscellaneousa Spain (Madrid)/关PB1兴 ⫺ ⫺ 1 2001 Unpublished
United States/关JH2-2 (TX4000); OG1RF (TX4002)兴 ⫺ ⫺ 2 Before 1974, before 1978
21, 37
Portugal (Coimbra)/关E237兴 ⫹ ⫺ 1 2001 24
a
Isolates from sewage and laboratory strains. No data are available for isolate JH2-2 (TX4000).
TABLE 2. Genetic diversity found inE. faecalisMLST loci
Gene
(locus)a Fragment size (bp)
No. of alleles
Simpson’s index of diversity (D)
dn/ds ratiob
No. of variable
sites % Variable
sites
gdh(ef1004) 530 21 0.917 0 15 2.8
gyd(ef1964) 395 9 0.793 0 8 2
pstS(ef1705) 583 24 0.923 0.56 22 3.8
gki(ef2788) 438 24 0.905 0.02 21 4.8
aroE(ef1561) 459 21 0.861 0 14 3
xpt(ef2365) 456 17 0.800 0.01 13 2.8
yqiL(ef1364) 436 16 0.873 0 19 4.3
aThe genomic locus identifier is indicated in parentheses. bdn/d
sratio, ratio of nonsynonymous to synonymous mutations.
on May 16, 2020 by guest
http://jcm.asm.org/
[image:2.585.301.543.607.707.2]Allele and sequence type assignment.For each locus, a distinct allele number was assigned to every different sequence, in accordance with theE. faecalis
MLST database (http://efaecalis.mlst.net/). Allelic profile or sequence type (ST) was assigned in the ordergdh,gyd,pstS,gki,aroE,xpt, andyqiLto a total of seven integers corresponding to the allele numbers at the seven loci. STs were assigned to isolates in such a way that the same ST names were kept as much as possible for the same strains analyzed by this and the previously published scheme (22). Computer analysis of MLST data.The relatedness between the different STs was investigated using BioNumerics software (version 4.0; Applied Maths, Sint-Martens-Latem, Belgium) by the unweighted-pair group method with arithmetic averages (UPGMA) and the categorical coefficient of similarity. Clusters of related STs differing in not more than in two of the seven loci that were thought to be descendants from a common ancestor were grouped into clonal complexes (CCs) by using eBURST (http://www.mlst.net) (9). Predicted founders of a CC were STs with the highest numbers of single-locus variants. A singleton was defined as an ST that is not grouped into a CC, and a singleton clone was defined as a singleton represented by more than one isolate. The allelic profiles were also clustered by using a categorical coefficient and the minimum spanning tree module within the BioNumerics software package (Applied Maths) (29). As with eBURST, the minimum spanning tree was used to infer patterns of evolutionary descent under the principle of parsimony, where identical alleles in different genotypes are thought to have evolved from a common ancestor instead of by convergent evolution.
Ratios of nonsynonymous to synonymous nucleotide substitutions were calcu-lated using START (http://www.mlst.net). The MEGA program (version 2.1; http://www.megasoftware.net) (16) was used to calculate the number of variable nucleotide sites. The index of association (Ia) (32) was used to measure the linkage disequilibrium between alleles at the seven housekeeping genes with the program available at the MLST website (http://www.mlst.net). TheIawas defined as the observed variance (Vobs) in the distribution of allelic mismatches in all pairwise comparisons of the allelic profiles divided by the expected variance in a freely recombining population minus one. The significance ofIawas estimated by comparing theVobsobtained from the actual data with the maximum variance (Vmax) calculated from 1,000 data sets under the assumption of the random association of loci. Significant linkage disequilibrium was established if theVobs obtained with the actual data set was greater than theVmaxwith any of the 1,000 randomized data sets; otherwise, there was no evidence of a departure from linkage equilibrium.
Pulsed-field gel electrophoresis.Chromosomal DNA was prepared as previ-ously described (37) and digested with SmaI. Electrophoresis was carried out with a contour-clamped homogeneous electric field DR-II apparatus (Bio-Rad, La Jolla, Calif.) with a 1.2% agarose gel with 0.5⫻Tris-borate-EDTA, and the following settings were applied: 1 to 35 s, 6 V/cm2, and 24 h. Results were interpreted according to the criteria proposed by Tenover et al. (35).
Simpson’s index of diversity and confidence interval.To compare the discrim-inatory powers of PFGE and MLST, Simpson’s index of diversity (D) with 95% confidence intervals (95% CI) was calculated for a set of 40 strains (12, 15). AD
value close to 0 indicated that there was little diversity as shown by the typing method, whereas aDvalue close to 1 indicated a high diversity as shown by the typing method (15).
Statistical analysis. Statistically significant association between hospital or community-derived origin of isolates and genetic clustering was calculated by the chi-square test (Epi-Info, version 6; Centers for Disease Control and Prevention, Atlanta, GA). APvalue of⬍0.05 was considered to be statistically significant. Gene tree congruence analysis.To assess the impact of recombination on the population structure ofE. faecalisin more detail, the topologies of the seven MLST gene trees were compared using the Shimodaira-Hasegawa (SH) test (31). Briefly, a set of distantly related isolates was obtained by selecting presumed founders of CCs and all singletons. A total of 33 isolates was selected and used in the SH test. Maximum-likelihood (ML) trees for each MLST gene of the 33
isolates were obtained under a general time-reversible model, with a proportion of invariant sites and rate heterogeneity among sites assuming a discrete gamma distribution with eight categories (the GTR⫹I⫹G model). PAUP*4.0b10 was used to obtain the ML trees by using a neighbor-joining starting tree followed by tree bisection reconnection branch swapping (33). For a given gene, the SH test compares the difference in log likelihoods of competing tree topologies. A null distribution of differences in log likelihoods was obtained by 1,000 replicates of
[image:3.585.301.542.90.521.2]FIG. 1. Dendrogram showing the relatedness among the 55 STs ofE.faecalisby use of UPGMA from the matrix of pairwise differences in the allelic profiles. The following data are included: ST; numbers of isolates with the same ST; host origin (HO, isolate from a hospital outbreak; HC, clinical sample from a hospitalized human; HF, fecal sample from a hospitalized human; CF, fecal sample from a healthy volunteer; AS, fecal sample from a healthy animal; AC, clinical sample from an animal; M, miscellaneous group, which included isolates from sewage, laboratory strains, and unknown origin); resistance (BLA⫹, beta-lactamase-producing isolate); numbers of isolates with indicated allelic profiles; and countries of origin (ARG, Argentina; BEL, Belgium; GRC, Greece; IND, India; LEB, Lebanon; NLD, The Netherlands; POR, Portugal; SP, Spain; THA, Thailand; USA, United States). Numbers in the columns under the spanner “Host origin” represent numbers of isolates. Numbers in the columns under the spanner “Resistance” represent numbers of isolates with indicated resistance patterns; letters in the same columns represent host origin abbreviations.
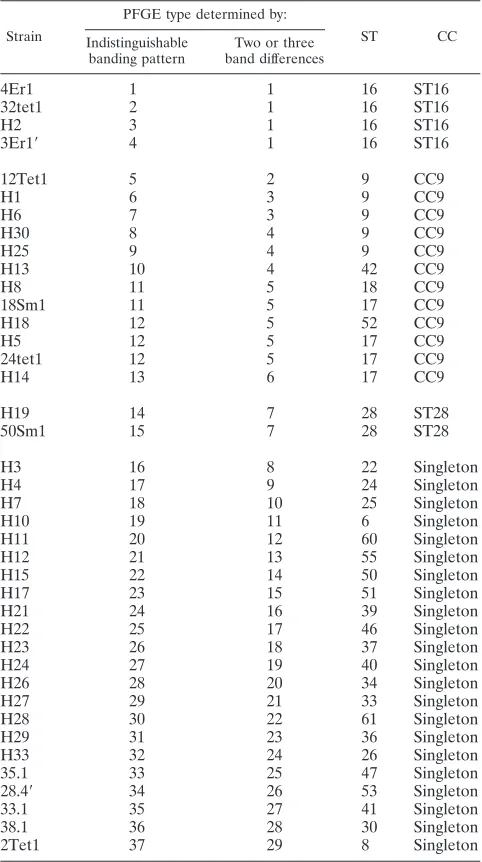
TABLE 3. Comparison between MLST STs and PFGE types of a set of 40 strains
Strain
PFGE type determined by:
ST CC
Indistinguishable banding pattern
Two or three band differences
4Er1 1 1 16 ST16
32tet1 2 1 16 ST16
H2 3 1 16 ST16
3Er1⬘ 4 1 16 ST16
12Tet1 5 2 9 CC9
H1 6 3 9 CC9
H6 7 3 9 CC9
H30 8 4 9 CC9
H25 9 4 9 CC9
H13 10 4 42 CC9
H8 11 5 18 CC9
18Sm1 11 5 17 CC9
H18 12 5 52 CC9
H5 12 5 17 CC9
24tet1 12 5 17 CC9
H14 13 6 17 CC9
H19 14 7 28 ST28
50Sm1 15 7 28 ST28
H3 16 8 22 Singleton
H4 17 9 24 Singleton
H7 18 10 25 Singleton
H10 19 11 6 Singleton
H11 20 12 60 Singleton
H12 21 13 55 Singleton
H15 22 14 50 Singleton
H17 23 15 51 Singleton
H21 24 16 39 Singleton
H22 25 17 46 Singleton
H23 26 18 37 Singleton
H24 27 19 40 Singleton
H26 28 20 34 Singleton
H27 29 21 33 Singleton
H28 30 22 61 Singleton
H29 31 23 36 Singleton
H33 32 24 26 Singleton
35.1 33 25 47 Singleton
28.4⬘ 34 26 53 Singleton
33.1 35 27 41 Singleton
38.1 36 28 30 Singleton
2Tet1 37 29 8 Singleton
on May 16, 2020 by guest
http://jcm.asm.org/
on May 16, 2020 by guest
http://jcm.asm.org/
nonparametric bootstrapping of reestimated log likelihoods. We conducted 107 SH tests for each MLST gene, comparing the 7 MLST gene trees and 100 random trees separately generated for each of the MLST genes. In a clonal population, different genes have similar tree topologies and fit other gene trees better than they fit random trees. With recombination, different genes may have different tree topologies and may fit random trees better than they fit other gene trees.
RESULTS
Allelic variation in E. faecalis. Among the 110 isolates in-vestigated, the numbers of different alleles ranged from 8 (gyd) to 24 (gki and pstS) (Table 2). Similarly, the proportions of variable sites present in the selected housekeeping genes var-ied from 2% (gyd) to 4.8% (gki). Most polymorphisms resulted in synonymous substitutions, and the low ratios of nonsynony-mous to synonynonsynony-mous substitutions indicated a very limited role for diversifying selection on these loci (Table 2).
Discriminatory ability of MLST compared to PFGE. The Simpson’s index of diversity (D) with 95% CI was determined
to compare the discriminatory powers of PFGE and MLST with a set of 40 isolates typed by both methods (Table 3). Both PFGE and MLST techniques distinguished 29 different geno-types when the PFGE criteria used to define closely related isolates were differences in two to three bands, as previously published (35). The ability of PFGE to discriminate clones (D⫽ 97.3%; 95% CI, 95 to 99.7%) was similar to that of MLST (D⫽97.1%; 95% CI, 94.5 to 99.6%) since the 95% CI values overlapped. If PFGE data were analyzed on the basis of indistinguishable banding patterns, 37 different PFGE patterns were obtained, with a slightly higher discriminatory power of 99.4 (95% CI, 98.6 to 100%). This difference was not statisti-cally significant since 95% CIs overlapped.
[image:5.585.55.533.68.457.2]Good correlation was obtained between MLST and PFGE results; however, a perfect match between both techniques was not always observed. In total, 7.5% of the strains with indis-tinguishable PFGE patterns had different STs, while 5% of the strains with identical STs showed different PFGE patterns.
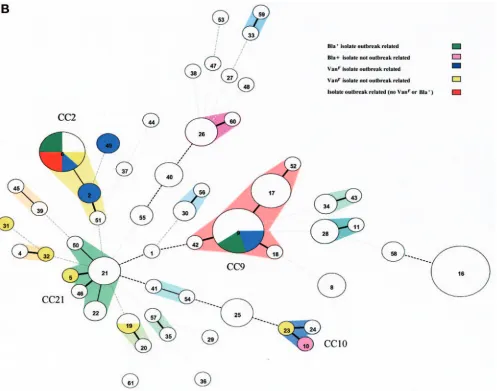
FIG. 2. Clustering of 55 STs by use of the minimum spanning tree. Colors indicate isolation sources (A) or resistance phenotypes (B). Each circle represents an ST, and the type number is indicated in the circle. The area of each circle corresponds to the number of isolates. Thick, short, solid lines connect single-locus variants, thin, longer, solid lines connect double-locus variants, black dotted lines connect STs which differ in three loci, and gray dotted lines connect STs that differ in more than three loci. Pie charts indicate ST distribution. Clonal complexes are indicated.
on May 16, 2020 by guest
http://jcm.asm.org/
Relatedness of E. faecalis isolates. The 110 isolates were resolved into 55 STs, of which 37 were represented by a single isolate. The types most frequently found were ST16 (13 iso-lates), ST9 (10 isoiso-lates), ST6 (8 isoiso-lates), ST17 (6 isoiso-lates), ST26 (4 isolates), and ST21 (4 isolates). The UPGMA method was used to construct a dendrogram from the matrix of pair-wise allelic differences between the 55 STs of all 110 isolates (Fig. 1), showing a highly divergent population. eBURST was used to divide the isolates into clonal complexes, and in addi-tion a minimum spanning tree based on allelic profiles was constructed. Both eBURST (data not shown) and the mini-mum spanning tree (Fig. 2) resolved the 55 STs into four major clonal complexes, 10 minor clonal complexes, and 19 single-tons not belonging to CCs. The four major CCs were desig-nated CC9 (19 isolates), CC21 (9 isolates), CC2 (11 isolates), and CC10 (3 isolates). Only in CC9 and CC21 could a founder ST be assigned. Seven out of 19 singleton STs were repre-sented by more than one isolate and could be assigned single-ton clones, ST16 (13 isolates) being the largest.
Epidemiology of clonal complexes.In general, host specific-ity was not observed among the different bacterial lineages,
[image:6.585.46.543.68.459.2]since human and animal isolates that originated in distant regions were uniformly distributed among the clonal com-plexes (Fig. 2A). ST16 is a remarkable example of spread in different compartments, with 13 isolates from Spain and The Netherlands, including isolates from clinical infections (1) and intestinal colonization of hospital patients (6) or healthy vol-unteers (3), as well as animal isolates (3). Despite this apparent lack of strict host specificity, the fact that 30/89 (34%) isolates colonizing or infecting hospitalized patients from four coun-tries in different continents and only 2/33 (6%) non-hospital-derived isolates (P⫽0.002) grouped in CC2 and CC9 suggests that CC2 and CC9 can be considered hospital-adapted com-plexes which have spread worldwide. Moreover, all (except one) of the hospital outbreak isolates, which were VRE (in-cluding the sequencedE. faecalisV583 strain) and vancomy-cin-susceptible enterococci, were confined to these complexes. VRE in general were found in multiple genetic backgrounds (ST5, ST19, ST23, ST31, and ST32), illustrating the impor-tance of horizontal transfer of glycopeptide resisimpor-tance (Fig. 2B). Beta-lactamase-producing (Bla⫹) isolates were recovered from five separate outbreaks; two of them, E228 (TX0614) and
FIG. 2—Continued.
on May 16, 2020 by guest
http://jcm.asm.org/
HH22 (TX0921), corresponded to CC2, previously designated the BVE complex (22), while HG6280 (TX0630) and WH425 (TX0635) corresponded to CC9, previously designated the ACB clone (Fig. 2B) (22). One Bla⫹ isolate (TX0645) was classified as ST10 and clustered in CC10 together with a fecal isolate from a calf and a human clinical isolate.
Although high-level resistance to gentamicin was found in isolates from different epidemiological sources, it was most frequently detected among hospital isolates belonging to CC9 and the singleton clone ST16.
Influence of recombination on the population structure ofE.
faecalis.To assess whether genetic diversity inE. faecaliswas
caused primarily by mutation or recombination, associations between alleles at different loci were quantified by calculating theIa(32). Clonal populations, where mutations predominate
in generating genetic variation, show significant associations (linkage disequilibrium) between alleles at different loci. Non-clonal populations, where recombination predominates, show low degrees of association between alleles at different loci. Significant linkage disequilibrium was detected when the entire strain set (110 isolates) or the STs (55 STs) were included in the analysis (Ia⫽2.54,Vobs⫽2.87, andVmax⫽0.84 andIa⫽
1.05,Vobs⫽1.23, andVmax⫽0.81, respectively). However, this
entire strain set includes closely related STs within CCs that might have diversified clonally over the short term. When the
Iawas calculated for 33 more distantly related STs (1 ST from
each complex and all singletons), there was no evidence for linkage disequilibrium (Ia ⫽0.42,Vobs ⫽0.64,Vmax ⫽0.92).
Visual inspection of the MLST allelic profiles revealed that for each locus identical alleles were distributed among distantly related isolates.
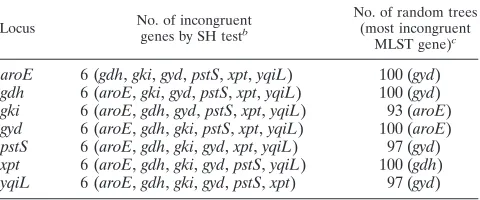
Additionally, the extent of congruence between the topolo-gies of the seven different MLST gene trees was determined. If rates of recombination are low, the topologies of the trees are similar, while the different gene trees show no significant con-gruence with high rates of recombination. Thirty-three strains, one from each complex and all singletons, were included in this analysis. The results indicated that all 42 pairwise comparisons of the seven MLST loci were incongruent (Table 4). Further-more, in almost all cases, the random tree was a better fit to the gene of investigation than to the most incongruent MLST gene. We conclude that a high rate of recombination in
E. faecalishas diminished the phylogenetic signal in the
house-keeping gene trees.
DISCUSSION
A new reference typing scheme forE.faecalis, which allows the study of local hospital outbreaks as well as long-term epi-demiology and global comparisons of isolates, is provided. This new MLST scheme differs from other recently publishedE.
faecalisMLST schemes (21, 22) by including seven
housekeep-ing genes instead of six, no virulence genes, and more loci (three instead of one) in common with theE. faeciumMLST scheme. For thegdhgene, a slightly different region was chosen in this scheme compared to the previous MLST schemes to match thegdhlocus of theE.faeciumMLST scheme (14). The seven selected housekeeping genes showed a high degree of resolution, and none of the loci were under diversifying selec-tive pressure, as demonstrated by the low ratios of
nonsynony-mous to synonynonsynony-mous mutations. This new MLST scheme al-lows both evolutionary and population structure analyses and also enables the study of E. faecalis-E. faecium interspecies recombination. It is true that the incorporation of virulence genes, as described in the previousE. faecalisMLST schemes (21, 22), may improve epidemiological resolution. Neverthe-less, selection on these genes may also obscure patterns of evolutionary descent in phylogenetic studies. Furthermore, adding rapidly evolving genes, like virulence genes, identi-fying microvariation may lead to a scheme that is too dis-criminatory for long-term and global epidemiology, since it may reduce the capability of grouping isolates with common features (e.g., hospital-adapted clones) from different time pe-riods and continents in common globally distributed lineages. Therefore, we have chosen to include only metabolic house-keeping genes representing the core genome in this new MLST scheme.
The discriminatory abilities of MLST and PFGE were sta-tistically similar in this study, although as reported for other bacterial species, there was not a perfect correlation between PFGE and MLST (8, 23, 26).
The application of the MLST scheme proposed in this work also has provided the first insight into the population structure
ofE. faecalis. Extensive MLST studies of the closely related
enterococcal speciesE. faeciumrevealed clustering of isolates into distinct host-specific lineages and identified a distinct ge-netic subpopulation, designated CC17, containing the vast ma-jority of hospital outbreaks and clinical isolates that have spread globally during the last two decades (41). In contrast,E.
faecalisobtained from different epidemiological sources
[image:7.585.302.542.91.191.2](hos-pitalized patients, community, and animals) frequently shared identical STs and grouped together in common complexes. Despite this alleged random dispersion of human clinical, sur-veillance, and animal isolates, two of the major complexes (CC2 and CC9) contained almost exclusively hospital-derived isolates, suggesting they were well adapted to persist in the hospital environment. Indeed, the previously published BVE clone (22), corresponding to CC2, included clinically important
TABLE 4. Log likelihood for ML trees for each reference loci and for this tree as a fit to the data from the other locia
Locus No. of incongruent
genes by SH testb
No. of random trees (most incongruent
MLST gene)c
aroE 6 (gdh,gki,gyd,pstS,xpt,yqiL) 100 (gyd)
gdh 6 (aroE,gki,gyd,pstS,xpt,yqiL) 100 (gyd)
gki 6 (aroE,gdh,gyd,pstS,xpt,yqiL) 93 (aroE)
gyd 6 (aroE,gdh,gki,pstS,xpt,yqiL) 100 (aroE)
pstS 6 (aroE,gdh,gki,gyd,xpt,yqiL) 97 (gyd)
xpt 6 (aroE,gdh,gki,gyd,pstS,yqiL) 100 (gdh)
yqiL 6 (aroE,gdh,gki,gyd,pstS,xpt) 97 (gyd)
aML trees are based on the GTR⫹I⫹G model (see text). The statistical
method tests the degree of congruence between the seven housekeeping gene trees by comparing the likelihood of the ML trees for each gene with those of the ML topologies of the other genes and 100 randomly generated trees.
bNumber of incongruent genes at the level ofPof⬍0.05, based on an SH test of tree topologies. The incongruent genes are given in parentheses.
cNumber of random tree topologies out of 100 random trees that are a better
fit to the gene than the tree from the most incongruent MLST gene. Fit is expressed as the number of random trees with log likelihood values closer to the log likelihood value of the reference gene than to the value of the most incon-gruent MLST gene.
on May 16, 2020 by guest
http://jcm.asm.org/
E. faecalis isolates such as V583 (25), MMH594, or the first known Bla⫹isolate (HH22) (21, 30). Also, the ACB clonal complex (22), equivalent to CC9, underscored the widespread distribution of these hospital-adapted CCs. Previous molecular typing of otherE. faecalisisolates by using amplified fragment length polymorphism also suggested the existence of hospital-adapted genetic complexes (40).
Progression towards hospital adaptation is probably a multi-step cumulative process where a particular genotype acquires resistance and virulence colonization determinants, dependent on the availability of adaptive mechanisms in the local gene pool. This results in an enhancement of fitness in the hospital environment, increasing the likelihood of persistence and thus further allowing acquisition of more-adaptive mechanisms. These processes of adaptation require highly efficient mecha-nisms for genetic exchange and may lead to a nonclonal pop-ulation structure. Nonclonality inE. faecaliswas demonstrated by the complete absence of congruence between housekeeping loci and was further illustrated by the fact that ML trees based on the seven MLST housekeeping genes were no more similar to each other than they were to trees of random topology. This demonstrates that inE. faecalisfrequent horizontal DNA ex-change has eliminated the phylogenetic signal in each house-keeping gene. Nonclonal populations also show weak associa-tions between alleles at different loci or even total linkage equilibrium. Despite the suggested high levels of recombina-tion inE. faecalis, linkage disequilibrium was found when the entire strain set was analyzed. Such observations are not un-common in recombining populations because the sample of bacterial isolates often includes many closely related geno-types. The linkage disequilibrium that is detected in these samples is temporary and restricted to these closely related genotypes. InE. faecalis, the emergence and diversification of the adaptive clones CC2 and CC9 have led to departure from linkage equilibrium. No linkage disequilibrium was found when a subset of isolates was analyzed without including mul-tiple isolates from within CCs. This phenomenon is character-istic of an epidemic population structure (10, 13).
In E. faecalis, a large variety of conjugative plasmids and
conjugative transposons are involved in genetic transfer of resistance and virulence determinants, which might also facil-itate hospital adaptation in CC2 and CC9 (2). Studies of trans-ferable elements that carry the vanB vancomycin resistance gene have suggested genetic exchange of chromosomal frag-ments up to 90 to 250 kb that could include housekeeping genes (4, 5, 27). While large-sized fragments can be exchanged through composite conjugative transposons, natural transfor-mation of E. faecalis cannot be excluded, although, to our knowledge, it has never been documented. The genome se-quence of E. faecalis harbors at least eight genes encoding putative competence proteins (25). The mechanisms of genetic exchange involved in these high rates of recombination inE.
faecalisremain to be determined.
The first data resulting from the application of MLST to explore the population structure ofE.faecalisreveal an epi-demic structure where recombination plays an important role and two major hospital-adapted CCs have emerged. However, more studies are needed to improve our understanding of the population biology and the mechanisms involved in horizontal genetic transfer and recombination in E. faecalis. With this
MLST scheme, comparison of population structures of differ-ent differ-enterococcal species is becoming a reachable objective that should provide new insight into the evolutionary history of this important group of bacteria.
ACKNOWLEDGMENTS
This work was supported by Red Tema´tica de Investigacio´n REIPI from the Spanish Ministry of Health (C03/14) and by University Med-ical Center Utrecht, Utrecht, The Netherlands. P. Ruiz-Garbajosa was the recipient of a Post-Formacio´n Sanitaria Especializada Contract from the Spanish Ministry of Health and a research grant from SEIMC (Sociedad Espan˜ola de Enfermedades Infecciosas y Microbiologı´a Clı´nica).
This publication made use of the Multi Locus Sequence Typing website (http://www.mlst.net) at Imperial College, London, United Kingdom, developed by Man-Suen Chan and David Aanensen and funded by the Wellcome Trust. Finally, we thank A. Oliver, G. Bou, W. Gaastra, and L. Peixe for providing us withE. faecalisstrains.
REFERENCES
1.Aanensen, D. M., and B. G. Spratt.2005. The multilocus sequence typing network: mlst.net. Nucleic Acids Res.33:W728–W733.
2.Clewell, D. B., and G. M. Dunny.2002. Conjugation and genetic exchange in enterococci, p. 265–300.InM. S. Gilmore, D. B. Clewell, P. Courvalin, G. M. Dunny, B. E. Murray, and L. B. Rice (ed.), The enterococci: pathogenesis, molecular biology, and antibiotic resistance. ASM Press, Washington, D.C. 3.Coque, T. M., P. Seetulsingh, K. V. Singh, and B. E. Murray.1998. Appli-cation of molecular techniques to the study of nosocomial infections caused by enterococci, p. 469–493.InN. Woodford and A. Johnson (ed.), Methods in molecular medicine, vol. 15. Molecular bacteriology: protocols and clinical applications. Humana Press, Totowa, N.J.
4.Dahl, K. H., E. W. Lundblad, T. P. Rokenes, O. Olsvik, and A. Sundsfjord. 2000. Genetic linkage of thevanB2 gene cluster toTn5382 in vancomycin-resistant enterococci and characterization of two novel insertion sequences. Microbiology146:1469–1479.
5.Dahl, K. H., and A. Sundsfjord.2003. TransferablevanB2 Tn5382-containing elements in fecal streptococcal strains from veal calves. Antimicrob. Agents Chemother.47:2579–2583.
6.del Campo, R., P. Ruiz-Garbajosa, M. P. Sanchez-Moreno, F. Baquero, C. Torres, R. Canto´n, and T. M. Coque.2003. Antimicrobial resistance in recent fecal enterococci from healthy volunteers and food handlers in Spain: genes and phenotypes. Microb. Drug Resist.9:47–60.
7.del Campo, R., C. Tenorio, M. Zarazaga, R. Go´mez-Lus, F. Baquero, and C. Torres.2001. Detection of a singlevanA-containingEnterococcus faecalis
clone in hospitals in different regions in Spain. J. Antimicrob. Chemother. 48:746–747.
8.Enright, M. C., N. P. Day, C. E. Davies, S. J. Peacock, and B. Spratt.2000. Multilocus sequence typing for characterization of methicillin-resistant and methicillin-susceptible clones ofStaphylococcus aureus. J. Clin. Microbiol. 38:1008–1015.
9.Feil, E. J., B. C. Li, D. M. Aanensen, W. P. Hanage, and B. G. Spratt.2004. eBURST: inferring patterns of evolutionary descent among clusters of re-lated bacterial genotypes from multilocus sequence typing data. J. Bacteriol. 186:1518–1530.
10.Feil, E. J., and B. G. Spratt. 2001. Recombination and the population structures of bacterial pathogens. Annu. Rev. Microbiol.55:561–590. 11.Gordillo, M. E., K. V. Singh, and B. E. Murray. 1993. Comparison of
ribotyping and pulsed-field gel electrophoresis for subspecies differentiation of strains ofEnterococcus faecalis. J. Clin. Microbiol.31:1570–1574. 12.Grundmann, H., S. Hori, and G. Tanner. 2001. Determining confidence
intervals when measuring genetic diversity and the discriminatory abilities of typing methods for microorganisms. J. Clin. Microbiol.39:4190–4192. 13.Holmes, E. C., R. Urwin, and M. C. Maiden.1999. The influence of
recom-bination on the population structure and evolution of the human pathogen
Neisseria meningitidis. Mol. Biol. Evol.16:741–749.
14.Homan, W. L., D. Tribe, S. Poznanski, M. Li, G. Hogg, E. Spalburg, J. D. Van Embden, and R. J. Willems.2002. Multilocus sequence typing scheme forEnterococcus faecium. J. Clin. Microbiol.40:1963–1971.
15.Hunter, P. R., and M. A. Gaston.1988. Numerical index of the discrimina-tory ability of typing systems: an application of Simpson’s index of diversity. J. Clin. Microbiol.26:2465–2466.
16.Kumar, S., K. Tamura, and M. Nei.1994. MEGA: molecular evolutionary genetics analysis software for microcomputers. Comput. Appl. Biosci.10: 189–191.
17.Macia´, M. D., C. Juan, A. Oliver, O. Hidalgo, and J. L. Pe´rez.2005. Molec-ular characterization of a glycopeptide-resistantEnterococcus faecalis out-break in an intensive care unit. Enferm. Infecc. Microbiol. Clin.23:460–463.
on May 16, 2020 by guest
http://jcm.asm.org/
18.Malani, P. N., C. A. Kauffman, and M. J. Zervos.2002. Enterococcal disease, epidemiology, and treatment, p. 385–408.InM. S. Gilmore, D. B. Clewell, P. Courvalin, G. M. Dunny, B. E. Murray, and L. B. Rice (ed.), The entero-cocci: pathogenesis, molecular biology, and antibiotic resistance. ASM Press, Washington, D.C.
19.Malathum, K., K. V. Singh, G. M. Weinstock, and B. E. Murray.1998. Repetitive sequence-based PCR versus pulsed-field gel electrophoresis for typing ofEnterococcus faecalisat the subspecies level. J. Clin. Microbiol. 36:211–215.
20.Mundy, L. M., D. F. Sahm, and M. Gilmore.2000. Relationships between enterococcal virulence and antimicrobial resistance. Clin. Microbiol. Rev. 13:513–522.
21.Nallapareddy, S. R., R. W. Duh, K. V. Singh, and B. E. Murray.2002. Molecular typing of selectedEnterococcus faecalisisolates: pilot study using multilocus sequence typing and pulsed-field gel electrophoresis. J. Clin. Microbiol.40:868–876.
22.Nallapareddy, S. R., H. Wenxiang, G. M. Weinstock, and B. E. Murray.2005. Molecular characterization of a widespread, pathogenic, and antibiotic re-sistance-receptiveEnterococcus faecalislineage and dissemination of its pu-tative pathogenicity island. J. Bacteriol.187:5709–5718.
23.Nemoy, L. L., M. Kotetishvili, J. Tigno, A. Keefer-Norris, A. D. Harris, E. N. Perencevich, T. A. Johnson, D. Torpey, A. Sulakvelidze, J. G. Morris, Jr., and O. C. Stine.2005. Multilocus sequence typing versus pulsed-field gel electrophoresis for characterization of extended-spectrum beta-lactamase-producingEscherichia coliisolates. J. Clin. Microbiol.43:1776–1781. 24.Novais, C., T. M. Coque, J. C. Sousa, F. Baquero, L. Peixe, and the
Portu-guese Resistance Study Group.2004. Local genetic patterns within a vanco-mycin-resistantEnterococcus faecalis clone isolated in three hospitals in Portugal. Antimicrob. Agents Chemother.48:3613–3617.
25.Paulsen, I. T., L. Banerjei, G. S. Myers, K. E. Nelson, R. Seshadri, T. D. Read, D. E. Fouts, J. A. Eisen, S. R. Gill, J. F. Heidelberg, H. Tettelin, R. J. Dodson, L. Umayam, L. Brinkac, M. Beanan, S. Daugherty, R. T. DeBoy, S. Durkin, J. Kolonay, R. Madupu, W. Nelson, J. Vamathevan, B. Tran, J. Upton, T. Hansen, J. Shetty, H. Khouri, T. Utterback, D. Radune, K. A. Ketchum, B. A. Dougherty, and C. M. Fraser.2003. Role of mobile DNA in the evolution of vancomycin-resistantEnterococcus faecalis. Science299: 2071–2074.
26.Peacock, S. J., G. D. de Silva, A. Justice, A. Cowland, C. E. Moore, C. G. Winearls, and N. P. Day.2002. Comparison of multilocus sequence typing and pulsed-field gel electrophoresis as tools for typingStaphylococcus aureus
isolates in a microepidemiological setting. J. Clin. Microbiol.40:3764–3770. 27.Rice, L. B., and L. L. Carias.1998. Transfer ofTn5385, a composite, mul-tiresistance chromosomal element fromEnterococcus faecalis. J. Bacteriol. 180:714–721.
28.Robredo, B., C. Torres, K. V. Singh, and B. E. Murray.2000. Molecular
analysis ofTn1546 invanA-containingEnterococcusspp. isolated from hu-mans and poultry. Antimicrob. Agents Chemother.44:2588–2589. 29.Schouls, L. M., H. G. van der Heide, L. Vauterin, P. Vauterin, and F. R.
Mooi.2004. Multiple-locus variable-number tandem repeat analysis of Dutch
Bordetella pertussisstrains reveals rapid genetic changes with clonal expan-sion during the late 1990s. J. Bacteriol.186:5496–5505.
30.Shankar, N., A. S. Baghdayan, and M. S. Gilmore.2002. Modulation of virulence within a pathogenicity island in vancomycin-resistantEnterococcus faecalis. Nature417:746–750.
31.Shimodaira, H., and M. Hasegawa. 1999. Multiple comparisons of log-likelihoods with applications to phylogenetic inference. Mol. Biol. Evol. 16:1114–1146.
32.Smith, J. M., N. H. Smith, M. O’Rourke, and B. G. Spratt.1993. How clonal are bacteria? Proc. Natl. Acad. Sci. USA90:4384–4388.
33.Swofford, D. L.2000. PAUP*: phylogenetic analysis using parsimony and other methods, version 4. Sinauer, Sunderland, Mass.
34.Tendolkar, P. M., A. S. Baghdayan, and N. Shankar. 2003. Pathogenic enterococci: new developments in the 21st century. Cell. Mol. Life Sci. 60:2622–2636.
35.Tenover, F. C., R. D. Arbeit, R. V. Goering, P. A. Mickelsen, B. E. Murray, D. H. Persing, and B. Swaminathan.1995. Interpreting chromosomal DNA restriction patterns produced by pulsed-field gel electrophoresis: criteria for bacterial strain typing. J. Clin. Microbiol.33:2233–2239.
36.Thorisdottir, A. S., L. L. Carias, S. H. Marshall, M. Green, M. J. Zervos, C. Giorgio, L. A. Mermel, J. M. Boyce, A. A. Medeiros, H. Fraimow, and L. B. Rice.1994. IS6770, an enterococcal insertion-like sequence useful for deter-mining the clonal relationship of clinical enterococcal isolates. J. Infect. Dis. 170:1539–1548.
37.Tomayko, J. F., and B. E. Murray.1995. Analysis ofEnterococcus faecalis
isolates from intercontinental sources by multilocus enzyme electrophoresis and pulsed-field gel electrophoresis. J. Clin. Microbiol.33:2903–2907. 38.Urwin, R., and M. C. Maiden.2003. Multi-locus sequence typing: a tool for
global epidemiology. Trends Microbiol.11:479–487.
39.Velasco, D., S. Pe´rez, M. A. Domı´nguez, R. Villanueva, and G. Bou.2004. Description of a nosocomial outbreak of infection caused by avan A-con-taining strain ofEnterococcus faecalisin La Corun˜a, Spain. J. Antimicrob. Chemother.53:892–893.
40.Waar, K., A. B. Muscholl-Silberhorn, R. J. Willems, M. J. Slooff, H. J. Harmsen, and J. E. Degener.2002. Genogrouping and incidence of virulence factors ofEnterococcus faecalisin liver transplant patients differ from blood culture and fecal isolates. J. Infect. Dis.185:1121–1127.
41.Willems, R. J., J. Top, M. van Santen, D. A. Robinson, T. M. Coque, F. Baquero, H. Grundmann, and M. J. Bonten.2005. Global spread of vanco-mycin-resistantEnterococcus faeciumfrom distinct nosocomial genetic com-plex. Emerg. Infect. Dis.11:821–828.