Georgia State University Georgia State University
ScholarWorks @ Georgia State University
ScholarWorks @ Georgia State University
Nutrition Theses Department of Nutrition
Summer 6-28-2012
The Efficacy of Short-Term Supplemental Nutrition Education on
The Efficacy of Short-Term Supplemental Nutrition Education on
Nutrition Knowledge and Dietary Behaviors of Urban Middle
Nutrition Knowledge and Dietary Behaviors of Urban Middle
School Children
School Children
Julia E. Orr
Georgia State University
Follow this and additional works at: https://scholarworks.gsu.edu/nutrition_theses
Recommended Citation Recommended Citation
Orr, Julia E., "The Efficacy of Short-Term Supplemental Nutrition Education on Nutrition Knowledge and Dietary Behaviors of Urban Middle School Children." Thesis, Georgia State University, 2012.
https://scholarworks.gsu.edu/nutrition_theses/36
This Thesis is brought to you for free and open access by the Department of Nutrition at ScholarWorks @ Georgia State University. It has been accepted for inclusion in Nutrition Theses by an authorized administrator of
ACCEPTANCE
This thesis, THE EFFICACY OF SHORT-TERM SUPPLEMENTAL NUTRITION EDUCATION ON NUTRITION KNOWLEDGE AND DIETARY BEHAVIORS OF URBAN MIDDLE SCHOOL CHILDREN, by Julia E. Orr was prepared under the direction of the Master’s Thesis Advisory Committee. It is accepted by the committee members in partial fulfillment of the requirements for the degree Master of Science in the Byrdine F. Lewis School of Nursing and Health Professions, Georgia State University. The Master’s Thesis Advisory Committee, as representatives of the faculty, certify that this thesis has met all standards of excellence and scholarship as determined by the faculty.
_____________________ ________________________
Anita M. Nucci, PhD, RD, LD Sarah Henes, PhD, RD, LD
Committee Chair Committee Member
______________________ Murugi Ndirangu, PhD Committee Member
AUTHOR’S STATEMENT
In presenting this thesis as a partial fulfillment of the requirements for the advanced degree from Georgia State University, I agree that the library of Georgia State University shall make it available for inspection and circulation in accordance with its regulations governing materials of this type. I agree that permission to quote, to copy from, or to publish this thesis may be granted by the professor under whose direction it was written, by the Byrdine F. Lewis School of Nursing and Health Professions director of graduate studies and research, or by me. Such quoting, copying, or publishing must be solely for scholarly purposes and will not involve potential financial gain. It is understood that any copying from or publication of this thesis, which involves potential financial gain will not be allowed without my written permission.
NOTICE TO BORROWERS
All theses deposited in the Georgia State University library must be used in accordance with the stipulations prescribed by the author in the preceding statement. The author of this thesis is:
Julia E. Orr 4735 Westchester Ct
Duluth, GA 30096
The director of this thesis is:
Anita M. Nucci, PhD, RD, LD Assistant Professor and Division Head
Division of Nutrition
Byrdine F. Lewis School of Nursing and Health Professions Georgia State University
VITA
Julia E. Orr
ADDRESS: 4735 Westchester Ct Duluth, GA 30096
EDUCATION: M.S. 2012 Georgia State University Health Sciences
B.S. 2009 The University of South Carolina Exercise Science
PROFESSIONAL EXPERIENCE:
• Graduate Assistant 2011-2012
Georgia State University
• Dietetic Intern 2010-2012
Georgia State University
PROFESSIONAL SOCIETIES AND ORGANIZATIONS:
• Academy of Nutrition and Dietetics • Georgia Dietetic Association
ABSTRACT
THE EFFICACY OF SHORT-TERM SUPPLEMENTAL NUTRITION EDUCATION ON NUTRITION KNOWLEDGE AND DIETARY BEHAVIORS OF URBAN
MIDDLE SCHOOL CHILDREN by
Julia E. Orr
Background: Overweight and obesity related diseases are on the rise among youth in
the United States. Children and adolescents are not meeting the dietary guidelines, which
suggests the need for nutrition intervention. Research is inconsistent with regard to the
most effective method of educating urban youth.
Purpose: To determine the effect of a supplemental after-school nutrition education
intervention on the knowledge and behaviors of urban school students.
Methods: Six, 45-minute nutrition lessons were provided to middle school students
(ages 9-12) who attended the Boys and Girls Club of Metro Atlanta (BGCMA) at the
Center of Hope in Thompsonville, GA. A pre- and posttest was administered to assess
differences in students’ nutrition knowledge and behaviors. Chi-square analysis was used
to compare the number of correct answers for the entire intervention population and after
stratification by gender and number of classes missed (0-2 versus >2). The Wilcoxon
signed rank test was used to compare the median number of correct answers in pre- vs.
posttest responses for all participants and by the number of classes missed. A p-value of
<0.05 was considered to be significant.
Results: 15 African American students (9 female) between the ages of 9 and 12 enrolled
in the study. 2 students (1 female) did not complete the study. A significant but negative
change in knowledge was found in 1 of 15 nutrition questions for the entire cohort as well
as in males. No significant differences were observed by the number of classes missed.
vs. posttest was also observed (10 vs. 9, respectively; p=0.049). Approximately 60% of
the participants reported that they were more likely to make positive, nutrition-related
behavior changes as a result of the intervention.
Conclusion: We found a negative association between the nutrition education
intervention and knowledge gain. The results of this study suggest that supplemental
nutrition education alone does not have a significant effect on nutrition knowledge of
THE EFFICACY OF SHORT-TERM SUPPLEMENTAL NUTRITION EDUCATION
ON NUTRITION KNOWLEDGE AND DIETARY BEHAVIORS OF URBAN
MIDDLE SCHOOL CHILDREN
by Julia E. Orr
A Thesis
Presented in Partial Fulfillment of Requirements for the Degree of
Master of Science in Health Sciences
Byrdine F. Lewis School of Nursing and Health Professions
Division of Nutrition
Georgia State University
ii
ACKNOWLEDGMENTS
I will be forever grateful for Dr. Anita Nucci for her guidance and support throughout this
process, not only as an advisor but also as a professor who will always be an inspiration
to excel in the field of nutrition. The best advisor and teacher a student could hope for,
she has continuously provided guidance throughout my graduate studies. I am likewise
grateful for Dr. Sarah Henes and Dr. Murugi Ndirangu for their support and insight
throughout all stages of this research process. Further I would like to thank my
colleague, Kristen Fuller, for her involvement in the curriculum development and for her
participation in teaching the classes at the Boys and Girls Club of Metro Atlanta. Finally,
I greatly appreciate the staff at the Boys and Girls Club of Metro Atlanta at the
iii TABLE OF CONTENTS
List of Tables ... iv
List of Figures ...v
Abbreviations ... vi
Chapter I. INTRODUCTION ...1
II. LITERATURE REVIEW ...3
Health Disparities in Middle School Aged Children ...3
Nutrition Education in Schools ...4
Teaching Methods ...8
Nutrition Intake in Children and Adolescents ...9
Fruit Intake ...10
Breakfast ...10
Soft Drinks and Snacks ...11
Fast Food ...12
Calcium Intake ...12
Healthy People 2020 ...13
III. METHODS ...15
Subjects ...15
Procedures ...15
Data Analysis ...17
IV. RESULTS ...19
Subjects ...19
Knowledge Gain ...19
Lifestyle Changes ...24
V. DISCUSSION ...26
Behavioral Intervention ...27
Changes in Intake ...29
Limitations ...31
Conclusions ...32
References ...34
iv
LIST OF TABLES
Tables Page
1. Number of Correct Answers Selected for each Question on the Pre-
and Posttest by all Participants………..………21
2. Number of Correct Answers Selected for each Question on the Pre-
and Posttest by Gender……….…….22
3. Number of Correct Answers Selected for each Question on the Pre-
and Posttest by Number of Classes Missed………..…….23
4. Median Pre- and Posttest Scores for the Cohort and by Classes Missed….……..24
v
LIST OF FIGURES
Figures Page
1. Discussion Topics and Activities Included in the 6-weeks of Nutrition
Curriculum……….18
1
ABBREVIATIONS
BGCMA Boys and Girls Club of Metro Atlanta
BMC Bone Mineral Content
BMI Body Mass Index
CDC Center for Disease Control
ESEA The Elementary and Secondary Education Act
HBSC Health Behaviors in School Aged Children
JADA Journal of the American Dietetic Association
MM Michigan Model
NHANES National Health and Nutrition Examination Survey
SHEES School Health Education Evaluation Study
SHPP School Health Policies Program
CHAPTER I.
Introduction
Nutrition related preventable health disparities, primarily obesity related type II
diabetes and heart disease, are on the rise in American children and adolescents (1-2).
Studies have shown that long-term school based programs are effective in changing
students views, beliefs and behaviors toward healthy food. These changes include
significant increases in fruit and vegetable consumption and water intake, decreased
frequency of sweetened drinks, snacks, fast food, and overall decreased fat, percent
energy from fat, saturated fat, and dietary cholesterol intake. Long-term programs
incorporate at least twelve hours of instruction in a time span of eight weeks to
twenty-one months (3–5). Current federal regulation only has requirements for specified
“core-subject matter” as authorized in the Elementary and Secondary Education Act (ESEA) of
1965 (most recently reauthorized in 2010). Policy makers are still working to have
physical and health education included as “core subjects” in ESEA (6). Current research
finds the median number of hours spent on nutrition and dietary behavior education is
less than five hours per year in US middle schools (7). The limited number of hours
spent on nutrition education and the increasing rates of nutrition related health disparities
in middle-school students suggest the need for effective nutrition education programs.
The problem investigated was whether or not short-term nutrition education
through an afterschool program was effective in changing the knowledge and behaviors
of middle school children. The purpose of this study was to determine the efficacy of a
2
afterschool program in developing healthy, knowledge based habits in urban middle
school children. The mission of BGCMA, as stated by the organization, is “to enable all
young people, especially those who need us most, to reach their full potential as
productive, caring, responsible citizens.” The BGCMA provides: a safe place to learn
and grow, ongoing relationships with caring adult professionals, life-enhancing programs,
character development experiences, hope and opportunity (8).
Specific Aims
The specific aims of the study were:
1.Evaluate the efficacy of 8-10 hours of nutrition education on increasing the knowledge
of urban middle school students participating in the Boys and Girls Clubs of Metro
Atlanta.
2.Evaluate the efficacy of 8-10 hours of nutrition education on encouraging positive
behavior change regarding healthier food choices of urban middle school students
participating in the Boys and Girls Clubs of Metro Atlanta.
Null Hypothesis: 8-10 hours of nutrition education is insufficient to significantly change
knowledge and behaviors of urban middle school children.
Alternative Hypothesis: 8-10 hours of nutrition education is sufficient to significantly
3
CHAPTER II.
Literature Review
Health disparities in middle school aged children
In an analysis of data from the National Health and Nutrition Examination Survey
(NHANES) from 2007-2008 by Ogden et. al, 34.7% of all individuals between the ages
of 6 and 19 have a BMI-for-age and gender greater than the 85th percentile and less than
the 95th percentile (1) thus qualifying them as “overweight” (9). Further, the same study
found 18.7% of the sampled population to have a BMI-for-age and gender of greater than
the 95th percentile (1) thus categorizing them as “obese” (9). This population is a
reflection of the current state of the health of children and adolescents in America. The
study further analyzed the results by race and found rates of at risk for overweight and
obesity to be higher in non-Hispanic black children than in the population as a whole at
percentiles of 38.7% and 22.3%, respectively (1).
Consequently, obesity related diseases affecting the cardiovascular, metabolic,
pulmonary, gastrointestinal, and psychosocial systems of many adults are now appearing
in overweight and obese children and adolescents. Striking estimates of the prevalence of
these diseases in children are reported at the following rates: hypertension, 2-4%;
atherosclerosis, 8% (fibrous plaques); dyslipidemia, 5-10%; metabolic syndrome, 4%;
asthma, 7-9%; and nonalcoholic fatty liver disease 3-8% (2). Likewise, obese
adolescents are likely to have elevated blood glucose levels, a condition known as
prediabetes, putting them at higher risk for the development of type II diabetes mellitus
4
Nutrition Education in Schools
In a 2007 summary of the School Health Policies and Programs study (SHPP)
conducted by the Center for Disease Control (CDC), 920 schools reported the number of
hours of instruction spent on health education. The median number of hours reported for
time spent on health education in middle schools was just under thiry hours per school
year. However, these thirty hours were spent on fourteen topics with a variety of focuses
in mental, physical and emotional health. Approximately two-thirds (67.3%) of all states
and 85.1% of the 459 districts surveyed reported requiring the teaching of nutrition and
dietary behavior to middle school students. However, the median number of hours spent
addressing nutrition and dietary behavior in middle schools was only a total 4.2 hours
throughout the entire school year (7).
Currently, the majority of literature supports school based intervention for
nutrition education with ethnic minority students. Carol J. Stevens reviewed obesity
prevention interventions involving both nutrition education and physical activity in
middle school children, ages 10-14 (3). Eight studies were included in her review based
on the key word search including: “obesity, middle school-age children,
intervention/prevention programs, Hispanic, African American, and Native America.”(3).
The review only included studies with interventions greater than two months long and
studies before 1998 were excluded. Stevens found that the majority of school-based
programs integrate nutrition education into the daily or weekly schedules for
middle-school children and reported increased efficacy in programs that integrated goal setting as
motivation for children in the areas of dietary behavior and physical activity. The review
physical activity was beneficial in changing the behavior of the individual children.
Stevens further suggested that there is value in four specific areas when providing a
health behaviors intervention. These four areas include: behavioral strategies, exposure,
neighborhood safety, and parental involvement. Further, the behavioral strategies were
focused on self-efficacy and motivation pertaining to health behaviors. Stevens’ review
suggested that certain behavioral, personal and environmental factors are related to
obesity in children; however, her findings were inconclusive pertaining to ethnic
minorities (3).
The dietary interventions of the studies included in Stevens’ review are focused
on two primary areas: decreasing consumption of high-fat, high-calorie foods along with
increasing fruit and vegetable consumption. This review gives evidence to the
effectiveness of long-term interventions (ie. two months to two years) and thus
emphasizes the need for studies concerning short-term intervention programs (3).
Stevens also noted that with the decline of health education, especially in lower income
schools, a benefit from community based programming can be seen as it is altered to
match the values and beliefs of the intended intervention group (3,11).
Fahlman et al (2008) found a significant change in both knowledge and behavior
between pre- and posttest analysis based on a total of 8-10 hours of classroom based
instruction and demonstration (5). This intervention was derived to further investigate
the School Health Education Evaluation Study (SHEES) that suggests a minimum of ten
hours of education are required to show the specific effects of an education intervention.
The SHEES further suggests that an average of fifty hours of classroom learning are
Model (MM) Nutrition Curriculum created to address the issue of poor nutrition in
Michigan public school students. The MM incorporates specific nutrition education into
the health classes that are currently taught in 95% of Michigan middle schools. The
study used a pre/post assessment quasi-experimental design in eleven intervention middle
schools and compared the results to seven volunteered control schools. The pre- and
post-assessments of 783 individual participants were analyzed for significant changes in
knowledge, behavior change and efficacy expectations towards healthy eating. 87% of
the participants who completed the study in the intervention group were African
American compared to 25% in the control group. The study results revealed a significant
within group difference between the pre- and post-assessment in the participants’
consumption of fruits, vegetables, and “other” along with significant improvements
between the pre- and post-assessment in the intervention group in the same three
categories of consumption (p ≤0.05). “Other” was defined as primarily junk food which
students reported a statistically significant decrease in consumption. Evaluation of the
twenty questions assessing nutrition knowledge revealed a significant improvement
between pre- and post-assessment for students in the intervention group along with
significant improvement in comparison to the control group (5). Currently, more
research needs to be done to establish the efficacy of nutritional intervention based on
less than ten hours of instruction.
The HEALTHY nutrition intervention was a five semester, middle school-based
intervention comprised of four primary components including “nutrition, physical
education, behavior change, and social marketing-based communications.” Participants
was African American with the majority of the intervention group of Hispanic ethnicity
(56%). This long-term, school based intervention found a significant increase in fruit
consumption and water intake in the intervention versus the control schools. The authors
of this study suggested that interventions must extend beyond the school environment in
order to effect dietary behaviors (4).
Other Nutrition Interventions
In a review of over 300 studies on the outcomes of nutrition education,
researchers have concluded that interventions focused on behavior change, rather than
knowledge only, have better outcomes. Nutrition education has been working within a
framework that suggests that knowledge influences one’s attitudes, which in turn changes
behaviors. However, recent research focuses on a three-component model incorporating
motivation, action and environment as essential phases of nutrition education. The initial
motivational stage, the goal of education is to increase participants’ awareness and desire
focusing on why changes should be made (13).
A review published in the Journal of the American Dietetic Association (JADA)
in 2011 concluded that behavior-based interventions are effective in increasing fruit and
vegetable intake; however, additional approaches are necessary to ensure that the
recommended intake is met and sustained. These behavioral interventions primarily
utilized the transtheoretical model, the social contextual model, social learning theory and
the stages of change to influence behavior change. The interventions demonstrated
small and not adequate to meet the dietary guidelines (14). These reviews suggest
motivation is a fundamental element of successful intervention.
Teaching Methods
A variety of teaching methods have been found to be effective in improving
nutrition knowledge and inducing behavioral change in youth and adolescents when
closely linked to the personal, cultural and social aspects of the intervention population.
The CDC implemented School Health Guidelines to Promote Healthy Eating and
Physical Activity based on current research and best practice (15). Thus, the CDC has
outlined curricula guidelines that are effective in helping students improve eating habits
according to theories of behavior change concluded from scientific research. These
theories have the following characteristics as outlined (verbatim) in the CDC’s School
Health Guidelines to Promote Healthy Eating and Physical Activity:
• focus on clear health goals and specific behavioral outcomes • be research-based and theory-driven
• address individual values and group norms that support health-enhancing behaviors
• focus on increasing the personal perception of risk and harmfulness of engaging in specific health risk behaviors as well as reinforcing protective factors
• address social pressures and influences
• build personal competence, social competence and increase confidence in skills
• use strategies designed to personalize information and engage students
• provide age-appropriate and developmentally appropriate information, learning strategies, teaching methods and materials
• incorporate learning strategies, teaching methods and materials that are culturally inclusive
• provide adequate time for instruction and learning
• provide opportunities to reinforce skills and positive health behaviors
• provide opportunities to make positive connections with influential others The CDC further outlines methods and strategies for classroom instruction that
should encourage student participation in helping them develop the attitudes and skill
necessary to implement change in their eating habits (15). Methods resulting in positive
behavioral changes in both children and adolescents include interactive tools
incorporating demonstration, modeling, rehearsal, feedback and goal setting (16). By
middle school, health education should primarily focus on self-assessment and personal
goal setting, (15-18) as students are capable of linking physical activity and healthy
eating behaviors with positive health outcomes (18).
Nutrition Intake in Children and Adolescents
A 2005-2006 survey by the World Health Organization (WHO) revealed specific
areas needing nutrition intervention in children and adolescents. The Health Behaviors in
School Aged Children (HBSC)2005/2006 Survey is the only national survey of its type to
look at the health behaviors in children and early adolescents (19). Over 9,000 students
order to provide a representative national sample. Various areas of physical, social and
behavioral health were examined on an international level. The following reported
findings are intended to show the areas that can be improved by nutrition intervention
based on data pertaining to the surveyed US population only.
Fruit Intake
Low fruit consumption correlates with a diet that is low in fiber and high in fat
and sodium. HBSC data report a national average of 20% of students consuming fruit
more than once a day. Therefore the US national average for children consuming fruit
once a day or less is at 80%. Low fruit and vegetable consumption as a component of
poor dietary habits increases the risk in children and adolescents for long-term health
problems.
Breakfast
The national average for reported daily breakfast consumption in the HBSC was
45%. Reported causes for skipping breakfast were influenced by both economic and
lifestyle determinants such as household income, food security, number or parents in the
household, and job of the female head of household (19-20). Skipping breakfast has been
associated with poorer nutrition related behaviors throughout the day and limits school
performance. HBSC data report that breakfast consumption decreases with age among
Soft Drinks and Snacks
According the HBSC data, 36% of students surveyed reported consuming soft
drinks every day. Soft drinks contribute to increased energy intake, primarily in the form
of sugar, with no contribution to nutrient needs of these individuals. When data were
analyzed by region, the south Atlantic region reported daily soft drink consumption
above the national average at 41%. Likewise, 32% of US students reported daily
consumption of chips or fries as snacks contributing to the low-fiber, fat,
high-sodium diet associated with inadequate fruit consumption (19).
In analysis of NHANES data from 2005-2006, children and adolescents who
consumed four or more snacks in a day consumed 50% more calories. More frequent
snacking directly correlated with a greater proportion of the individual’s daily calories
coming from sugar although it had no effect on BMI for males or females. Based on this
analysis, snacks provided 31% of total sugars and 27% of discretionary calories. The
foods primarily consumed as snacks by this age group were all high fat and/or high sugar
foods with minimal contribution to vitamin and mineral intake. Listed below are the five
most highly consumed snack foods by food group, as classified by the USDA:
Grains- Chips, cookies, pizza, white breads/rolls, crackers
Vegetables- Potato chips, pizza, tomato salsa and ketchup, French fries, lettuce
Fruits- Apples, citrus juice, bananas, non-citrus juice, oranges
Milk- Fluid milk, cheese, ice cream, pizza, candy
Meat/beans- Nuts and nut butters, hotdogs and luncheon meats, fried chicken, candy
The primary foods consumed in each food group are calorie dense, low nutrient
foods. While these snack patterns were not associated with higher BMIs, evidence does
suggest that habits established in childhood continue throughout adulthood where health
implications related to overweight and obesity will begin to persist (21).
Fast Food
Forty-five percent of students reported eating fast food at least once a week,
which is also associated with a diet that tends to be higher in calories and fat and rarely
contributes to the intake of fruits, vegetables and micronutrient dense foods. The south
Atlantic region again reported averages higher than the national average at 50% (19).
Calcium Intake
Recent research has greatly emphasized the importance of adequate calcium
intake in children and adolescents for the prevention of osteoporosis and fractures later in
life (22-23). Although some studies have failed to demonstrate a significant association
between calcium intake and bone mineral content (BMC) in children under the age of
eleven, research suggests that a calcium intake of >1000 mg/day will increase total body
BMC and bone mineral density (22). However, many studies that have examined
calcium intake in adolescents have shown less than adequate intake in adolescent
participants (17,24).
In analysis of 2005-2006 NHANES data, milk consumption was related to
race/ethnicity suggesting that African Americans consume less milk than non-Hispanic
This analysis also found that milk consumption substantially impacted total daily nutrient
intake providing significant amounts of vitamins A, D, riboflavin and B12, along with the
minerals calcium and phosphorus (25).
Healthy People 2020
Every ten years, the US Department of Health and Human Services establishes a
10-year agenda for improving the nations health by establishing goals and monitoring
overall progress to promote “a society in which all people live long, healthy lives” (26).
Objectives are based on modeling, trend projections and findings from current
interventions. Where data is not available to project a specific outcome, a 10%
improvement rate is typically implemented. These objectives represent necessary areas
of improvement in the nations overall health. The following are a verbatim list of
objectives pertaining to food and nutrient consumption as is pertinent to the proposed
intervention:
NWS-14 Increase the contribution of fruits to the diets of the population aged 2 years and
older
Target: 0.9-cup equivalents per 1,000 calories
NWS-15 Increase the contribution of vegetables to the diets of the population aged 2
years and older
Target: 1.1-cup equivalents per 1,000 calories
NWS-16 Increase the contribution of whole grains to the diets of the population aged 2
years and older
NWS-17 Reduce the consumption of calories from solid fats and added sugars in the
population aged 2 years and older
Target: 29.8% of total calorie intake from solid fats and added sugar
NWS-18 Reduce consumption of saturated fat in the population aged 2 years and older
Target: 9.5% total calorie intake from saturated fat
NWS-19 Reduce consumption of sodium in the population aged 2 years and older
Target: 2,300 mg sodium per day
NWS-20 Increase consumption of calcium in the population aged 2 years and older
15 CHAPTER III.
Methods
Subjects
Children between the ages of 9 and 12 enrolled in the Thomasville Center of
Hope Boys and Girls Club of Metro Atlanta (BGCMA) were invited to participate in the
study. All children who were able to provide informed consent from a parent and/or
guardian were included in the study. Participation was voluntary.
Procedures
This study was a pre/posttest quasi-experimental design that was approved by the
Georgia State University Institutional Review Board. The intervention began in March
of 2012. Two graduate students in the Georgia State University Division of Nutrition
conducted the pre-assessment prior to initiation of the program intervention using a
non-validated test adapted from the 4-H Healthy Lifestyles program (Appendix A) (27). Six,
45 minute long lessons were provided once a week for six non-consecutive weeks due to
the operating schedule of the BGCMA. The test was given again as a post-assessment
(Appendix A) on the same day as the last lesson in May of 2012. Attendance was taken
at the beginning of each class and maintained by the student PI. The pre- and
post-assessments were administered and graded by the student PI.
The educational material was developed based on the aforementioned areas of
compromised nutrition in children and adolescents in the literature review, primarily
16
drinks, snacks and fast food. A summary of the class topics and activities is shown in
Figure 1. During the first session, two graduate students from Georgia State University
were introduced as the teachers, the pre-assessment was administered and the participants
were educated on what nutrition is and why eating healthy food is important. The
participants were also instructed on how to make a plate based on the “MyPlate” model,
which allowed them to review the five food groups and the composition of a balanced
meal. The second class used educational activities to teach the participants how to
estimate portion sizes while focusing on the importance of breakfast. This class
incorporated how to measure portions (ie. using measuring cups and hand-models) and
participants were introduced to the food label. The third session focused on fruits and
vegetables and included a discussion of the nutrients associated with each color of
produce and how fruits and vegetables could be incorporated into their daily
meals/snacks. Participants were able to taste test a variety of fruits in various forms
(fresh, canned, dried, and frozen) to educate them on ways to increase fruit and vegetable
consumption. Healthy snack options were also discussed in class three. Class four
focused on healthy drink choices and hydration. Participants were educated on the
importance of drinking water and milk and reasons to limit sugary beverages. Increasing
calcium intake and decreasing sugar intake were emphasized. Using food labels,
participants compared the amount of sugar (in teaspoons) in a variety of common drinks
and snack foods. Further, participants were challenged to try to incorporate dairy into
their diet everyday and to consume three servings at least one day of the following week.
The fifth class followed up with the previous class’s challenge and elaborated on what
meaning of serving size and servings per container, as well as how to use the nutrition
label information to choose healthy foods. The nutrients of particular interest were fiber,
sodium, sugar and saturated fat. Participants practiced using food labels to identify
healthy foods and foods that were “high” in a particular nutrient. The final class
reviewed food safety, in regards to hand washing and allowed students to ask questions
that had not yet been answered. At the end of the class the post-assessment was given.
Each week the teachers reviewed the lesson taught the previous week with the primary
emphasis of each review being food groups, serving sizes, MyPlate, and fruit and
vegetable intake.
Data Analysis
Descriptive statistics were used to summarize the demographic data. The
Chi-square test was used to evaluate the change in the number of correct answers on the pre-
and posttest for each question. The data was reanalyzed after stratification by gender and
number of classes missed (0-2 versus greater than 2 classes missed). The Wilcoxon
signed rank was also used to evaluate the change in median number of correct answers on
the pre- versus posttest for participants who attended 0-2 classes compared to participants
who missed greater than 2 classes. The p-value was set at <0.05. All data analysis was
Figure 1. Discussion Topics and Activities Included in the 6-weeks of Nutrition
Curriculum
BGCMA Nutrition Curriculum
Discussion Topics Activities
WEEK 1: Nutrition
and Health
Introductions; what students already
know about nutrition; why a
nutritious diet is important
Pretest
WEEK 2: Portion
Sizes & Breakfast
Portion sizes; why breakfast is
important; healthy breakfast options
Cereal Pouring/Portion
Sizes; Portion Sizes
Bingo
WEEK 3: Fruits,
Veggies & Snacks
What fruits and vegetables are;
vitamins and minerals; the
importance of variety
Fruit taste test
WEEK 4: Rethink
Your Drink
Hydration; milk/calcium; limiting
sugary beverages
Sugar activity
WEEK 5: Food
Labels and Physical
Activity
How to read a food label;
importance of physical activity;
what counts as physical activity
Reading food labels
WEEK 6: Food
Safety
Importance of food safety; how to
wash hands
Posttest
Subjects
Fifteen children (9 female) participated in the study.
American and currently enrolled in the Boys and Girls Club
of Hope in Atlanta, GA. All participants were between the ages of 9 and 12 with a mean
age of 10.27 ± 1.1 years.
complete the posttest. A total of 9 children
offered (Figure 2).
Figure
Knowledge Gain
The number of correct answers selected on the pre
question is shown for the total cohort in
answered question 6 (chocolate milk and soft drinks are about the same nutritionally)
after the classes than before (p = 0.003). No significant differences for any of the other
questions were observed. However,
19 CHAPTER IV.
Results
Fifteen children (9 female) participated in the study. All subjects were African
American and currently enrolled in the Boys and Girls Club of Metro Atlanta
, GA. All participants were between the ages of 9 and 12 with a mean
1.1 years. One male and one female were lost to follow up
A total of 9 children (4 female) attended 4 or more
Figure 2. Subject Class Participation
The number of correct answers selected on the pre- and posttest for each
question is shown for the total cohort in Table 1. Significantly fewer participants
hocolate milk and soft drinks are about the same nutritionally)
after the classes than before (p = 0.003). No significant differences for any of the other
questions were observed. However, of the 15 questions asked, the percentage of students
Classes attended (n=15) All 3 Missed 1 4 Missed 2 2 Missed >2 6
All subjects were African
of Metro Atlanta at the City
, GA. All participants were between the ages of 9 and 12 with a mean
up and did not
4 or more of the 6 classes
and posttest for each
participants
hocolate milk and soft drinks are about the same nutritionally)
after the classes than before (p = 0.003). No significant differences for any of the other
20
selecting the correct answer after the classes was lower in 9 out of 15 (60%), higher in 5
out of 15 (33%) and the same for one question (7%).
The number of correct answers selected by participants for each question on the
pre- and posttest after stratification by gender and number of classes missed are shown in
Tables 2 and 3. The number of correct answers differed between the pre- and posttest for
question 6 in boys only (p=0.015) as 78% of the males answered this question correct on
the pretest compared to only 13% on the posttest. No consistent changes were seen in the
percentage of correct answers on the pre- vs. posttest by gender. Of the 15 questions
asked, the percentage of males selecting the correct answer after the classes was lower in
8 out of 15 (53%), higher in 6 out of 15 (40%) and the same for one question (7%). The
percentage of females selecting the correct answer after the classes was lower in 8 out of
15 (53%), higher in 4 out of 15 (27%) and the same for three questions (20%).
No significant differences were observed when the data was stratified by the
number of classes missed. Consistent changes were not seen in the percentage of correct
answers on the pre- vs. posttest by number of classes missed. Of the 15 questions asked,
the percentage of participants who missed 0-2 classes that selected the correct answer
after the classes was lower in 6 out of 15 (40%), higher in 3 out of 15 (20%) and the same
for six questions (40%). The percentage of participants who missed greater than two
classes that selected the correct answer after the classes was lower in 8 out of 15 (53%),
higher in 4 out of 15 (27%) and the same for three questions (20%).
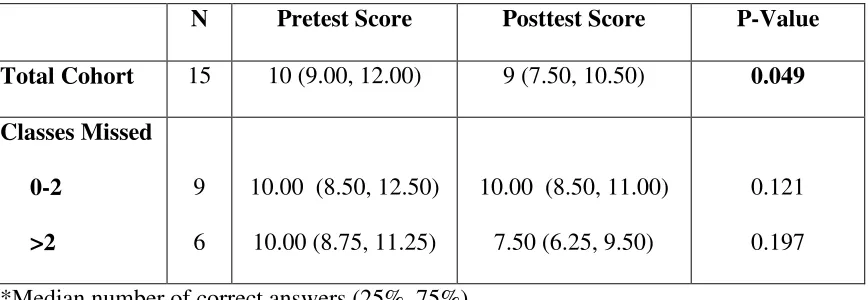
The median number of correct answers selected (total score) by each subject on
the pre- and posttests for the cohort and after subdivision by the number of classes missed
posttest (10 vs. 9, respectively; p=0.49). After stratification by the number of classes
[image:34.612.127.525.212.720.2]missed, no significant change in median score was seen.
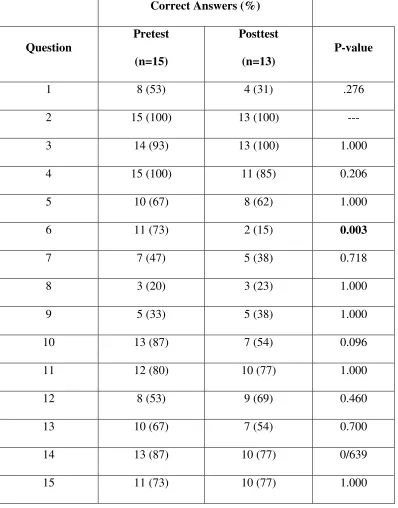
Table 1. Number of Correct Answers Selected for each Question on the Pre- and Posttest
by all Participants
Correct Answers (%)
Question
Pretest
(n=15)
Posttest
(n=13)
P-value
1 8 (53) 4 (31) .276
2 15 (100) 13 (100) ---
3 14 (93) 13 (100) 1.000
4 15 (100) 11 (85) 0.206
5 10 (67) 8 (62) 1.000
6 11 (73) 2 (15) 0.003
7 7 (47) 5 (38) 0.718
8 3 (20) 3 (23) 1.000
9 5 (33) 5 (38) 1.000
10 13 (87) 7 (54) 0.096
11 12 (80) 10 (77) 1.000
12 8 (53) 9 (69) 0.460
13 10 (67) 7 (54) 0.700
14 13 (87) 10 (77) 0/639
Table 2. Number of Correct Answers Selected for each Question on the Pre- and Posttest
by Gender
Males Females
Correct Answers (%) Correct Answers (%)
Question
Pretest
(N=9)
Posttest
(N=8)
P-value
Pretest
(N=6)
Posttest
(N=5)
P-value
1 2 (22) 1 (13) 1.000 6 (100) 3 (60) 1.000
2 9 (100) 8 (100) --- 6 (100) 5 (100) ---
3 8 (89) 8 (100) 1.000 6 (100) 5 (100) ---
4 9 (100) 6 (75) 0.206 6 (100) 5 (100) ---
5 6 (67) 6 (75) 1.000 4 (67) 2 (40) 0.567
6 7 (78) 1 (13) 0.015 4 (67) 1 (20) 0.242
7 4 (44) 2 (25) 0.620 3 (50) 3 (60) 1.000
8 1 (11) 3 (38) 0.294 2 (33) 0 (0) 0.455
9 3 (33) 3 (38) 1.000 2 (33) 2 (40) 1.000
10 7 (78) 5 (63) 0.620 6 (100) 2 (40) 0.061
11 7 (78) 7 (88) 1.000 5 (83) 3 (60) 0.545
12 5 (56) 4 (50) 1.000 3 (33) 5 (100) 0.182
13 5 (56) 3 (38) 0.637 5 (83) 4 (80) 1.000
14 7 (78) 7 (88) 1.000 6 (100) 3 (60) 0.182
Table 3. Number of Correct Answers Selected for each Question on the Pre- and Posttest
by Number of Classes Missed
Missed ≤≤≤≤ 2 Classes
(N = 9)
Missed >2 Classes
(N= 6)
Correct Answer (%) Correct Answer (%)
Question Pretest Posttest P-value Pretest Posttest P-value
1 6 (67) 3 (33) 0.347 2 (33) 1 (25) 1.000
2 9 (100) 9 (100) --- 6 (100) 4 (100) ---
3 8 (89) 1 (11) 1.000 6 (100) 4 (100) ---
4 9 (100) 7 (78) 0.471 6 (100) 4 (100) ---
5 4 (44) 6 (67) 0.637 6 (100) 2 (50) 0.133
6 6 (67) 1 (11) 0.050 5 (83) 1 (25) 0.190
7 6 (67) 4 (44) 0.637 1 (17) 1 (25) 1.000
8 2 (22) 2 (22) 1.000 1 (17) 1 (25) 1.000
9 4 (44) 5 (56) 1.00 1 (17) 0 (0) 1.000
10 8 (89) 6 (67) 0.576 5 (83) 1 (25) 0.190
11 8 (89) 8 (89) 1.000 4 (67) 2 (50) 1.000
12 6 (67) 7 (78) 1.000 2 (33) 2 (50) 1.000
13 5 (56) 5 (56) 1.000 5 (83) 2 (50) 0.500
14 7 (78) 7 (78) 1.000 6 (100) 3 (75) 0.400
Table 4. Median Pre- and Posttest Scores* for the Cohort and by Classes Missed
N Pretest Score Posttest Score P-Value
Total Cohort 15 10 (9.00, 12.00) 9 (7.50, 10.50) 0.049
Classes Missed
0-2
>2
9
6
10.00 (8.50, 12.50)
10.00 (8.75, 11.25)
10.00 (8.50, 11.00)
7.50 (6.25, 9.50)
0.121
0.197
*Median number of correct answers (25%, 75%)
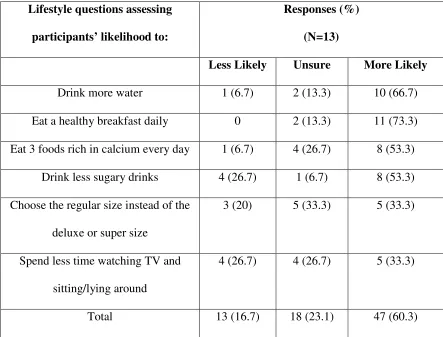
Lifestyle Changes
Based on responses to the behavioral change questions on the posttest the cohort
reported that approximately 60% of the time they were more likely to make specific
healthy lifestyle changes (Table 5). Participants reported that after the nutrition classes
they were “more likely” to drink more water (66.7%) and eat a healthy breakfast daily
(73.3%). Fewer participants noted that they were more likely to choose the regular size
instead of the deluxe or biggie size and to spend less time watching TV, lying or sitting
Table 5. Self-Efficacy Report of Lifestyle Changes
Lifestyle questions assessing
participants’ likelihood to:
Responses (%)
(N=13)
Less Likely Unsure More Likely
Drink more water 1 (6.7) 2 (13.3) 10 (66.7)
Eat a healthy breakfast daily 0 2 (13.3) 11 (73.3)
Eat 3 foods rich in calcium every day 1 (6.7) 4 (26.7) 8 (53.3)
Drink less sugary drinks 4 (26.7) 1 (6.7) 8 (53.3)
Choose the regular size instead of the
deluxe or super size
3 (20) 5 (33.3) 5 (33.3)
Spend less time watching TV and
sitting/lying around
4 (26.7) 4 (26.7) 5 (33.3)
26
CHAPTER V.
Discussion
Overweight and obesity related diseases are on the rise in youth in the United
States (1-2, 9-10). Likewise, children and adolescents are not meeting the dietary
guidelines, which suggests the need for nutrition intervention (17,19–25). However,
research is inconsistent in understanding the effects of nutrition education on urban youth
(3). Thus, this study aimed to determine the efficacy of a nutrition education component
of the BGCMA afterschool program in developing healthy, knowledge based habits in
urban children.
The intervention did not have any statistically significant effect on knowledge
gain of urban youth participating in the BGCMA afterschool program. With the
exception of question number 6, no significant changes were seen in the pre- versus
posttest analysis of the entire intervention population or when the data was stratified by
gender or number of classes missed (0-2 versus greater than 2 class missed). However,
participants answered question 6 correctly on the pretest more often than the posttest
suggesting that no positive change was made. The results in fact suggest that participants
answered more questions incorrect on the posttest, which may be attributed to a number
of study limitations including uncontrolled testing conditions and the student’s interaction
with each other. Though not validated for this intervention, the pre- and
27
A significant change (p <0.05) was seen in the comparison of median number of
correct answers on the pre- versus posttest for the total cohort. This change indicated that
participants answered more questions correctly on the pretest compared to the posttest
suggesting no benefit from the intervention. Further, when stratified by the number of
classes missed, no change was seen in the median number of correct answers for either
group. These results propose that short-term, supplemental nutrition education alone is
not effective in increasing the nutrition knowledge of urban youth.
Behavioral Interventions
The majority of previously published interventions provided a minimum of 12
hours of nutrition education over the span of 8 weeks to 21 months. Those interventions
that proved effective in changing behaviors of students covered a variety of topics over
this time span but only saw changes in a limited number of related behaviors (4-5, 14).
Although there was no evaluation of actual behavior change in this study via food
records, food frequency questionnaires, etc., similar results were seen in the students’
proposed behavior change. The frequency analysis of students’ responses to questions
regarding the likelihood they will change their behavior as a result of the intervention
suggests that the majority of students are willing to make some, though not all, of the
surveyed changes concerning their nutrition related health. The majority of responses
suggested students would be willing to change their behavior; however, some responses
suggested that students were less likely to make changes in their behavior after the
intervention. These mixed results in alignment with previous literature suggest the need
youth. Therefore, the results of this study do not support the hypothesis that 6 hours of
nutrition education is sufficient to significantly change knowledge and behaviors of urban
middle school children.
Fahlam, et al. saw positive knowledge gain and behavior change in a pilot study
implementing the Michigan Model (MM), a one-month intervention. This intervention
trained health teachers in state middle schools in the intervention curriculum and thus
trained professionals taught the course. The MM was similar in length to this
intervention providing between 8 and 10 hours of nutrition education. However, the
researchers found significant changes in fruit, vegetable and “other” consumption
through the assessment of self-reported measures of eating behavior suggesting that
minimal nutrition education provided in school can be beneficial in changing knowledge
and behaviors of youth (5).
Research suggests that interventions focused on behavior change, rather than
knowledge only, have better outcomes (13). However, the HEALTHY study from
Siega-Riz et al, examined the effects of a 5-semester health education intervention focused on
behavior change and evaluated by student self-reported dietary intakes. This study
integrated “nutrition, physical education, behavior change, and social marketing based
communications” and saw limited changes, only increasing self-reported fruit and water
intake (4).
The current study aligns with the review published in the Journal of the American
Dietetic Association (JADA) in 2011, which suggests that behavioral intervention alone
is not enough to sustain changes in dietary intake. The review, which solely looked at
behavioral interventions for sustaining intake at recommended levels. The review
suggested combining social marketing and technology-based models of change along
with behavioral economics approaches (14). The JADA review along with a review of
nutrition interventions from Contento et al. both suggest that motivation of the individual
is a determinant of successfully making dietary changes (13,14). The current study did
not assess individual’s motivation and may have been limited by not addressing the
stages of change. Future studies assessing nutrition education should incorporate various
behavioral models as previously suggested.
Changes in Intake
Participants in the current study reported increased likelihood that they will
change their behaviors as a result of the nutrition education intervention. As reported in
the HBSC, over half of the nation regularly skips breakfast, which has been associated
with poorer nutrition related behaviors throughout the day (19). The intervention
incorporated a lesson on the importance of consuming a healthy breakfast and taught
students components of a healthy breakfast based on the MyPlate guidelines, as seen in
Figure 1. The majority (73.3%) of participants who completed the post-assessment
reported that they were more likely to eat a healthy breakfast after the intervention
classes.
Calcium intake has been reported as less than adequate in adolescent populations
and in African Americans as a whole (17, 24-25). Students learned the importance of
calcium in bone health during the fourth class and were challenged to consume at least
week. Students were excited to come back and report their increased intake. Further,
53.3% of the students suggested they would be more likely to eat 3 foods rich in calcium
every day as a result of the intervention as evidenced by the post-assessment. Students
who willingly consume 3 servings of calcium rich foods per day would meet the Health
People 2020 target of 1,300 mg of calcium in populations ages 2 and up (26).
The national average of daily soda consumption in students based on the HBSC
was 35%; however, the South Atlantic region surpassed the national average with 41% of
students consuming soda daily (19). After the intervention, students did not report an
increased likelihood of drinking less sugary drinks such as sweet tea and soda.
Alterations should be made to lesson 4 of the nutrition intervention to emphasize the
importance of decreasing sugary beverage consumption. Conversely, 66.7% of students
reported they would likely increase their water intake as a result of the intervention,
which may inadvertently decrease the consumption of sugary beverages. This too aligns
with the Healthy People 2020 guidelines, which aim to decrease the consumption of solid
fats and added sugars to 29.8% of total calories in populations ages 2 and up (26).
A large contributor of solid fats as addressed by the Healthy People 2020
guidelines is fast food. 45% of students reported consuming fast food at least once a
week as reported by the HBSC. The South Atlantic region again ranked higher than the
national average as 50% of students in the region reported weekly consumption (19).
Though frequency of consumption was not addressed, participants reported the likelihood
that they would choose the regular size when ordering at a fast food restaurant, rather
than the deluxe or super size. However, the class as a whole was not more likely to
Limitations
When researchers wrote the original curriculum, the expectation was that the
intervention would provide 8-10 hours of nutrition education based on the positive results
of the pilot study using the MM curriculum by Fahlam et al. However, the six classes
only totaled 4.5 hours. Other studies that taught an overview of multiple nutrition topics
did not define the amount of time spent on each lesson or the lessons total (4–5, 14). The
time also failed to meet the recommended number of hours from previous short-term
interventions. The original curriculum was written for 8-10 hours of nutrition education.
With the limitation on time it is possible that too many topics were covered with not
enough time spent on each topic, which was further limited by the excessive disruption.
The study design presented a number of limitations such as the small sample size
and lack of control group. This study is now being viewed a pilot because of the number
of students excluded from the analysis due to unexpected absences. Some students were
working together to complete the pre- and post-assessments thus inadequately assessing
individual knowledge. This can primarily be attributed to a lack of monitoring and
discipline within the teaching environment. This type of intervention would also be more
effectively evaluated if comparing an intervention population to a control population in a
randomized control trial where the control group was not provided nutrition education in
the active learning environment. Further, the survey instrument, including the
pre/posttest along with the self efficacy survey, provided another limitation to the design
as it was not a validated instrument and was designed for a specific, and extensive, 4H
The poor learning environment may have altered the knowledge outcomes and the
authenticity of the assessments. The disruptive learning environment may have affected
knowledge outcomes by inhibiting students from learning at their fullest potential due to
the many distractions. Distractions included but were not limited to students entering and
leaving the classroom throughout class, fights between students, fire drills, shouting, and
other disruptive behavior.
The limitations of this study suggest that in the afterschool setting, the children
may be more successful with a familiar teacher trained in the nutrition curriculum in
contrast to a nutrition professional without proper training in teaching or afterschool
programs. The participants in this investigation were better behaved and more attentive
when BGCMA staff was present thus suggesting that future interventions should consider
training staff of the afterschool centers in the basic nutrition curriculum rather than
bringing in guest teachers not trained in classroom management. In addition, validating
an assessment tool for the six-week program would provide a more accurate assessment
of nutrition knowledge gained from the curriculum. The testing environment should be
altered to isolate children when the pre- and post-assessment are administered or enforce
the presence of center staff specifically during the testing time.
Conclusions
Previous research along with the results of this study suggest that further research
is necessary to understand how to effectively change health related knowledge and
behaviors of urban middle school youth. This study supports previous evidence that
to develop positive nutrition related knowledge and behavior changes in youth.
Short-term supplemental nutrition education alone in the afterschool setting does not appear to
34 REFERENCES
1. Ogden CL, Carroll MD, Curtin LR, Lamb MM, Flegal KM. Prevalence of High Body Mass Index in US Children and Adolescents, 2007-2008. JAMA: The Journal of the American Medical Association. 2010;303:242–249. Available at: [Accessed September 13, 2011].
2. Daniels SR. The consequences of childhood overweight and obesity. Future Child. 2006;16(1):47–67. Available at: [Accessed September 16, 2011].
3. Stevens CJ. Obesity prevention interventions for middle school-age children of ethnic minority: a review of the literature. J Spec Pediatr Nurs. 2010;15(3):233–243. Available at: [Accessed September 13, 2011].
4. Siega-Riz AM, El Ghormli L, Mobley C, Gillis B, Stadler D, Hartstein J, Volpe SL, Virus A, Bridgman J. The effects of the HEALTHY study intervention on middle school student dietary intakes. Int J Behav Nutr Phys Act. 2011;8:7. Available at: [Accessed September 15, 2011].
5. Fahlman MM, Dake JA, McCaughtry N, Martin J. A pilot study to examine the effects of a nutrition intervention on nutrition knowledge, behaviors, and efficacy expectations in middle school children. J Sch Health. 2008;78(4):216–222. Available at: [Accessed September 13, 2011].
6. UDALL, BINGAMAN). Promoting Health as Youth Skills In Classrooms And Life Act. 2011.
7. Kann L, Telljohann SK, Wooley SF. Health education: results from the School Health Policies and Programs Study 2006. J Sch Health. 2007;77(8):408–434. Available at: [Accessed September 16, 2011].
8. Anon. Our Mission. Boys and Girls Clubs of America. Available at:
http://bgca.org/whoweare/Pages/Mission.aspx [Accessed September 29, 2011].
9. Anon. Healthy Weight: Assessing Your Weight: BMI: About BMI for Children and Teens | DNPAO | CDC. Healthy Weight- it’s not a diet, it’s a lifestyle! 2011. Available at:
http://www.cdc.gov/healthyweight/assessing/bmi/childrens_bmi/about_childrens_bmi.ht ml [Accessed October 31, 2011].
35
11. Chatterjee N, Blakely DE, Barton C. Perspectives on obesity and barriers to control from workers at a community center serving low-income Hispanic children and families. J Community Health Nurs. 2005;22(1):23–36. Available at: [Accessed October 11, 2011].
12. Connell DB, Turner RR, Mason EF. Summary of findings of the School Health Education Evaluation: health promotion effectiveness, implementation, and costs. J Sch Health. 1985;55(8):316–321. Available at: [Accessed June 2, 2012].
13. Contento IR. Nutrition education: linking research, theory, and practice. Asia Pac J Clin Nutr. 2008;17 Suppl 1:176–179. Available at: [Accessed May 14, 2012].
14. Thomson CA, Ravia J. A systematic review of behavioral interventions to promote intake of fruit and vegetables. J Am Diet Assoc. 2011;111(10):1523–1535. Available at: [Accessed May 14, 2012].
15. Anon. School health guidelines to promote healthy eating and physical activity. MMWR Recomm Rep. 2011;60(RR-5):1–76. Available at: [Accessed September 20, 2011].
16. Bandura A. Social cognitive theory: an agentic perspective. Annu Rev Psychol. 2001;52:1–26. Available at: [Accessed September 20, 2011].
17. Pettinato AA, Loud KJ, Bristol SK, Feldman HA, Gordon CM. Effects of nutrition, puberty, and gender on bone ultrasound measurements in adolescents and young adults. J Adolesc Health. 2006;39(6):828–834. Available at: [Accessed September 22, 2011].
18. Killen JD, Robinson TN. School-Based Research on Health Behavior Change: The Stanford Adolescent Heart Health Program as a Model for Cardiovascular Disease Risk Reduction. Review of Research in Education. 1988;15:171–200. Available at: [Accessed September 20, 2011].
19. Eunice Kennedy Shriver National Institute of Child Health and Human Development, NIH, DHHS. Health Behaviors in School-Age Children (HBSC) 2005/2006 Survey: School Report (NA). 2008.
20. Siega-Riz AM, Popkin BM, Carson T. Trends in breakfast consumption for children in the United States from 1965-1991. Am. J. Clin. Nutr. 1998;67(4):748S–756S.
Available at: [Accessed October 11, 2011].
21. Sebastian R, Goldman J, Wilkinson EC. Snacking Patterns of U.S. Adolescents: What We Eat In America, NHANES 2005-2006. 2010. Available at:
http://ars.usda.gov/Services/docs.htm?docid=19476.
36
23. Bailey DA, Faulkner RA, McKay HA. Growth, physical activity, and bone mineral acquisition. Exerc Sport Sci Rev. 1996;24:233–266. Available at: [Accessed September 22, 2011].
24. Tylavsky FA, Cowan PA, Terrell S, Hutson M, Velasquez-Mieyer P. Calcium Intake and Body Composition in African-American Children and Adolescents at Risk for Overweight and Obesity. Nutrients. 2010;2:950–964. Available at: [Accessed September 22, 2011].
25. Sebastian R, Goldman J, Wilkinson EC, LaComb R. Fluid Milk Consumption in the United States: What We Eat In America, NHANES 2005-2006. 2010. Available at: http://ars.usda.gov/Services/docs.htm?docid=19476.
26. U.S. Department of Health and Human Services. Office of Disease Prevention and Health Promotion. Healthy People 2020. Washington, DC. Available at [Specific URL]. Accessed [Date URL was accessed]
27. Dotson V, Gill M. 4-H Healthy Lifestyles/ Food and Nutrition Education for Children.
28. Anon. Nutrition and Weight Status - Healthy People. Available at:
37 APPENDIX A
PRE AND POST-TEST
EAT WELL
4-H HEALTHY LIFESTYLES Pretest
You should wash your hands with cold running water and soap for at least 20 seconds. TRUE FALSE
Weight-bearing exercises, like walking or running, can help build and keep TRUE FALSE
bones healthy.
People do not need to worry about getting enough calcium in their diets until TRUE FALSE
after age 50.
Orange and green leafy vegetables are good for keeping your eyes and skin healthy. TRUE FALSE
Walking 2000 steps is equal to approximately 1 mile. TRUE FALSE
Chocolate milk and soft drinks are about the same nutritionally. TRUE FALSE
A cup of chocolate milk has the same amount of calcium as a cup of plain milk. TRUE FALSE
Four cups of water a day is enough to keep healthy. TRUE FALSE
A 12-ounce soda contains about 5 teaspoons of sugar. TRUE FALSE
If you eat more food (calories) than your body needs, the extra calories get stored TRUE FALSE
as body fat.
A small order of French fries is considered a healthy snack. TRUE FALSE
One serving of meat is about the size of a deck of cards. TRUE FALSE
Drinking orange juice is better for you than eating an orange. TRUE FALSE
It is recommended that you should be physically active throughout the day enough to TRUE FALSE
add up to 60 minutes, most days of the week.
38
EAT WELL
4-H HEALTHY LIFESTYLES Posttest
You should wash your hands with cold running water and soap for at least 20 seconds. TRUE FALSE
Weight-bearing exercises, like walking or running, can help build and keep TRUE FALSE bones healthy.
People do not need to worry about getting enough calcium in their diets until TRUE FALSE after age 50.
Orange and green leafy vegetables are good for keeping your eyes and skin healthy. TRUE FALSE
Walking 2000 steps is equal to approximately 1 mile. TRUE FALSE
Chocolate milk and soft drinks are about the same nutritionally. TRUE FALSE
A cup of chocolate milk has the same amount of calcium as a cup of plain milk. TRUE FALSE
Four cups of water a day is enough to keep healthy. TRUE FALSE
A 12-ounce soda contains about 5 teaspoons of sugar. TRUE FALSE
If you eat more food (calories) than your body needs, the extra calories get stored TRUE FALSE as body fat.
A small order of French fries is considered a healthy snack. TRUE FALSE
One serving of meat is about the size of a deck of cards. TRUE FALSE
Drinking orange juice is better for you than eating an orange. TRUE FALSE
It is recommended that you should be physically active throughout the day enough to TRUE FALSE add up to 60 minutes, most days of the week.
It is okay to skip breakfast if you are going to eat a big lunch. TRUE FALSE
Because of your nutrition education here at the Boys and Girls Club of Metro Atlanta, how likely are you to:
Drink more water. Less Likely Unsure More Likely
Eat a health breakfast daily. Less Likely Unsure More Likely
Eat three foods rich in calcium daily. Less Likely Unsure More Likely
Drink less sugary drinks like sweet tea and soda. Less Likely Unsure More Likely
Chose the regular size instead of the deluxe Less Likely Unsure More Likely or super size.