Genetic variations in the InterIeukin-6 (IL-6)
gene: Implication in coronary heart disease (CHD)
Le Anh Luong
A thesis submitted to the University of London for the degree of Doctor of
Philosophy
August 2002
Centre for Cardiovascular Genetics
ProQuest Number: U642507
All rights reserved
INFORMATION TO ALL USERS
The quality of this reproduction is dependent upon the quality of the copy submitted.
In the unlikely event that the author did not send a complete manuscript and there are missing pages, these will be noted. Also, if material had to be removed,
a note will indicate the deletion.
uest.
ProQuest U642507
Published by ProQuest LLC(2015). Copyright of the Dissertation is held by the Author.
All rights reserved.
This work is protected against unauthorized copying under Title 17, United States Code. Microform Edition © ProQuest LLC.
ProQuest LLC
789 East Eisenhower Parkway P.O. Box 1346
Acknowledgements
I would like to thank Professor Steve Humphries for his support, ideas and encouragement throughout this project.
I would like to thank all the members of Cardiovascular Genetics group, both pass and present for their friendship and assistant, with a special thank to Emma Hawe for all her help with the statistical aspects of this project.
Finally, I would like to thank the EU and the British Heart Foundation for their generosity in funding this project.
Declaration
Abbreviations
A
ACE = Angiotensin I converting enzyme ACTH = Adrenocorticotropic hormone
AIDS = Acquired immunodeficiency syndrome ANCOVA = Analysis of covariance
ANOVA = Analysis of variance ApoAI = Apolipoprotein AI ApoE = Apolipoprotein E APR = Acute-phase response A? = Acute phase protein AP-1 = Activated protein-1 ARC = Activated protein C
APRF = Acute phase responsive factor
ASOH = Allele-specific oligonucleotide hybridization ATI = Angiotensin II type 1 receptor
B
BMI = Body mass index
BSF-2 = B-cell stimulating factor 2
C
CABG = Coronary artery bypass graft surgery CAT = Chloramphenicol acetyl transferase CDF = Cytolytic T-cell differentiation factor C/EBPP = CCAAT/Enhancing binding protein beta CHD = Coronary heart disease
Cl = Confidence interval
CIS: Cytokine-inducible SH2 containing protein CRE = cAMP responsive element
CRP = C-reactive protein CsCl] = Caesium chloride
D
ddNTP = Dideoxyribonucleotides DEX = Dexamethasone
DGGE = Denaturing gradient gel electrophoresis DMSO = Dimethyl Sulfoxide
DNA = Deoxyribonucleic acid
E
ECG = Electrocardiogram
ECTIM = Etude Cas-Temoin de l'Infarctus du Myocarde EDTA = Ethylenediaminetetra-acetic acid
F
FBS = Fetal bovine serum
G
GRs=Glucocorticoid receptor GCs=Glucocorticoids
GRE or GR= Glucocorticoid responsive element gpl30 = 130kDa glycoprotein
H
HDL = High density lipoprotein
HMG-CoA = 3-hydroxy-3-methylglutaryl coenzyme A HPGF = Hybridoma/plasmacytoma growth factor HSF = Hepatocyte stimulating factor
HUVEC = Human umbilical vein endothelial cells
I
IFN-y = Interferon gamma IHD = Ischaemic heart disease IL-lp = Interleukin-1 beta IL-2 = Inteleukin-2
IL-3 = Inteleukin-3 IL-4 = Inteleukin-4 IL-6 = Interleukin-6 IL-10 = Interleukin-10 IL-6R = IL-6 receptor
IL-6REs = IL-6 responsive elements
IPTG = Isopropyl-1-thio-P-D-galacto-pyranoside
J
JAK/STAT = Janus/signal transducer activator of transcription
L
LDLc = Low density lipoprotein cholesterol Lp(a) = Lipoprotein (a)
LPS = Lipopolysaccharides
M
mAbs = Monoclonal antibodies
MADGE = Microtitre array diagonal gel electrophoresis MARK = Mitogen activated protein kinase
MCP-1 = Monocytes chemoattractant protein-1 MCS = Multiple cloning sites
MCSF = Macrophage colony stimulating factor MEM = Minimum essential medium
MgClz = Magnesium chloride
MGI-2 = Monocyte-granulocyte inducer type-2 MI = Myocardial infarction
MRE = Multi-response element mRNA = Messenger RNA
N
Na%EDTA = Sodium EDTA NF-IL6 = Nuclear factor IL-6 NF-kB = Nuclear factor kappa B
NPHSII = Northwick Park Heart Study II
O
OR = Odds ratio
P
PAI-1 = Plaminogen activator inhibitor type-1 PBS = Phosphate buffer saline
PCR = Polymerase chain reaction PDGF = Platelet derived growth factor PIAS: Protein inhibitor of activated STAT PLB = Passive lysis buffer
PPARa = Peroxisome proliferator activator receptor a
R
s
SD = Standard deviation SDS = sodium dodecyl suphate SEM = Standard error of the mean SH-2 = Src-homology 2
sIL-6R = Extracellular domain of IL-6 receptor SNP = Single nucleotide polymorphism
SOCS = Suppressor of cytokine signalling SRE = Serum response element
SSCP = Single stranded conformational polymorphism ss DNA = Single stranded DNA
STATS = Signal transducers activator of transcription-3
T
TAE = Tris acetate EDTA TAF = T-cell activating factor TBE = Tris borate EDTA
TDI = Template directed dye terminator incorporation TE = Tris EDTA
TF = Tissue factor
TGF-3 = Tumor growth factor-P
TGGE = Temperature gradient gel electrophoresis TIMP-1 = Tissue inhibitor of metalloproteinases-1 TME = Tris-MES-EDTA
TNFa = Tumor necrosis factor alpha
TP A = 12-0-tetredecanoylphorbol-13-acetate
W
WHO = World health organization
WOSCOPS= West of Scotland Coronary Prevention Study Wt = Wild-type
X
Abstract
Interleukin-6 (IL-6) is an inflammatory cytokine that plays an important role in the pathogenesis of coronary heart disease (CHD) such as atherosclerosis. Single stranded conformational polymorphism (SSCP) was used to screen for genetic variations in the 5’- untranslated and coding regions of the human IL-6 gene. Three novel variants were identified, a wobble position in codon F201 (TTT>TTC), -627C>A, and -572G>C (frequency o f rare allele=0.04, 0.01 and 0.05 respectively), plus also the reported - 597G>A, the AnTn tract (-392 to -373) and the -174G>C promoter variants. The -174G>C and -597G>A variants were in strong allelic association with each other (delta=0.94). Functional properties of the IL-6 -174G>C and -572G>C variants were examined in hepatocyte cell lines (HepG2 and HuH7) using a dual luciferase reporter assay system. The -174C variant was associated with higher relative promoter strength than the -174G variant over a 24 hours time course period after dexamethasone (DEX) repression or IL- ip plus DEX induction in both HepG2 and HuH7 cells. The -572C variant also gave higher promoter activity than the -572G variant in response to the same stimulus and time periods in these cells. When the glucocorticoid response element (GRE) at position -557 to -552 was destroyed by mutation, the -572G promoter construct in HuH7 cells no longer showed repression by DEX and had higher induction from IL-lp plus DEX compared to the wild-type -572G variant. No promoter activity difference was found for the -572C GRE knockout compared to the -572C wild type variant. This suggests that the impact of the -572G>C variant is not acting via GRE-related mechanisms.
Table of Contents
Pages
Acknowledgements... 3
Declaration... 3
Abbreviation...4
Abstract... 8
Chapter 1: Introduction...24
1.1 Atherosclerosis - An inflammatory disease... 25
1.2 Pathogenesis of Atherosclerosis... 26
1.3 Factors that induce and promote inflammation or atherosclerosis...27
1.1.1 Modified lipoproteins...27
1.3.2 Hypertension...28
1.3.3 Infections...30
1.3.4 Smoking... 30
1.4 Inflammation and IL-6...31
1.5 Structure and functions of the human IL-6 protein...38
1.5.1 Structure o f IL -6...38
1.5.2 Molecular mechanism o f ZL-6 cytokine receptor signalling... 39
1.5.3 Negative regulation o f the Uj-6/lL-6R/gpl30/Jak/STAT ignaling pathway 44 1.5.3.1 Inhibition o f STAT by PIAS...45
1.5.3.2 Feedback inhibition o f Jak/STAT pathway by SOCS proteins...45
1.5.3.3 Endocytosis o f the IL-6 receptor complex...47
1.6 Expression of the human IL-6 gene...47
1.6.1 Induction o f IL-6 gene expression...48
1.6.2 Repression o f IL-6 gene expression...50
1.6.2.1 Corticosteroids...50
1.6.2.2 Regulation o f IL-6 by hormones...50
1.6.2.2 IL-4 and IL-10...51
1.6.2.3 Fibrates... 51
1.6.3 Animal model o f IL-6 deficiency...52
1.6.4 IL-6 concentrations in hum an...52
1.7 IL-6 and its implication in coronary heart disease (CHD)... 53
1.7.1 Impaired coagulation andfibrinolysis...56
1.7.2 CRP...56
1.7.3 Connective tissue remodelling...57
1.7.4 Dyslipidaemia... 58
1.8 Atherosclerosis-complex multifactorial disease... 58
1.9 Aim of PhD... 60
Chapter 2: Identification of polymorphisms in the human IL-6 gene by SSCP and DNA Sequencing... 61
2.1 Introduction... 62
2.2 Materials...62
2.3 Methods...63
2.3.1 DNA Extractions fo r Genetic analysis...63
2.3.1.1 Cell lysis...63
2.3.1.2 Deproteinisations...63
2.3.1.3 DNA precipitation and storage...64
2.3.2 Polymerase Chain Reaction (PCR)...64
2.3.3 Single stranded conformational polymorphism (SSCP)...64
2.3.3.1 Screening fo r polymorphisms in the IL-6 gene coding regions...65
2.3.3.2 Screening fo r polymorphisms in the IL-6 promoter region...65
2.3.4 Purification o f PCR productfor DNA sequencing... 66
2.3.5 DNA Sequencing by Fluorescence Dye Terminator Technology...66
2.3.5.1 ABI Prism dRhodamine Dye Terminator Sequencing reaction...66
2.3.5.2 Purification o f cycle sequencing products...67
2.3.5.3 Preparation o f sequencing gel and loading o f samples...67
2.3.5.4 Sequencing analysis...67
2.4 Results... 68
2.4.1 IL-6 coding exons...68
2.5 Discussion... 76
2.5.1 SSCP sensitivity...76
2.5.2 Genetic variations in IL -6... 79
2.5.5 Further aim s...80
Chapter 3: Cloning, Site-directed mutagenesis and Genetic reporter gene assay.... 81
3.1 A im s... 82
3.2 M aterials...82
3.3 Methods...83
5.5.1 Cloning o f the IL-6 promoter into pGL3 Basic gene expression vector... 83
5.5.1.1 Restriction digestion and Gel extraction o f IL-6 promoter...83
5.5.1.2 Ligation and transformation o f IL-6 promoter into pGL3 Basic vector.... 85
5.5.1.2.1 Ligation o f IL-6 promoter into pBluescript SK (+/-) phagemid... 85
5.5.1.2.2 Transformation o f pBluescript SK -hIL6prom oter DNA...86
3.3.1.2.3 pBluescript SK -IL6prom oter DNA plasm id m iniprep...86
3.3.1.2.4 IL 6prom oter inpGL3 Basic vector... 86
5.5.2 Site-Erected M utagenesis... 89
3.3.2.1 Quikchange 1-day site-Erected mutagenesis...89
3.3.2.2 Sequencing IL-6 promoter constructs... 90
5.5.25 Purification o f pGL3 Basic-IL6prom oter constructs...90
3.3.2.3.1 Endotoxin Free Maxi prep protocol...90
5.5.25.2 Caesium chloride density graEent centrifugation...91
5.5.5 In vitro functional studies o f I L 6 promoter in HepG2 cells... 93
3.3.3.1 HepG2 Cell banks... 93
3.3.3.2 Cell counting...94
5.5.55 Charcoal stripping o f steroids from fe tE bovine serum (FBS)... 94
3.3.3.4 Transfection efficiency andX -gE stE ning o f HepG2 cells...94
3.3.3.5 Transient transfection o f IL-6 promoter constructs in HepG2 cells... 97
5.5.5.6 D uE Luciferase Reporter Assay...97
3.4 Results...98
3 ,4 3 Effects o f Steroids on IL-6 expression in HepG2 cells...99
3.4,4Dexamethasone dose response on IL-6 expression in HepG2 cells...102
3.4.5 IL-6 promoter expression o f -572G and -572C variants in HepG2 cells...103
3.4.5.1 Effects o f IL-6 -572G and -572C egression by stimuli...103
3.4.5.2 Time course response o f the IL-6 -572G and -572C expression by stimuli ...104
3.4.6 Expression o f IL-6 -597GA174G and -597A/-174C constructs in HepG2 cells ...107
3.4.61 Effects o f -597G/-174G and-597A/-174Cconstructs by stimuli...107
3.4.62 Time course response o f the IL-6 -597G/-174G and -597AA174C by stimuli 108 3.5 Discussion...I l l 3.5.1 Transfection efficiency o f DNA plasmid in HepG2 cells...I l l 3.5.2 IL -ip dose response o f IL-6 promoter activities in HepG2 cells... I l l 3.5.3 Inhibition by steroids on IL-6 promoter expression in HepG2 cells...112
3.5.4 Dexamethasone dose response o f IL-6 promoter expression in HepG2 cells .113 3.5.5 IL-6 promoter expression o f -572G and -572C in response to stimuli... 113
3.5.6 IL-6 promoter expression o f -597G/-174G and -597A/-174C by stim uli 114 Chapter 4: In vitrofunctional studies of IL-6 promoter constructs in HuH7 cells .116 4.1 Aim s... 117
4.2 Materials... 117
4.3 Methods... 117
4.3.1 Transfection o f IL-6 promoter in HuH7 cells...117
4.4 Results... 118
4.4.1 Transfection efficiency o f HuH7 hepatoma cells...118
4.4.2 IL-6 -572G and-572C expression in H uH7ce... 119
4.4.3 IL-6 -597G/-174G and-597A/-174C expression in H uH 7cells...122
4.5 Discussion...126
4.5.1 Transfection efficiency in HuH7 cells...126
4.5.2 IL-6 -572G>C expression in response to stim ulus...126
Chapter 5: Genotyping and Association studies... 129
5.1 Introduction and Aim... 130
5.2 Materials... 130
5.3 Methods... 130
5.3.1 Genotyping assays fo r IL~6 promoter polymorphisms... 130
5.3, L 1 Genotyping o f the IL-6 —1 74G>C promoter polymorphism...130
5.3.L2 Genotyping o f the IL-6 -572G>C promoter polymorphism...131
5.3.2 Population based study...132
5.3.2.1 Subjects in NPHSII...132
5.3.2.2 Biochemical measurements...133
5.3.2.3 IL-6 genotyping in NPHSII....133
5.4 Statistical methods... 133
5.5 Results... 134
5.5.1 IL-6 -1 74G>C and -5 72G>C genotypes...134
5.5.2 NPHSII studies... 136
5.5.2.1 Risk characteristics o f the sam ple...136
5.5.2.2 Genotype distribution in controls and cases... 136
5.5.2.3 Genotypes and inflammatory risk markers...139
5.5.Z4 CRP, blood pressure and genotype... 140
5.6 Discussion... 145
5.6.1 Single nucleotide polymorphism (SNP) genotyping...145
5.6.2 IL-6 genotype and risk traits...147
5.6.2.1 NPHSII study... 147
5.6.2.2 IL-6 -5 72G>€ genotype...147
5.6.2.3 IL-6 -1 74G>C genotype...148
5.6.3 IL-6 -1 74G>€ and in vitro reporter gene expression... 150
5.6.4 IL-6 -1 74G>C mechanism o f effects on CRP, fibrinogen and blood pressure152 5.6.4.1 CRP and fibrinogen...152
5.6.4.2Blood pressure...152
Chapter 6: IL-6 polymorphisms and Coronary heart disease (CHD) risk in the
HIFMECH study... 158
6.1 Introduction and aim s...159
6.2 Materials and Methods... 160
6.2.1 IL~6 genotyping... 160
6.3.2 Subjects: HIFMECH stutfy...160
6.3.3 Biochemical measurements... 160
6.3.4 Genotyping the IL-6 -1 74G>€ and-572G>C... 161
6.3.5 Statistical analysis...161
6.4 Results...162
6.4.1 Personal and lipid risk characteristics in HIFMECH.... 162
6.4.2 IL-6, fibrinogen and CRP in cases and control by North-South and by centres ...163
6.4.3 IL-6 genotype distribution and risk in HIFMECH...165
6.4.3.1 IL-6 -1 74G>C and-572G>C allele distribution...165
6.4.3.2 IL-6 genotypes and CHD risk...165
6.4.3.3 IL-6 genotypes, smoking status and risk... 166
6.4.4 Genotypes and inflammatory risk m arkers... 175
6.4.4.1IL-6-174G>C...175
6.4.4.2 IL-6-572G>C... 175
6.4.5 IL-6 genotypes and smoking, blood pressure and IL-6 levels...176
6.4.6 IL-6 genotype, IL-6 levels and B M Itertile... 177
6.5 Discussion... 186
6.5.1 HIFMECH study and CHD risk...186
6.5.2 IL-6 genotype and CHD risk...187
6.5.3 IL-6 genotype and plasma IL-6, fibrinogen and CRP... 189
6.5.4 IL-6 -1 74G>C and -572G>C, plasma IL-6, blood pressure and B M I... 190
6.5.5 IL-6 genotype and blood pressure...191
Chapter 7: Molecular mechanism of the IL-6 -S72G>C prom oter polymorphism in hepatocyte... 193
7.2 M aterials...196
7.3 Methods... 196
7.3.1 GRE knockouts fo r the IL-6 -572G and -572C constructs... 196
7.3.3 Functional studies...197
7.3.3.1 GRE knockout o f -572 variant... 197
7.4 Results... 198
7.4.2 Functional effects o f the GRE knockouts fo r the IL-6 -572G and -572C variants... 198
7.4.2.1 Effects o f the IL-6 -572G versus -572C... 198
7.4.2.2 IL-6 -572G vs GRE knockout o f -S72G...199
7.4.2.3 IL-6 -572C vs GRE knockouts fo r -572C... 200
7.5 Discussion... 202
7.5.1 I L 6 -572G wild-type versus GRE knockout in HuH7 cells... 202
7.5.2 IL-6 -572C versus GRE knockout o f -572C in HuH7 cells...202
Chapter 8: Conclusions...204
Chapter 9; Future works...208
9.1 Functional studies...209
9.2 Association studies...209
9.3 IL-6A„T„ tract... 210
References...211
Appendix...251
List of Tables
Page
Table 1.1 Pleiotropic Functions of IL -6... 33
Table 1.2.1 IL-6 -174G>C genotype and CHD risk factors levels in the Goodinge study 37
Table 1.2.2 IL-6 -174G>C genotype and CHD risk factors levels in patients with AAA 37
Table 1.3 Allelic frequencies of the IL-6 -174C in different ethnic groups...37
Table 1.4 Location of amino acids residues in the IL-6 protein structure... 39
Table 1.5 Analysis of IL-6 activity and binding properties by site-directed mutagenesis 40
Table 1.6 IL-6 response elements identified in acute phase protein gene... 44
Table 1.7 Adjusted relative risks of future myocardial infarction among apparently healthy men according to baseline level of IL-6 from the Physician Health Studies... 55
Table 3.1 IL-6 promoter variants cloned into pGL3 Basic luciferase reporter gene
expression vector... 93
Table 3.2 Transfection efficiency of pSV-P-Galactosidase control vector plasmid in HepG2 cells with LIPOFECTIN reagent... 98
Table 3.2.1 Mean (±SEM) promoter activities for the IL-6 -572G and -572C promoter constructs in HepG2 cells stimulated with DEX or IL-ip plus DEX for 9 hours...106
Table 3.3 Mean (±SEM) promoter activities for the IL-6 -597G/-174G and -597A/-174 constructs in HepG2 cells stimulated with DEX or IL-ip plus DEX for 9 hours...110
Table 4.1 Transfection efficiency of pSV-P-Galactosidase control vector DNA in HuH7 cells with LIPOFECTIN reagent...118
Table 5.1 Mean (±SD) baseline characteristics by coronary heart disease event status in
NPHSn... 137
Table 5.2 Carrier frequencies and means (±SD) of baseline characteristics by coronary heart disease event status in NPHSII...137
Table 5.4 Correlation between CRP (C-reactive protein) and coronary heart disease risk factors in 564 NPHSII men...144
Table 5.5 Mean (±SEM) CRP and systolic blood pressure in men with different IL-6 - 174G>C genotype... 144
Table 5.6 CHD risks of IL-6 -174 GC+CC vs CC genotypes in population studies 150
Table 6.1 Baseline characteristics of healthy men (controls) and MI survivors (cases) (Mean (±SD) Number) in HIFMECH study... 164
Table 6.2 IL-6 -174G>C and -572G>C genotype distribution in HIFMECH study 170
Table 6.2a Unadjusted and adjusted odds ratio (95% Cl) associated with IL-6 -174G>C genotype in smokers and nonsmokers (current+ex) by North and South regions in the HIFMECH study in healthy subjects (controls) and M survivor (cases)... 174
Table 6.3 Unadjusted mean (±SD) concentrations for plasma IL-6, fibrinogen, CRP, and diastolic and systolic blood pressure with IL-6 -174G>C genotype in healthy controls and MI survivor (cases) by North-South in the HIFMECH study... 178
Table 6.4 Unadjusted mean (±SD) concentrations for plasma IL-6, fibrinogen, CRP, diastolic and systolic blood pressure for IL-6 -572G>C genotype in healthy controls and MI survivors (cases) by North-South in the HIFMECH study... 180
Table 6.5 Proportion of MI survivors in the HIFMECH study on lipid lowering, blood pressure lowering or anti-inflammatory drugs in the North and South of Europe... 184
Table 7.1 IL-6 -572G>C promoter variants and glucocorticoid responsive element (GRE) knockout for -572G>C variants...197
Table 7.2 Relative promoter strength of GRE knockout for IL-6 -572G and -572C promoter variants (n=8) in HuH7 cells. Values are expressed as percentages and
comparison made relative to the -572G variant at basal (set at 100%)... 201
APPENDIX
Table 1 PCR primers for amplification of exons 1-5 in the human IL-6 gene...251
Table 2 SSCP primers for amplification of the human IL-6 5’-untranslated region... 251
Table 3 Site-directed mutagenesis oligonucleotide primers of human IL-6 promoter region...252
Lists of Figures
Page
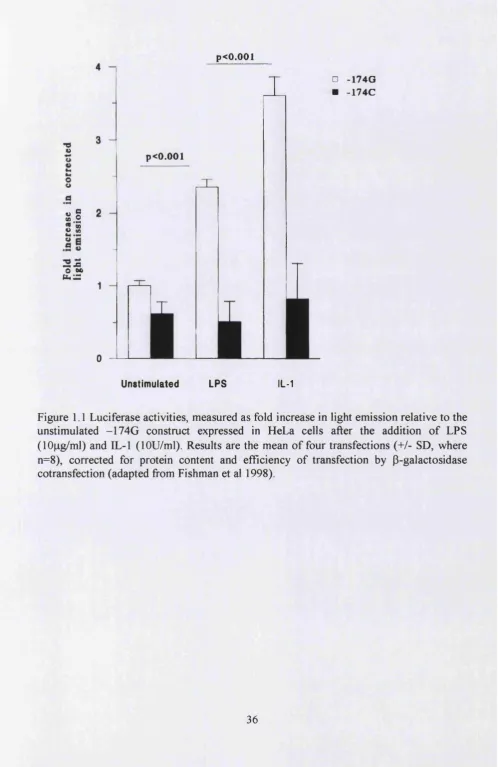
Figure 1.1 Luciferase activities, measured as fold increase in light emission relative to the unstimulated -174G construct expressed in HeLa cells after the addition of LPS
(lOng/ml) and IL-1 (lOU/ml)... 36
Figure 1.2 Ribbon representation of the IL-6 crystal structure...38
Figure 1.3 Ribbon representation of the IL-6, IL-6R and gpl30 hexamer signal model.. 42
Figure 1.4 Two pathways fi'om gpl30 to acute phase protein gene expression. Homodimerization of gpl30 activates the STAT3/APRF pathway and Ras-MAPK cascade...43
Figure 1.5 Negative regulation of the IL-6-type cytokine signal transduction pathway... 45
Figure 1.6 Molecular mechanism by which SOCS proteins negatively regulate cytokine signaling...46
Figure 1.7 (a) Intron-exon structure of human IL-6 gene and (b) schematic summary of the potential regulatory elements in the 5’-flanking regions of the human IL-6 gene 48 Figure 1.8 Transcriptional control motifs identified in the IL-6 promoter... 49
Figure 1.9 Central role of IL-6 and its effect on the development of CH D... 54
Figure 1.10 Median IL-6 levels in healthy men, MI survivors and unstable angina patients ... 55
Figure 2.1 Schematic representations of the human Interleukin-6 (IL-6) gene coding regions...65
Figure 2.2 Schematic representation of the IL-6 promoter region. The three known polymorphisms are shown (-597G/A, AnTn tract and -174G/C) and the three overlapping SSCP primers use for identifying SSCP variants... 66
Figure 2.3(a) SSCP of IL-6 exon-1 gene...69
Figure 2.3(b) SSCP of IL-6 exon-5 gene...70
Figure 2.3(c) DNA Sequencing of Exon-5 SSCP variant... 70
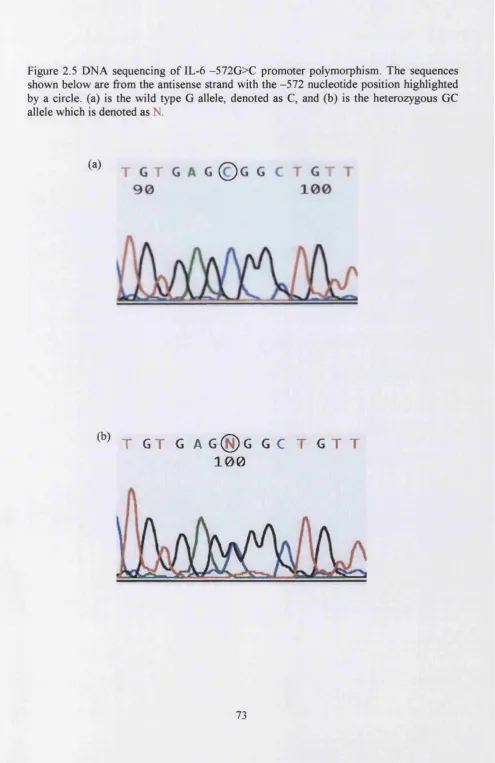
Figure 2.5 DNA sequencing of the IL-6 -572G>C promoter polymorphism...73
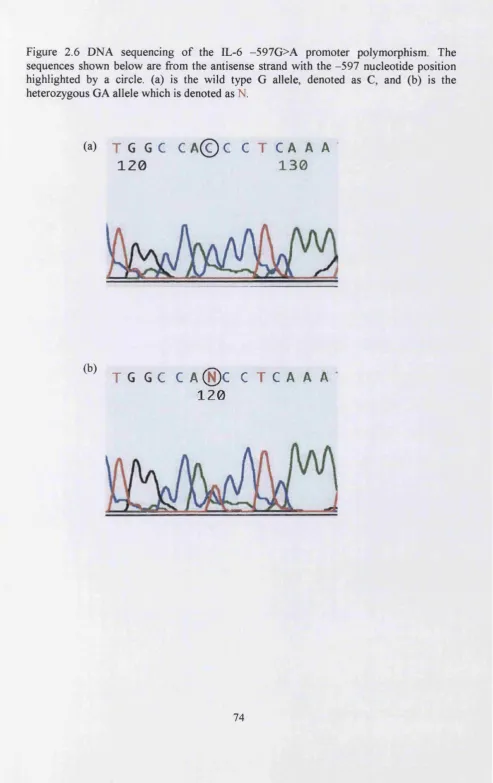
Figure 2.6 DNA sequencing of the IL-6 -597G>A promoter polymorphism...74
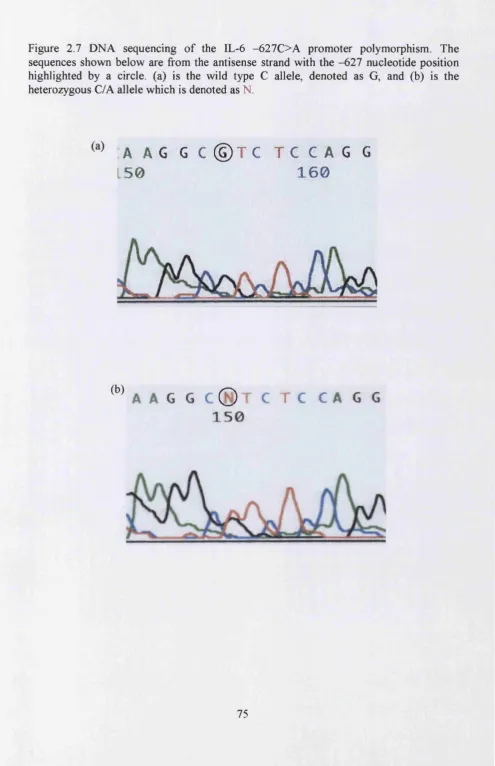
Figure 2.7 DNA sequencing of the IL-6 -627C>A promoter polymorphism...75
Figure 2.8 SSCP of the human IL-6 promoter region -766 to -472 with (a) TBE buffer and (b) TME buffer... 78
Figure 3.1 The IL-6 insert (a) from -1180 to +2000 denoted as B672A cloned into (b) BamHI sites in the pGEM-3 vector... 84
Figure 3.2 Subcloning of B672A (-1180 to +13) in pBluescript SK (+/-) phagemid vector ... 87
Figure 3.3 Cloning of human IL-6 -627C/-597G/-572G/AgT i i/-l 74G promoter construct into pGL3 Basic luciferase expression vector... 88
Figure 3.4. Overview of the QuikChange 1-day site-directed mutagenesis method 92
Figure 3.5 (a) One chamber of a hemocytometer slide under lOX objective and lOX ocular. The chamber is divided into 9 major squares, (b) Detailed view of one of the 9 major squares... 94
Figure 3.6 Circular map of (a) pSV-P-Galactosidase control vector and (b) pRL-TK Renilla vector... 96
Figure 3.7 IL-ip (IL-1 beta) dose response of pGL3 Basic IL-6 promoter variants -597G/- 174GinHepG2... 99
Figure 3.8(a). Effects of steroids on promoter expression of IL-6 -572G and -572C variants in HepG2 cells containing 10% FBS and 10% Charcoal stripped FBS in the presence or absence of lOOU/ml IL-ip for 9 hours...101
Figure 3.8(b). Fold difference of IL-6 -572G versus -572C promoter variants in HepG2 cells stimulated with lOOU/ml IL-ip from basal...101
Figure 3.9 Dexamethasone (DEX) dose response of the pGL3 Basic IL-6 -627G/-597G/- 572G/-174G promoter variant in HepG2 cells... 102
Figure 3.10 Dexamethasone (DEX) and IL-ip plus DEX stimulation of IL-6 -572G and - 572C promoter variants in HepG2 cells for 8 hours...103
Figure 3.12 Dexamethasone (DEX) and IL-ip (IL-lbeta) plus DEX stimulation of the IL- 6 -597G/-174G and -597A/-174C promoter variants in HepG2 cells for 8 hours 107
Figure 3.13 Time course of transient transfections of the IL-6 -597G/-174G and -597A/- 174C promoter variants in HepG2 cells at (a) basal, (b) with DEX (5 X lO'^M) or (c) DEX (5X IC'^M) and IL-lp (IL-lbeta)(100U/ml)...109
Figure 4.1 Time course of IL-6 -572G and -572C promoter variant expression in HuH7 cells at (a) basal, (b)with DEX (5 X lO'^M) or (c) IL-lp (lOOU/ml) plus DEX (5X lO'^M)
121
Figure 4.2 Promoter activities for pGL3 Basic IL-6 -572G and -572C promoter construct (second DNA plasmid preparation) in HuH7 cells at basal and after stimulation with DEX or IL-1 P plus DEX for 12 hours...122
Figure 4.3 Time course of IL-6 -597G/-174G and -597A/-174C promoter construct expression in HuH7 cells at (a) basal, (b) with DEX (5 X lO'^M) or (c) IL-lp (lOOU/ml) plus DEX (5X lO'^M)... 124
Figure 4.4 Time course of IL-6 -597G/-174G and -597A/-174C promoter construct expression in HuH7 cells at (a) basal, (b) with DEX (5 X 10‘^M) or (c) IL-ip (lOOU/ml) plus DEX (SXIO’^M)... 125
Figure 5.1 IL-6 -174G>C promoter polymorphism genotype... 135
Figure 5.2 IL-6 -572G>C promoter polymorphism genotype... 135
Figure 5.3 Graph of the estimated survivor fimctions fi'om the Cox’s proportional hazard model stratified by IL-6 -174G>C genotype... 138
Figure 5.4 Hazard ratios (95% Cl) associated with IL-6 genotypes in non-smokers and smokers after adjusting for age, clinic, BMI, systolic blood pressure, cholesterol,
triglyceride and fibrinogen levels at baseline... 138
Figure 5.5 Relationship between -174G>C genotype and (a) systolic blood pressure, (b) diastolic blood pressure and (c) fibrinogen levels at baseline in smokers and nonsmokers (ne vertex)...142
Figure 5.6 Relationship between systolic blood pressure and -174G>C genotype men in different tertiles of BMI... 143
Figure 5.7 Relationship between diastolic blood pressure and IL-6 -174G>C genotype men in different tertile of BMI...143
Figure 5.9 Proposed mechanisms for the involvement of IL-6 on blood pressure 157
Figure 6.1 Unadjusted mean (+SEM) plasma concentrations for (a) IL-6, (b) fibrinogen and (c) CRP in controls and cases North and South of Europe... 167
Figure 6.2 Mean (±SEM) plasma concentrations for (a) IL-6, (b) fibrinogen and (c) CRP in controls and cases from Stockholm, London, Marseille and San GRotondo 168
Figure 6.2.1 Correlation of IL-6 levels with fibrinogen levels in the HIFMECH study. 169
Figure 6.2.2 Correlation of IL-6 levels with CRP levels in the HIFMECH study 169
Figure 6.3 Rare allele fi'equencies (95% Cl) by centres for IL-6 -174C in HIFMECH study... 171
Figure 6.4 Rare allele fi’equencies (95%) by centres for IL-6 -572C in HIFMECH study ...172
Figure 6.5 Odds ratio (95% Cl) associated with IL-6 genotypes in HIFMECH study by North or South of Europe... 173
Figure 6.6 Odds ratio (95% Cl) associated with IL-6 -174G>C genotype in nonsmokers and smokers (current+ex) by North or South regions in the HIFMECH study... 173
Figure 6.7 Mean (±SEM) concentrations of plasma EL-6 with IL-6 -174G>C genotype in MI survivors (cases) fi'om Marseille, San G Rotondo and both centres combined (ALL) in the HIFMECH study... 179
Figure 6.8 Mean (+SEM) concentrations of serum fibrinogen with IL-6 -174G>C genotype in MI survivors (cases) fi'om Marseille, San G Rotondo and both centres
combined (ALL) in the HffMECH study... 179
Figure 6.9 Mean (+SEM) systolic blood pressure in healthy control men with IL-6 - 572G>C genotype by centres and all centre combined (ALL) in the HIFMECH study. 181
Figure 6.10 Plasma EL-6 concentrations in nonsmokers and smokers (current+ex) by IL-6 -174G>C genotype adjusted by centres... 181
Figure 6.11 Plasma IL-6 concentrations in nonsmokers and smokers (current+ex) by EL-6 -572G>C genotype adjusted by centres... 182
Figure 6.13 Relationship between systolic blood pressure and IL-6 -572G>C genotype in healthy control men by tertile o fB W (adjusted for smoking and centres)... 185
Figure 6.14 Relationship between diastolic blood pressure and IL-6 -572G>C genotype in healthy control men by tertile for BMI (adjusted of smoking and centres)... 185
Figure 7.1 Schematic representation of the human IL-6 promoter...194
Figure 7.2 Proposed mechanisms for repression of IL-6 gene transcription of (a) -572G and (b) -572C variants by glucocorticoids (GCs)-glucocorticoid receptor complex in hepatocytes... 195
Figure 7.3 Promoter activities of IL-6 -572G vs -572G constructs in HuH7 cells. Cells were stimulated with DEX (5X10⁻⁷M) and IL-ip (lOOU/ml) plus DEX (5X10⁻⁷M) for 12 hours... 198
CHAPTER 1
Chapter 1: Introduction
1.1 Atherosclerosis - An inflammatory disease
1.2 Pathogenesis of Atherosclerosis
During the 19^ century, two theories were proposed for the pathogenesis of atherosclerosis. The ‘incrustation theory’ proposed by the pathologist von Rokitansky, suggested that arterial thickening was due to the deposition o f fibrin from arterial blood (von Rokitansky 1844) and the ‘lipid infiltration’ theory by Virchow (Virchow 1856), which proposed that lipid infiltration in the arterial wall followed by complex formation with mucopolysaccharides was the initial event in atherosclerosis. Numerous pathophysiological observations in humans and animals have led to the formulation of the ‘response-to-injury’ hypothesis (Ross and Glomset 1973), where endothelial denudation, was cited as the first step in atherosclerosis. The most recent version of this hypothesis emphasizes endothelial dysfunction rather than denudation, where injury to the arterial wall leads to the initiation of compensatory processes by the endothelium, which then alters the normal vascular homeostatic properties o f the artery wall. Endothelial dysfunction resulting from injury can then lead to increased adhesiveness of the endothelium to leukocytes and platelets as well as its permeability. Injury also induces the endothelium to have procoagulant instead of anticoagulant properties and increased production of endothelium derived vasoactive molecules, cytokines and growth factors. If left unabated, this can lead to the migration and proliferation of smooth muscle cells to the area contributing to advanced, complicated atherosclerotic lesions (Ross 1999). The erosion or uneven thinning that precedes plaque rupture, principally occurring at the shoulders of the fibrous cap where the mechanical stress exceeds that which the tissue can withstand (Richardson et al 1989; Loree et al 1992; Lee and Libby 1997). The atherosclerotic plaque is weakest here due to low collagen composition resulting from increased collagen degradation by collagenases, elastases and stromelysins, and the infiltration of macrophages and T-cells across the endothelium which increases and promotes plaque instability (Galis et al 1994; Schonbeck et al 1997). In addition, the lipid core is a source of prothrombotic materials in which tissue factor and coagulation factors have been found both in the necrotic core and cellular areas of the plaque in humans, further increasing the possibility of thrombosis (Femandez-Ortiz et al 1994; Nemerson
1.3 Factors th at induce and promote inflammation or atherosclerosis
1,3,1 Modified lipoproteins
(TNFa), interleukin-1 (IL-1), MCSF and MCP-1 secreted from monocyte-derived macrophages and T-lymphocytes can increase LDL binding to the endothelium and promote the migration and proliferation of smooth muscle cells around the atherosclerotic lesion core of lipid and necrotic tissues (Stopeck et al 1993; Hajjar and Haberland 1997; Geng and Libby 1995). The build-up of lipid core and necrotic tissue within the fibrous cap, if large enough, can restrict blood flow and reduce the supply of nutrients to tissues, resulting in ischaemia. To compensate for this, blood pressure rises to increase flow rate, which results in erosion and uneven thinning o f the fibrous cap. As a consequence of this, plaque instability occurs around the shoulders of the lesion where macrophages enter, accumulate and are activated into foam cells. It is here that the expression of cytokines, chemokines, growth factors and apoptosis may occur (Davies 1990; Fuster 1994; Lee and Libby 1997; Ross 1999), thus fueling a vicious cycle o f inflammation within the arterial wall
Oxidized LDL is expressed in the atherosclerotic lesions in both humans and animals (Yla-Herttuala et 1989). Antioxidants can reduce the size o f lesions and fatty streaks in animals with hypercholesterolemia and in nonhuman primates (Navab et al 1996; Carew et al 1987; Kita et al 1987; Sasahara et al 1994; Chang et al 1995). The antioxidant vitamin E has been shown to increase the resistance of human LDL to oxidation (Reaven et al 1993). Vitamin E intake is inversely correlated with the incidence of MI, and vitamin E supplements reduce coronary events in several preliminary trials (Rimm et al 1993; Stampfer et al 1993; Stephens et al 1996), but not in others (Mezzetti et al 2001; Pruthi et al 2001; Kromhout 2001; Kaul et al 2001). This is in contrast to other antioxidants such as beta carotene which has no effect on reducing oxidation of LDL or coronary events (Reaven et al 1993; Hennekens et al 1996; Omenn et al 1996).
1,3,2 Hypertension
properties by increasing the formation of hydrogen peroxide and free radicals such as superoxide anion and hydroxyl radicals in plasma (Griendling and Alexander 1997; Lacy et al 1998; Swei et al 1997). These substances in turn reduce the effect of vasodilation by nitric oxide on the endothelium (Vanhoutte and Boulanger 1995), increase leukocyte adhesion and increase peripheral resistance in the lumen of the artery (Swei et al 1997).
Angiotensin H, (a product of the renin-angiotensin cascade) is well recognized as a potent vasoconstrictor that causes atherosclerosis and hypertension (Dzau 1994; Walker et al 1979; Carluccio et al 2001). In addition to causing hypertension, angiotensin II can also contribute to atherogenesis by increasing smooth muscle contraction through increase in intracellular calcium, protein synthesis, smooth muscle cell hypertrophy and lipoxygenase activity, which promote inflammation through the oxidation of LDL (Campbell et al 1991; Gibbons et al 1992; Rossi et al 1995; Chobanian and Dzau 1996; Natarajan et al 1997). The expression of angiotensinogen, a precursor of angiotensin II is upregulated by IL-6 during the inflammatory process (Itoh et al 1989; Ohtani et al 1992; Takano et al 1993; Sherman and Brasier 2001). Angiotensin II acts through the angiotensin II type 1 receptor (ATI) involving the Janus kinase/signal transducers activator of transcription (JAK/STAT, also referred as Jak/STAT) pathway and intercellular calcium ions to upregulate IL-6 ((Funakoshi et al 1999; Han et al 1999), thus prolonging the inflammatory process.
turbulence of blood flow through specific arterial sites, inducing injury to the endothelial lining of blood vessels (Gotlieb and Langille 1996). This injury induces platelet adhesion to the dysfunctional endothelium and stimulates proliferation and migration of smooth muscle cells to repair the damaged arterial wall (Ross 1993; 1999; Bombeli et al 1998). As a result, the rate of clearance of lipoproteins fi"om the vessel wall may be reduced, therefore increasing the vessel wall susceptibility to plaque formation and escalating the risk of thrombosis (Mach et al 1997; Thompson et al 1995).
13,3 Infections
The infectious microorganisms, herpes virus and Chlamydia pneumonia have been implicated with atherosclerosis (Libby et al 1997; Jackson et al 1997). These organisms have been demonstrated at autopsy to be present in the atheromatous lesions in coronary arteries (Hendrix et al 1990; Jackson et al 1997) and titers of antibodies to these organisms are reported to be predictors of CHD risk in ME patients (Throm et al 1991; Melnick et al 1993; Gupta et al 1997). At present there is no direct evidence to suggest these organisms cause the lesion of atherosclerosis (Libby et al 1997; Hajjar et al 1986; Nicholson and Hajjar 1998). However, it may be possible that infection, combined with other factors, plays a pivotal role in the development of the atherosclerotic lesion (Libby et al 1997; Danesh et al 1997).
1,3,4 Smoking
Atherogenic effects from smoking may result from endothelial dysfunction. Endothelial damage to tissues in the lung from smoking can increase oxidative stress on plasma lipoproteins (Griendling and Alexander 1997; Lacy et al 1998; Jonasson et al 1986; van der Waal et al 1989). Smoking reduces levels of antioxidant vitamins and increases levels of oxidized LDL (Heitzer et al 1996a; 1996b; Harats et al 1989; 1990; Schefïler et al 1990; 1992; Morrow et al 1995), and is associated with lipid abnormalities, such as lower levels o f HDL and ApoAI (Peacock et al 1997) and higher levels for LDL and triglycerides in smokers compared to nonsmokers (Craig et al 1989; Cuesta et al 1989). The incidence of arterial thrombosis is increased in smokers being associated with raised plasma fibrinogen, factor VII activity, prothrombin fragment 1+2 and impaired endogenous fibrinolysis (Rugman et al 1994; Miller et al 1998; Newby et al 1999; 2001) thereby favoring a procoagulant state. Finally, smoking also promotes atherogenesis via mediators of inflammation such as IL-6 and CRP. Elevated plasma levels of IL-6 and CRP are associated with risk of coronary events (Koenig et al 1999; Ridker et al 2000a; 2000b; Doggen et al 2000; Mendall et al 2000).
1.4 Inflammation and IL-6
Inflammation is a physiological response to tissue injury, trauma and infection and consists of a systemic reaction to combat further tissue damage, destroying infective organisms and activating repair processes. The early stage of inflammation, during which metabolic and catabolic changes occur in many organs, is known as the acute-phase response (APR). The APR is characterised by changes in the levels of serum acute-phase (AP) proteins, which are synthesised primarily in the liver. Serum concentrations of some AP proteins can increase as much as 1,000-fold several hours after the onset of the APR (Steel et al 1994). Activation of AP genes in hepatocytes is triggered by several inflammatory signals, including those of IL-6, IL-1, TNF-a and interferon gamma (IFN-
serum IL-6 and changes in AP gene expression during the inflammatory response, the large number of AP proteins synthesised in response to IL-6, and the observation that APR is impaired in mice lacking IL-6 (Poli and Ciliberto 1994).
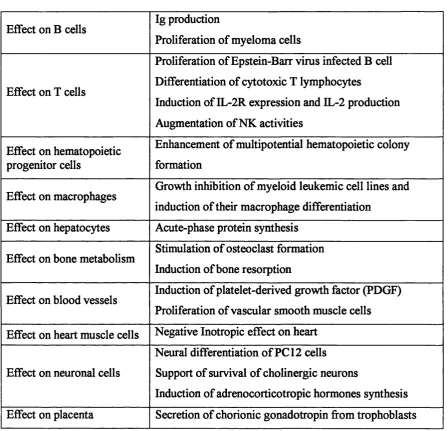
Interleukin-6 (IL-6) is a multifunctional cytokine that participates in the regulation of acute-phase reactions, immune responses and haematopoiesis (Andus et al 1987; Gauldie et al 1987; Sehgal et al 1989). Abnormal expression of IL-6 may be involved in the pathogenesis of a variety of diseases including multiple myeloma, rheumatoid arthritis, post-menopausal osteoporosis, chronic autoimmune diseases, Castleman’s disease and acquired immunodeficiency syndrome (AIDS) (Akira et al 1993). The pleiotropic functions of IL-6 are summarised in table 1.1
Table 1.1 Pleiotropic Functions of IL-6 (adapted from Kishimoto et al 1995).
Effect on B cells Ig production
Proliferation of myeloma cells
Effect on T cells
Proliferation of Epstein-Barr virus infected B cell Differentiation of cytotoxic T lymphocytes
Induction of IL-2R expression and IL-2 production Augmentation of NK activities
Effect on hematopoietic progenitor cells
Enhancement of multipotential hematopoietic colony formation
Effect on macrophages Growth inhibition of myeloid leukemic cell lines and induction of their macrophage differentiation
Effect on hepatocytes Acute-phase protein synthesis
Effect on bone metabolism Stimulation of osteoclast formation Induction of bone resorption
Effect on blood vessels Induction of platelet-derived growth factor (PDGF) Proliferation of vascular smooth muscle cells Effect on heart muscle cells Negative Inotropic effect on heart
Effect on neuronal cells
Neural differentiation o f PC 12 cells Support of survival of cholinergic neurons
Bowcock et al 1988; 1989, using restriction fragment length polymorphism (RFLP) have identified an AT rich polymorphic hypervariable region ~450bp from the polyadenylation site and an Alu repetitive DNA element in intron 4 of the human IL-6 gene. This hypervariable region is associated with bone mineral density in which elevated IL-6 levels correlate with greater bone mass loss (Murray et al 1997). Recently, Fishman et al 1998 reported several promoter polymorphisms in the IL-6 gene. This study reported a base G>C transition at position -174, where the C allele creates an NlalQ or Hsp92II restriction site. The frequency of the rare C allele in healthy Caucasians was 0.40 and was associated with lower IL-6 promoter activity in HeLa cells. The second reported polymorphism is the AnTn tract at position -395 to -375 with variable numbers of A and T runs. The AgTn is associated with -174C allele and the A9T1 1, AioTio and AioTn is
associated with -174G allele.
p<0.001
a>
I I
I S
p<0.001
n -174G ■ -174C
U nstim ulated LPS IL-1
Table 1.2.1 IL-6 -174G>C genotype and CHD risk factors levels in healthy Caucasians (Goodinge study) (Dr Faulds, personal communication).
CHD risk traits GG (n—35) GC (n=45) CC (n=22) IL-6 (pg/ml)
Non-smokers 1.84 2.45 1.49
Smokers 5.54 3.06 1.62*
CRP (pg/ml) 1.20 1.09 0.80
PAI-1 (pg/ml) 106.3 (8.5) 95.1 (6.6) 82.9 (7.5)
"p<0.01
Table 1.2.2 IL-6 -174G>C genotype and CHD risk factors levels in patients with abdominal aortic aneurysms (AAA) (adapted from Jones et al 2001).
CHD risk traits GG (n—146) GC (n=245) CC (n=75) IL-6 (pg/ml) median
(IQR)
1.9 (0-106) 4.8 (0-126) 15.6 (0.5-215)*
InCRP (ng/ml). 4.1+0.9 4.2±0.9 4.1+1.0 Fibrinogen (g/1) 4.35+1.36 4.31+1.38 4.46+1.41
*p<0.047, IQR=interquartile range
Values for continuous variable are mean±SD, except for median IL-6, for which the Krustal-Wallis p value is given.
Table 1.3 Allelic frequencies of the IL-6 -174C in different ethnic groups (Dr Faulds, personal communication).
Frequency C allele 95% C l
Caucasian 0.400 0.37-0.43
Gujarati Indian 0.15 0.09-0.18 Afro-Caribbean 0.05 0.02-0.07
Chinese 0.07 0.05-0.09
Primate (e.g. Gorilla and Chimpanzee)
1.5 Structure and functions of the human IL-6 protein
1.5.1 Structure o f IL-6
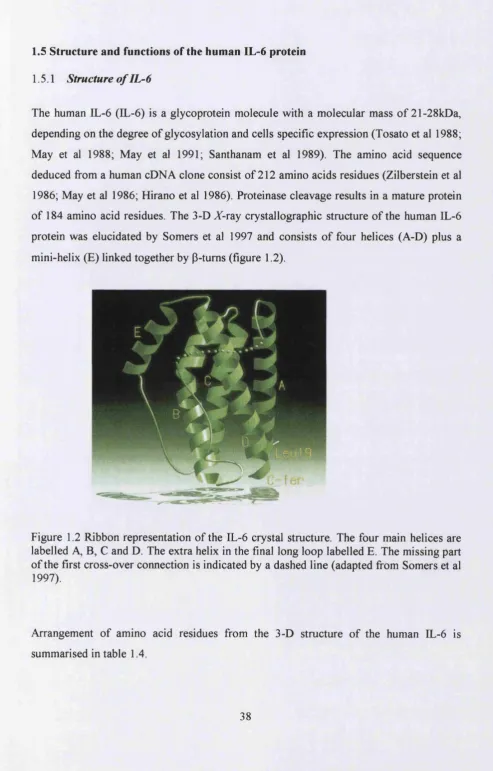
The human IL-6 (IL-6) is a glycoprotein molecule with a molecular mass of 21-28kDa, depending on the degree of glycosylation and cells specific expression (Tosato et al 1988; May et al 1988; May et al 1991; Santhanam et al 1989). The amino acid sequence deduced from a human cDNA clone consist of 212 amino acids residues (Zilberstein et al 1986; May et al 1986; Hirano et al 1986). Proteinase cleavage results in a mature protein of 184 amino acid residues. The 3-D X-ray crystallographic structure of the human IL-6 protein was elucidated by Somers et al 1997 and consists of four helices (A-D) plus a mini-helix (E) linked together by P-tums (figure 1.2).
Figure 1.2 Ribbon representation of the IL-6 crystal structure. The four main helices are labelled A, B, C and D. The extra helix in the final long loop labelled E. The missing part of the first cross-over connection is indicated by a dashed line (adapted from Somers et al 1997).
Structure Amino acids Helix A
Type I P-tum Disulphide bond Type n p-tum Helix B Helix C Helix D Helix E
Ser21^Ala45 Ala68—^Asp71 Cys73 and Cys83 Gln75-^Phe78 Gln80^Glnl02 Glu 109—>Ly s 129 Glnl56->Argl82 Prol41->Glnl52
Table 1.4 Location of amino acids residues in the IL-6 protein structure.
1,5,2 Molecular mechanism o f IL-6 cytokine receptor signalling
IL-6, a major mediator of AP gene expression by the liver during inflammation, exerts its action via a unique cytokine receptor mechanism. This consists of two membrane proteins; an 80kDa glycoprotein ligand-binding chain called IL-6 receptor (IL-6R) and a 13OkDa-glycoprotein signal transducer, gpl30. Binding of IL-6 to IL-6R triggers the association of IL-6R and gpl30, gpl30 in turn transduces the signal (Taga et al 1989). However, soluble IL-6R (excluding transmembrane and cytoplasmic domains), can also associate with gpl30 in the presence of IL-6 and transduce the signal through gpl30 (Taga et al 1989).
Table 1.5 Analysis of IL-6 activity and binding properties by site-directed mutagenesis. +++&, active; ++a, reduced activity; +a, strongly reduced activity (<10%); a, no activity; ++b, reduced binding to hIL6R; +b, strongly reduced binding (<10%);
-Mutation Location Effect References
A 1-26 Helix A +++a Brakenhoff et al 1994
A 1-28 Helix A ++a Brakenhoff et al 1994
A 1-30 Helix A +a Brakenhoff et al 1994
R30A Helix A -b de Hon 1995
R30T, Y31H, 132V Helix A -b Kalai et al 1997
G77-E95 (humaii)^G77-H95(murine) Loop AB -b Ehla^ et al 1994
F74E Loop AB -b Kalai et al 1997
F78X, X=E, P Loop AB -b Ehlers et al 1994;_Kalai et al 1997
R168M Helix D -a Fontaine et al 1994
L174V Helix D 4b Nishimura et al 1992
L174R Helix D -a Fontaine et al 1994
S177R Helix D -b Leebeek et al 1992a; 1992b
L178X,X=Q,R Helix D 4) Leebeek et al 1992a; 1992b
L178X,X=D,P Helix D -a Fontaine et al 1993
R179X, X=P, H, N, S, A, G Helix D -a Fontaine et al 1993
R179K Helix D -H-a Fontaine et al 1993
R179E Helix D -b de Hon 1995
A180X,X=D,T,L,R Helix D +a, -b Savino et al 1993; Leebeek et al 1992a
R182X, X=K, Q, A Helix D +4-a Lutticken et al 1991
R182X, X=E, T, P Helix D + a Lutticken et al 1991
R182X, X=G, L, W Helix D +b Leebeek et al 1992a; 1992b
H164-R182 (human)->Q164-R182 (murine) Helix D -b Leebeek et al 1992a H164-H182 (human)->Q164-R182 (rat) Helix D 4-+b Leebeek et al 1992a
A182-184 Helix D -a Kruttgen et al 1990
Kalai et al 1997, using molecular modelling and site-directed mutagenesis reported the structure of the IL-6/IL-6R binding interface. This binding interface for IL-6 and IL-6R involves the association of hydrophobic and hydrophilic amino acids between the two proteins. The hydrophobic interaction occurs between Phe74 and Phe78 of IL-6 with Tyrl88, Phe248 and Phe249 of IL-6R. This is then sealed by a hydrophilic core composing of amino acid residues Glu23, Asp26, Lys27, and Arg30 from helix A and Argl68, Argl79, and Argl82 from helix D o f IL-6 and Arg250, Arg252, Glu254, Asp272, Glu296, Glu297, and Glu302 of IL-6R.
Molecular modelling-guided mutagenesis of the extracellular domain of gpl30, revealed that amino acid residues located in the B’C’ loop (Val^^^) and the F’G’ loop (Gly^°^, Lys^°^) of domain 3 in the hinge region (Tyr^^*) connecting domains 2 and 3 were essential for complex formation with IL-6/IL-6R in COS-7/BaF3 cells (Horsten et al 1997). This region has been shown to be part of the hydrophobic cluster formed by IL-6 and gpl30 (Savino et al 1994). To evaluate this, mutants Y218K, V252D, G306W and K307E of gpl30, predicted from molecular modelling to destroy or caused sterical constraints of this hydrophobic cluster were tested. The result showed reduced complex formation capability compared to the wild-type (Wt) protein (i.e. Wt > Y218K » K307E > G306W > V252D) (Horsten et al 1997).
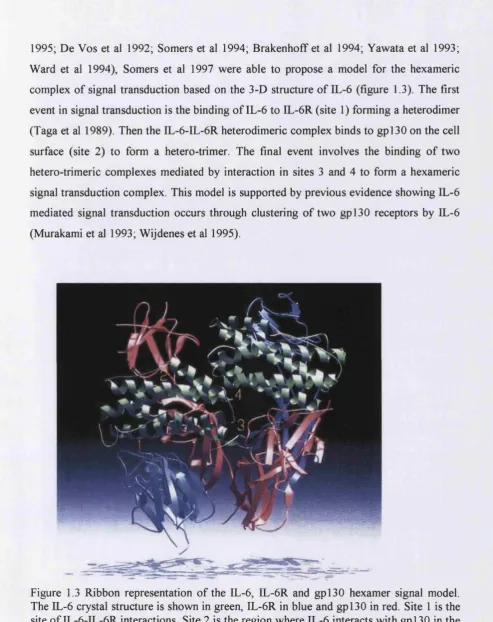
The IL-6 receptor complex for IL-6 signalling proposed by Taga et al 1989 was originally thought to contain 1:1:2 stoichiometry of IL-6-IL-6R-gp 130 with the initial binding of IL- 6 to EL-6R being the crucial part of the signalling process (reviewed by Kishimoto 1995).
1995; De Vos et al 1992; Somers et al 1994; Brakenhoff et al 1994; Yawata et al 1993; Ward et al 1994), Somers et al 1997 were able to propose a model for the hexameric complex of signal transduction based on the 3-D structure of IL-6 (figure 1.3). The first event in signal transduction is the binding of IL-6 to EL-6R (site 1) forming a heterodimer (Taga et al 1989). Then the IL-6-IL-6R heterodimeric complex binds to gpl30 on the cell surface (site 2) to form a hetero-trimer. The final event involves the binding of two hetero-trimeric complexes mediated by interaction in sites 3 and 4 to form a hexameric signal transduction complex. This model is supported by previous evidence showing IL-6 mediated signal transduction occurs through clustering of two gpl30 receptors by IL-6 (Murakami et al 1993; Wijdenes et al 1995).
The IL-6-IL-6R-gpl30 hexameric complexes which is believed to be involved in the activation of acute phase protein gene expression by the phosphorylation through signal transducer activator of transcription 3/acute phase response factor (STAT3/APRF) by the Janus kinase (Jak) pathway or via the serine/threonine phosphorylation of nuclear factor IL-6 (NF-IL6) (Nakajima et al 1993; Ihle et al 1995; Sasse et al 1997). Dimerization of STAT3/APRF and NF-IL6 by phosphorylation then leads to the induction of AP protein expression through the recognition of type 1 and type 2 EL-6 responsive elements (IL- 6REs) (adapted from Akira and Kishimoto 1992) (figure 1.4).
g p 1 3 0 h o m o d im er
► ; A d a p to r J ► IL-6/IL-6R
JAKs
STAT3/APRF
MEK
IL-6RE (ty p e 2)
P-Thfi
nf
-
ilsJ L
!-►
IL-6RE ( t y p e 1)
A type 1 IL-6RE, characterised by the consensus sequence T(T/G)NNGNAA(T/G), is present in the promoter regions of AP genes (e.g. C-reactive protein). This element binds members of the CCAAT/Enhancer binding protein (C/EBP) family, of which NF-IL6 (also called C/EBPp, AGP/EBP, LAP and IL-6DBP) and NF-IL6p (C/EBPÔ) have been shown to be implicated in the regulation of AP proteins by EL-6 (Akira et al 1990; Poli et al 1990; Kinoshita et al 1992). Type 2 IL-6RE, consist o f a hexanucleotide motif, CTGGGA, to which dimerization and activation of STAT3/APRF leads to the upregulation of the expression of AP proteins expression (e.g. fibrinogen) (Wegenka et al 1993). Table 1.6 shows examples of the acute phase genes regulated by type 1 and type 2 IL-6REs.
Table 1.6 IL-6 response elements identified in acute phase protein gene (adapted from Akira et al 1995).
Type 1 Elements Type 2 Elements
rat AGP TTGTGCAAG rat AGP CTGGGAA
TGGCACAAT human ai-andtrypwi CTGGGAT
mouse TTGCGCAAG human ai-antich^notrypsin CTGGTAA
TGGCACAAT rat a-hbrinogpn CTGGAAA
rat angiotensinogen TTGGGAAAT ^-fibrinogen CTGGGAA
human CRP TGGCGCAAA y-fibrinogen CTGGGAA
human C3 TTGAGAAAT human CRP TTGGAAA
human hcmopexin TGATGTAAT human hi^)togbbin CTGGAAA
human haptoglobin TGAAGCAAG rat T-kininogcn CTGGGTA
TTACGAAAT rat crnwrog-lobulin CTGGGAA
mouse SAA TTATGCAAG CTGGAAA
TGGAGCAAT mouse SAA GTGGGAT
Consensus TTNNGNAAT CtGGGAA
(G) (G) (A)
1,5,3 Negative regulation o f the IL-6/IL-6R/gpl30/Jak/STAT signalling pathway
complex (see figure 1.5, for review, see Heinrich et al 1998; Hilton 1999; Krebs and Hilton 2001).
APP
E ndocytosis
APP mRNA
Jak1/2/TVk2 SHP2
Ql^
OSM STAT 1/3
CNTF
gp130
gpl30/LIFR
SH2 STAT1/3
SOCS mRNA
Figure 1.5 Negative regulation of the IL-6-type cytokine signal transduction pathway (adapted from Heinrich et al 1998).
L S J .l Inhibition o f STAT by PIAS
Recently, a protein inhibitor of activated STAT (PIAS) has been discovered in various human tissues (Chung et al 1997) which co-immunoprecipitates with tyrosine phosphorylation of STAT and blocks DNA binding of activated STAT as well as STAT mediated gene expression by IL-6 (Chung et al 1997). It is believed that there are specific PIAS for every STAT factor and the ratio of STAT and PIAS may determine the strength of the STAT signal. However, the regulation of PIAS is still not yet known.
1.5.3.2 Feedback inhibition o f Jak/STAT pathway by SOCS proteins
2001). Transcripts encoding SOCS 1-3 and CIS are often present in cells at low or undetectable levels, but are rapidly induced by a broad spectrum of cytokines, both in vitro and in vivo. For example, mRNA levels for SOCS and CIS are all induced in response to stimulation with interleukin-2 (IL-2), interleukin-3 (IL-3), interleukin-4 (IL- 4), IL-6, interferon-y (IFN-y), erythropoietin, prolactin and growth hormone (Starr et al 1997; Naka et al 1997; Yoshimura et al 1995; Minamoto et al 1997; Cohney et al 1999; Pezet et al 1999; Davey et al 1999). There are several different molecular mechanisms by which SOCS family members can inhibit cytokine signaling (see figure 1.6 for an overview). SOCS 1 and SOCS 3 can directly interact with Jak and in doing so, inhibit their catalytic activity (Naka et al 1997; Endo et al 1997; Nicholson et al 1999; Yasukawa et al 1999), whereas CIS competes with STATs for the common Src-homology 2 (SH-2) or phosphotyrosine binding sites within the cytoplasmic domains of gpl30 (Ram and Waxman 1999).
Activation of signaling
^ C y to k in e
Inhibition of signaling
Receptor r - i O 1 -1
Receptor
Plasma membrane Plasma membrane
JAK JAK JAK
»
Nucleus
OS r » TVanscrlption
L 5,3,3 Endocytosis o f the IL-6 receptor complex
The rapid removal of inflammatoiy cytokines such as IL-6 from the circulation is essential for re-establishment of homeostasis (Castell et al 1988). The major organ in which the IL-6 receptor complex accumulates is the liver, where it is degraded (Castell et al 1990; Sonne et al 1990). After IL-6 binds to its receptor complex, it is efficiently internalized, thereby completely depleting the availability of the surface receptors within 30-60 minutes (Zohlnhofer et al 1992; Nesbitt and Fuller 1992) (figure 1.5). Thus, IL-6 downregulates its surface receptor and de novo protein synthesis is necessary to replenish IL-6 binding and signal transduction.
1.6 Expression of the human IL-6 gene
Studies using recombinant IL-6, anti-IL-6 antibodies and immunohistochemistry have demonstrated that IL-6 is expressed in a variety of cell types including monocytes and macrophages, T- and B-cells, fibroblasts, bone marrow stromal cells, endothelial cells, hepatocytes and smooth muscle cells (Kishimoto 1989). The human IL-6 gene is located on chromosome 7p21 (Sehgal et al. 1986; Ferguson-Smith et al. 1988; Bowcock et al. 1988), and consists of five exons and four introns (Yasukawa et al. 1987). The 5’- flanking region of the human IL-6 gene consist of two putative glucocorticoid response elements (GR, also known as ORE), an AT rich tract, a multiple response element (MRE), an NF-IL6, two API consensus sites, an NFkB and two TATA sites (Tanabe et
(a) EL-6 coding regions
6.3 63.7
^ - C Z
19 191
38
114
49
147
55
165 bp
Amino acids
ATTAAA
(b) EL-6 promoter region
G R GR AT rich AP 1 E F AP-1 C
- i n E
4 7 3 .4 6 8
c
c-fO S SRE HOMOLCX5Y(-326/-277)
83
CCACCCCMCTGGCCC
G C rich
Figure 1.7 (a) Intron-exon structure of human IL-6 gene and (b) schematic summary of the potential regulatory elements in the 5’-flanking regions of the human IL-6 gene. C, CCAAT; E, EFN enhancer core sequence; F, GGAAA motif; CRE, cAMP responsive element; GR (also referred to as ORE), glucocorticoids responsive element (adapted from Tanabe et al. 1988).
1.6.1 Induction o f IL-6 gene expression
Forskolin TPA Serum IL-1 TNF
i
MRE -173 IL-1 IL-6 TNF LPSI
NF-IL6 (Binding Site) IL-1 TNFI
J 4 5
NF-kB (Binding Site) -73 ^
lATGCTAAAGGACGTCjACATfGC^AATCrl GGGATTTTCC
GR GR AP-1 CRE
c -fo s SRE H om ology
NF-kB TATA
Figure 1.8 Transcriptional control motifs identified in the IL-6 promoter, c-fos SRE homology represent a 70% nucleotide sequence identity across a 50-nucleotide stretch of the c-fos enhancer including an SRE (serum response element). CRE, cAMP response element; GR, glucocorticoids responsive element; AP-1, activation protein 1; MRE, multi-response element; TNF, tumour necrosis factor; TPA, 12-O-tetredecanoylphorbol-
13-acetate; LPS, bacterial lipopolysaccharides (adapted from Akira et al 1992).
Stimulation by LPS, IL-1, TNF and IL-6 was shown to increase NF-IL6 mRNA levels (Akira et al 1995). The NFkB site (-73 to -64) in the IL-6 promoter mediates IL-6 induction by IL-1, TNF and interferons (Shimizu et al 1990; Liberman and Baltimore 1990; Zhang et al 1990). Recently Kang et al (1996) using band shift and DNA footprinting assays showed Spl binds to the GC-rich region with the sequence CCACC in murine IL-6. The human IL-6 promoter contains two copies of this sequence. These data suggest that NFkB, NF-IL6 and Spl play an essential role in the induction of the IL-6 gene transcription by cytokines.
L 6,2 Repression o f IL-6 gene egression
1.6.2.1 Corticosteroids
Glucocorticoids and 17-P Estradiol strongly inhibit IL-6 expression in many cell types (Tabibzadeh et al 1989; Pottratz et al 1994; Ray et al 1997; Sukovich et al 1998). Ray et al (1990) demonstrated that glucocorticoid receptor (GR)-mediated signal transduction was footprinted across the entire MRE region, the major TATA box and the major RNA transcription start site. Using the IL-6 promoter construct (region -225 to +1) linked to CAT reporter gene assay, gene transcription was repressed by dexamethasone in HeLa cells irrespective of the inducer used (Ray et al 1990). 17-P Estradiol interaction via the estrogens receptor also resulted in impaired IL-6 gene expression by blocking nuclear protein binding at the NFkB and NF-IL6 sites (Stein and Yang 1995; Galien and Garcia
1997).
1.6.2.2 Regulation o f lL-6 by hormones
C-reactive protein (Sehgal et al 1989). Cortisol also helps prevent inflammation by stabilisation of lysosomal membranes, decreased migration of white blood cells into the inflamed area, phagocytosis of damaged cells, as well as suppression of the immune system and lowering the release of IL-1 from white blood cells (Guyton 1991). The downregulation of IL-6 by 17-P Estradiol in estrogen sensitive tissues such as stromal cells probably represents an additional negative feedback loop affecting circulating IL-6 in women (Tabibzadeh et al 1989).
L 6,2,2 IL-4 and IL-10
The proinflammatory cytokines, interleukin-4 (IL-4) and interleukin-10 (IL-10) produced by B cells, mast cells, monocytes, T cells and basophils (Rennick et al 1989; Paul 1991; Vellenga et al 1993) have been shown to inhibit the expression of IL-ip, IL-6, interleukin-8 (IL-8) and TNFa expression in monocytes (de-Waal-Malefyt et al 1991; Fiorentino et al 1991, Oswalds et al 1992; Wang et al 1994; Donnelly et al 1991; te Velde et al 1990; Standiford et al 1990). Both IL-4 and IL-10 inhibit LPS-induced IL-6 expression by inhibiting the IL-6 transcription rate. In the case of IL-4, this is accompanied by a reduction of AP-1 and NF-IL6 binding activity, whereas IL-10 only inhibited AP-1 binding activity (Dokter et al 1996). Therefore, IL-4 and IL-10 may play an important role in the inhibition of inflammation by monocytes.
1,6,2,3 Fibrates
1.6.2,4 Statins
Inhibitors of 3-hydroxy-3-methylglutaryl coenzyme A (HMG-CoA) reductase, (or statins), are extensively used in medical practice as cholesterol-lowering drugs. Large clinical trials have demonstrated that statins greatly reduce cardiovascular related morbidity and mortality in patients with and without coronary disease (Shepherd et al 1995; Kobashigawa et al 1995; Herbert et al 1997; Pedersen 1999; Maron et al 2000; Vaughan et al 2000; Dotani et al 2000). Recent, in vitro findings indicate that statins, in addition to their cholesterol lowering effects, also have anti-inflammatory properties by lowering IL-ip and IL-6 mRNA expression and protein levels. They also induce the expression of PPARa fi’om human umbilical vein endothelial cells (HUVEC) and hepatocytes (Vaughan et al 1996; Inoue et al 2000; Brull et al 2001b). This suggests a potential role for statins in both lipid lowering and anti-inflammatory treatment.
1.6.3 Animal model o f IL-6 d^ciency
To elucidate the unique function that IL-6 plays in vivo, Kopf et al 1994 constructed IL-6 deficient mice by homologous recombination. These IL-6 knockout mice developed normally, but failed to control infection by Vaccinia virus or Listeria monocytogenes efficiently. The inflammatory acute phase response following tissue damage or infection was severely compromised. These mice also demonstrate impaired liver regeneration characterised by liver necrosis and failure (Cressman et al 1996). This suggested that IL-6 is crucial in the activation of repair processes during tissue damage and the elimination o f infective organisms during inflammation.
1.6.4 IL-6 concentrations in human
(lOpg/ml) (Mouawad et al 1996) and large elevations after surgery (30-430pg/ml) (Sakamoto et al 1994; Brull et al 2001a).
1.7 IL-6 and its implication in coronary heart disease (CHD)
Figure 1.9 Central roles of IL-6 and its effect on the development of CHD (adapted from Wood et al 2000).
PSYCHOSOCIAL STRESS
MONOCYTES/MACROPHAGES
In inflammatory state (smokers lung, atheroma plaque)
ADIPOSE TISSUE
iL P L
INTERLEUKIN-6
LIVER
PLATELETS
ENDOTHELIUM
Acute phase response ^Fibrinogen
iH D L
fAggregability fAdhesion
molecules
Figure 1.10 Median IL-6 levels in healthy men, MI survivors and unstable angina patients (adapted from Ridker et al 2000b; Biasucci et al 1996). IL-6 levels are from different studies and are only used here as illustration to show differences in MI and UA patients compared to normal healthy individuals.
Normal MI
M I=M yocardial infarction, UA=Unstable angina
UA
Table 1.7 Adjusted relative risks of future myocardial infarction among apparently healthy men according to baseline level of IL-6 from the Physician Health Studies (Ridker et al 2000b).
Quartile of IL-6 (range, pg/ml I
J<1.041
2 (1.04-1.46)
3 (1.47-2.28)
4
(>2.28) P for Trend
Total cohort
RR 1.0 1.9 3.5 2.3 0.01
95% Cl - 0.9-3.9 1.8-6.9 1.1-4.6
P - 0.08 0.001 0.03
Nonsmokers
RR 1.0 2.1 3.1 2.7 0.009
95% Cl - 1.0-4.5 1.6-6.7 1.1-5.7
P - 0.06 0.002 0.02
RR indicates relative risk. P=p-values for RR compared to 1 quartile