https://doi.org/10.5194/hess-22-3639-2018 © Author(s) 2018. This work is distributed under the Creative Commons Attribution 4.0 License.
Ecohydrological particle model based on representative domains
Conrad Jackisch and Erwin Zehe
Karlsruhe Institute of Technology KIT, Institute of Water Resources and River Basin Management, Chair of Hydrology, Kaiserstr. 12, 76131 Karlsruhe, Germany
Correspondence:Conrad Jackisch ([email protected])
Received: 16 November 2017 – Discussion started: 22 November 2017 Revised: 7 May 2018 – Accepted: 4 June 2018 – Published: 6 July 2018
Abstract. Non-uniform infiltration and subsurface flow in structured soils is observed in most natural settings. It arises from imperfect lateral mixing of fast advective flow in struc-tures and diffusive flow in the soil matrix and remains one of the most challenging topics with respect to match observa-tion and modelling of water and solutes at the plot scale.
This study extends the fundamental introduction of a space domain random walk of water particles as an alternative ap-proach to the Richards equation for diffusive flow (Zehe and Jackisch, 2016) to a stochastic–physical model framework simulating soil water flow in a representative, structured soil domain. The central objective of the proposed model is the simulation of non-uniform flow fingerprints in different eco-hydrological settings and antecedent states by making maxi-mum use of field observables for parameterisation. Avoiding non-observable parameters for macropore–matrix exchange, an energy-balance approach to govern film flow in represen-tative flow paths is employed. We present the echoRD model (ecohydrological particle model based on representative do-mains) and a series of application test cases.
The model proves to be a powerful alternative to existing dual-domain models, driven by experimental data and with self-controlled, dynamic macropore–matrix exchange from the topologically semi-explicitly defined structures.
1 Introduction
Non-uniform subsurface flow is omnipresent in hydrology (Uhlenbrook, 2006) and is accepted today as being the rule rather than the exception (Flury et al., 1994; Nimmo, 2011). Originally, preferential flow described water transport in non-capillary soil structures which is much faster than would be expected from classical theory of flow and transport in
porous media (e.g. Bear, 1975). A considerable number of studies and model approaches have since been proposed to address the issue – as explained in several reviews (especially Beven and Germann, 1982; Šim˚unek et al., 2003; Jarvis, 2007; Weiler and McDonnell, 2007; Köhne et al., 2009b; Beven and Germann, 2013).
Macropore settings may be very specific with respect to their topology, their temporal dynamics and their inter-face characteristics in their ecohydrological context: earth-worm burrow configurations (Blouin et al., 2013), their spatio-temporal dynamics (Palm et al., 2012; van Schaik et al., 2014) and burrow coatings (Jarvis, 2007; Rogasik et al., 2014) affect infiltration and water redistribution. Other structure-creating animals like rodents and moles can also have an impact (Botschek et al., 2002). Plant roots affect water redistribution and soil water withdrawal dynamically (Nadezhdina et al., 2010). Connected flow paths (Wienhöfer, 2014) and periglacial cover beds (Heller, 2012) may change the hydrological regime completely.
All of these influences are rather complex and specific in detail. In addition, they challenge the model concepts since the advective processes take place in explicit structures with respective connectivity and spatial covariance and under con-ditions that are far from well-mixed. They extend across sev-eral scales in space and time.
of flow kinetic energy. The proposed approaches to deal with this deviation from local equilibrium state range from (a) the early concept of stochastic convection, i.e. no mix-ing at all (Jury and Roth, 1990) or (b) with mixmix-ing as multi-ple interacting pathways (MIPs; Davies et al., 2013), (c) the “scaleway” idea to convey structural fingerprints in flow and transport across scales (Vogel and Roth, 2003), (d) dual-porosity/dual-permeability approaches, relying on overlap-ping and exchanging continua (Gerke, 2006), to (e) spatially explicit or representative definition of macropores as verti-cally and laterally connected flow paths based on elevated conductivity (Vogel et al., 2006; Sander and Gerke, 2009; Klaus and Zehe, 2011). In particular the last approach cor-roborates the crucial importance of reliable field data or es-timates characterising the distribution of the macropores at the surface and over depth for successful predictions (Loritz et al., 2017). In addition, their potential connection to lateral preferential flow paths and the catchment drainage network is of fundamental interest (Jackisch et al., 2017).
Kleidon et al. (2013) and Zehe et al. (2013) have focused on the role of preferential flow from an energy or momen-tum perspective. While preferential flow hinders lateral mix-ing, it facilitates vertical mass transfer against differences in geopotential or large gradients in matrix potential, which are established during dry spells in cohesive soils and lead to a faster depletion of the gradients (Westhoff et al., 2014). This implies a faster reduction (dissipation and export) of free ergy of soil water during rainfall-driven conditions due to en-hanced mixing into the main direction of the flow path (Zehe et al., 2013). Exchange between both flow domains is also associated with dissipation of kinetic energy and thus mo-mentum (Kutilek and Germann, 2009).
Despite the fact that there has been considerable progress in the understanding of preferential flow and non-uniform in-filtration, the topic remains one of the most challenging in particular with respect to scale and sub-scale representation of rapid subsurface flow and transport in hydrological models (Beven and Germann, 2013) and with respect to feedbacks between soil ecology and soil hydrology (van Schaik et al., 2014).
We thus propose a stochastic–physical model framework to jointly predict rapid advective water flows in soil struc-tures and diffusive water flows when capillarity controls soil water dynamics, and the interaction between the two. The approach is developed for a representative plot domain with topologically explicit macropores. An overall goal of the model framework is to provide opportunities for virtual ex-periments on infiltration patterns and abiotic controls on spe-cific niches for macro- and microbiota in structured subsur-face domains.
The proposed model is a Lagrangian approach, treating water itself as particles moving diffusively by means of a space domain random walk and advectively as film flow in representative structures. Lagrangian approaches to solute transport with unsaturated flow in heterogeneous media are
well-established tools in hydrological modelling (among oth-ers Neuweiler et al., 2012; Delay and Bodin, 2001). Most of these particle-tracking applications calculate the water flow as external drift based on a hydrological solver like for the Richards equation (de Rooij et al., 2013) or establish some assumption about the fate of a random walker in the time domain (Dentz et al., 2012). Lagrangian approaches to plot-and hillslope-scale water dynamics itself were, to the best of our knowledge, only followed by Ewen (1996) (subsys-tems and moving packets model) and Davies et al. (2011) (multiple interacting pathways model). Similar to an ex-change term in dual-permeability models, both approaches solve the key problem of advective momentum dissipation by macropore–matrix interaction by means of explicit parame-terisation. While Ewen (1996) introduces different types of water movement with a structural property parameter λto govern the probability of a water particle to move, Davies et al. (2011) define an exchange or mixing parameter of the particles’ “momentums”. Both approaches have proven very suitable for their application. However, both parameters have yet to be estimated by calibration. This implies strong limita-tions for prediclimita-tions in dynamic systems and systems under change.
We have shown in a previous study (Zehe and Jackisch, 2016) that the space domain random walk (1-D) allows for a physically consistent representation of capillarity-driven, unsaturated soil water flow in accordance with the Richards equation. In this Lagrangian conceptualisation the diffusion of the water particles (and thus their potential displacement) depends on the local density of particles. The higher the lo-cal particle density (wetter), the higher the diffusion based on the soil water retention properties. In the study at hand, we extend the approach to a 2-D matrix domain which hosts a number of representative preferential flow structures like earthworm burrows or cracks as vertical 1-D elements. The scope of this echoRD model (ecohydrological particle model based on representative domains) covers the simulation of plot- and event-scale flow and transport through a topologi-cally explicit treatment of macropores. Pore-scale processes (e.g. Moebius and Or, 2012; Shahraeeni and Or, 2012; Sne-hota et al., 2015; Schlüter et al., 2016) are not resolved here. The main objectives of this study are to (a) present the model theory, to (b) test the capability of the echoRD model to simulate the fingerprints’ non-uniform infiltration and to (c) reveal whether advective and diffusive flow and the inter-actions between them may be represented in one consistent formulation. As the model shall allow for virtual experiments we base its parameterisation as much as possible on field ob-servables or explicitly testable hypotheses. More specifically, we derive and test an energy-balance-based approach to con-trol the exchange between the macropore domain and the sur-rounding matrix in a self-limiting manner.
respectively, through a GitHub repository (Jackisch, 2018): https://github.com/cojacoo/echoRDmodel (last access: 3 July 2018). In particular, the echoRD model, including a preprocessor, application tests and basic documentation, can be accessed there.
2 Specific motivation
2.1 General particle concept and 1-D implementation Particle tracking is usually employed for simulating the ad-vective dispersive transport of solutes, but not for the wa-ter phase itself (e.g. Delay and Bodin, 2001; Metzler and Klafter, 2004; Berkowitz et al., 2006; Koutsoyiannis, 2010). In such applications, particles representing a certain amount of solute are advectively displaced by the movement of the solution and diffusively within it. Most random walk appli-cations rely on a continuous time domain representation as it performs well at minimum computational cost (Delay et al., 2008; Dentz et al., 2012). This approach is, however, not fea-sible when the diffusivity itself depends on the particle den-sity as is the case for water particles. We thus employ a non-linear random walk of water particles in the space domain.
In Zehe and Jackisch (2016) we described this procedure as a 1-D model with water particles of constant mass travel-ling according to the Itô form of the Fokker–Planck equation. The model concept builds on established soil physics by esti-mating the drift velocity (gravity-induced displacement) and the diffusion term (capillarity-driven displacement) based on the soil water retention characteristics. Reduced mobility of water with decreasing size of the populated pore is accounted for using a suitable binning of the water diffusivity curve to scale the random work of different particles. Furthermore, we proposed a straightforward implementation of rapid non-equilibrium infiltration there. This binning enabled the dis-tribution of flow velocity in the pore space to be simulated; i.e. we discussed the assumption of instant and uniform de-termination of bulk water velocity based on the soil water retention curve in most Eulerian models. In the Lagrangian approach infiltrating event water can travel initially in the largest pore fraction at maximum velocity and it experiences a slow diffusive mixing with the pre-event water particles within a characteristic mixing time.
2.2 Limitations of the 1-D representation
Despite the successful application of the introduced particle model approach, a 1-D version essentially lacks information about the lateral component of the non-uniform distribution and resulting macropore–matrix exchange characteristics in natural soils. One could be tempted to subsume an essence of the recent model approaches for subsurface flow in discrete structures (e.g. Jury and Roth, 1990; Vogel and Roth, 2003; Gerke, 2006; Vogel et al., 2006; Sander and Gerke, 2009;
Nimmo, 2011) as a third type of particles to our previous 1-D representation. However, this would imply three problems. The first is that macropore flow is much faster than satu-rated hydraulic conductivity. At the same time it is limited to a very small fraction of the soil column. This motivated the conceptualisation of multiple flow domains. However, the state of a specific flow path is substantially different from the averaged state of a elementary volume. Secondly, the topol-ogy of flow paths plays a role in this regard: macropores en-able a quick vertical redistribution of event water. If the net-work of macropores is rather dense and lateral diffusion is not too slow, the resulting soil water dynamics can be uni-formly described by some elevated, effective hydraulic con-ductivity. If the structures are sparse and lateral diffusion into the matrix is slower, lateral gradients in soil water potential and non-uniform flow fields are established.
As such the flow field depends on macropore topology, antecedent soil matrix state, macropore capacity and infil-tration supply. In a 1-D approach such lateral gradients and their depletion cannot be described other than by some addi-tional conceptual parameter or function and averaged matric potential states. The result would remain bound to a priori defined macropore–matrix exchange assumptions. Without proper control of the macropore–matrix interaction and thus control of the advective flow field, a fast fraction of parti-cles would simply remain quick and drain from the domain, which contradicts the experimental findings.
The third challenge refers to the matrix pore space and exchange/mixing of rapid event water particles with the pre-event water to establish a local thermodynamic equilib-rium (LTE) – the well-organised distribution of water parti-cles in the respective smallest fractions of the available pore space, as we further explained earlier (Zehe and Jackisch, 2016).
These issues led to the preliminary finding that a lumped 1-D version of the particle model could not succeed in re-producing the observed tracer distributions without thorough calibration to one specific antecedent state and one specific realisation of the advective flow field. The requirement of non-observable and non-static mixing parameters between the domains makes an application to predict behaviour un-der change challenging. Thus it is not very convincing if we desire to develop the model as a virtual laboratory.
3 The echoRD model
advec-Matrix
Representative domain width
Ma
cr
op
or
e
capacity
Depth
[image:4.612.85.244.66.238.2]Contact interface
Figure 1. Representative macropore–matrix domain. A 2-D soil
matrix with a periodic lateral boundary hosts several 1-D macro-pores with their respective capacities, interfaces and lateral distri-butions.
tive flow, respectively. The soil matrix is projected as a 2-D domain with a periodic lateral boundary. Macropores are represented as vertical 1-D elements linked to the matrix. As there is usually no information about the spatial clustering of macropores, they are placed at resampled distances accord-ing to an observed density distribution. Given the periodic lateral boundary of the matrix domain, it is not the macropore positions but their relative distances that matter. The lateral extent of the domain is determined by the minimum density of macropores in a given depth, such that the overall connec-tivity is represented. One may also choose to take a multi-ple of the least representative in the set-up, for instance to describe interactions with less densely occurring structures such as subsurface pipes.
The 2-D soil matrix possesses a grid for the determina-tion of soil properties and for particle density (and thus soil moisture) calculation. The 1-D macropore domains have an internal grid for film flow calculations, the lag distance is calculated as the projection of one water particle to the mean macropore diameter. In addition, the 1-D macropore domains have an interface area with the 2-D soil matrix domain. In this area particles are considered for exchange between the domains.
3.2 Diffusion in the soil matrix based on a 2-D random walk
Similar to the use of particle tracking for simulating solute transport we conceptualise soil water as particles. Each parti-cle represents a constant mass of water, defined by the set-up of the soil matrix calculation grid and the resolution of the porewater volume bins.
Diffusive soil water flow is simulated as a non-linear, space domain random walk in the soil matrix, as presented in
. n . . . . . . 8 9 6 7 4 5 2 3 1
*
0 1
log
10
(k)
-4
-20
Particle bin . n . . . . . . 8 9 6 7 4 5 2 3 1
*
0 1
[image:4.612.310.546.68.183.2](b) LTE state (a) Non-LTE state
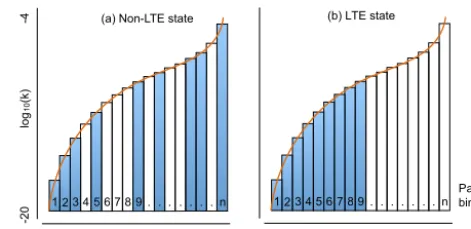
Figure 2.Example of delineation of the pore space into bins of
equal volumes or particles in our study. If the bins are organised in ascending order, this refers to the LTE (local thermodynamic equi-librium) state of the pore space(b). However, at the same over-all soil moisture the particle configuration could also divert from LTE(a).
our previous study (Zehe and Jackisch, 2016). We describe the trajectory of a single particle of water in a time step1t
as the Itô form of the Fokker–Planck equation based on the formal equivalence of the Richards equation and the advec-tion dispersion equaadvec-tion, consisting of a vertically directed drift termu(θz,x,t)=k(θθz,x,tz,x,t) characterising downward water
fluxes driven by gravity and a diffusive term representing wa-ter movements driven by the matric head gradient and con-trolled by the diffusivityD(θz,x,t)of soil water or particles
respectively. With this we can establish the Itô solution for the trajectory of one particle:
zt+1t=zt+
"
u θz,x,t+∂D θz,x,t
∂zt
#
1t+ξz
q
6D θz,x,t1t
xt+1t=xt+
∂D θz,x,t
∂xt 1t+ξx
q
6D θz,x,t1t, (1)
withzvertical position (m),x lateral position (m) andξ a uniform random number [−1, 1]. Notice, that unlike the dif-fusion/advection of a solute this does not require referencing to the wetted pore space since our reference system is the total pore volume.
In this form diffusivityD(θz,x,t)is dependent on the soil
moistureθat the location (z,x) of a particle for a certain time step (t). Although we need to assume point-like particles to apply the Itô solution in Eq. (1), each particle is referenced to a mass and theoretical spatial extent to deriveθfrom the density of particles. However, any kind of direct particle in-teraction is neglected at this stage.θis calculated by the num-ber particles (and thus volumetric fraction of water) in each calculation grid cell of the 2-D soil matrix. In Appendix D an evaluation of the lateral diffusion is included alongside macropore exfiltration.
to the water retention curve as explained in Zehe and Jack-isch (2016). Thenu andDin Eq. (1) are dependent on the particle’s bin. Different from the work of Hassanizadeh and Gray (1990), who developed a theory for multiphase flow at the meniscus scale in porous media, combining averaging of microscale descriptions and macroscopic approaches by em-ploying balance laws and the second law of thermodynamics, we conceptualise LTE relaxation associated with momentum dissipation of infiltrating water in coarser pores. As such, we assume a diffusion towards LTE without resolving individ-ual pore-scale processes. By doing so, the reassignment of bins to the moving particles becomes crucial: in the advanced model version the bins of all particles in each calculation grid cell are frequently updated by determining the deviation from the LTE state (all bins are sorted from 0 ton, withnbeing the number of particles at the current relative saturation state). The relaxation timetmixto LTE is hypothesised as diffusion
time:
tmix=
L2x,z
Dmix
, (2)
withLx,z as maximal diffusion length given byLx,z=ks(x,
z)·1t andDmixas Dat the 0.7 percentile of the free bins
(the percentile is a hypothesised estimate of the effective dif-fusivity and can be controlled by a model parameter). With this,tmixis the time after which LTE is assumed to be
recov-ered from an initial population of the largest pores. The bins of all particles in a grid cell are updated to a lower deviation from LTE after each calculation step by
bint+1t=bint−max [0, (bint−binLTE)]
1t tmix
. (3)
In addition, a counteracting stochastic process is intro-duced to handle the effect of high diffusivity but the low number of open slots in the pore space near saturation:
pcounteract=
nempty bins
nair capacity bins
. (4)
Herenis the number of respective bins in the pore space. If the probabilitypcounteract is below 1, it is multiplied byξ in
the random walk (Eq. 1) scaling the diffusive step by the ratio of open slots tending towards zero at saturation.
Numerically, the actual step of a particle is calculated in a predictor–corrector approach, projecting the step of one par-ticle, anticipating an updated state/binning to updateDandu
and calculating the geometric mean of the projected and up-datedDanduaccording to Stratonovich. In order to balance computational expenses and numerical stability, a stratified subsample (governed by a model parameter) of all particles is handled at once. The used variables are calculated based on van Genuchten parameterisation of the soil matrix prop-erties.
3.3 Advection in the 1-D macropores as film flow In addition to the matrix domain the set-up contains several 1-D elements as macropores (Fig. 1). They are distributed along the lateral axis of the matrix and connect to certain cells over a defined contact interface.
3.3.1 Projected drainage capacity and maximum velocity
The preferential flow network exhibits a large drainage ca-pacity. Zehe (1999) estimated that a single burrow of a Lum-bricus terrestris (r=4.5 mm) may drain the equivalent of 1 m2 saturated loess soil matrix. Based on the domain set-up, advection is structurally limited by the drainage depth of a macropore and its size.
The second limit is given through the definition of initial maximum flow velocity in the structures. Literature values in Table 1 range closely around 7.5×10⁻²m s−1. Being much larger than the saturated hydraulic conductivity of most soils, these values range several orders of magnitude below the the-oretical value for pipe flow in such a pore calculated accord-ing to Hagen–Poiseuille with a unit gradient. Here we use this difference to estimate frictional losses of the advective momentum as dynamic limitation through interaction with the matrix as further explained in the following sections. 3.3.2 Dynamic film flow
Macropore flow is represented as 1-D film flow of particles along the pore wall (Fig. 3). We assume that a particle has a given kinetic energy (Ekin) which is dissipated by friction at
the macropore wall and infiltration into the matrix (Fig. 3a). The maximum advection stepsprojof a particle is projected
based on its current velocityv0, which is decelerated by the
afriction andaexchange it experiences along its path. This
re-sults in a reduced step lengthsreal (Fig. 3b). On its passage
along sreal, a particle may possibly infiltrate into the
ma-trix, calculated by an accumulation of an infiltration length (Fig. 3c). We account for variable film thickness depending on the number of particles in each internal grid element of the macropore. If particles overlap their vertical positions, and thus there is more than one per position slot, they form a second film layer. Particles at a higher level in a film do not experience drag or friction and travel without retardation un-til they reach the lowest wetted position within a continuous film stretch (Fig. 3d).
3.3.3 Macropore–matrix interaction
matrix
0
1
E
kins
proj
s
real
matrix
E
kinexchange
friction matrix
1
E
kin2
s
proj
s
real
s
infs
infs
projs
reals
infv
s
v
0afriction
(a) (b) (c) (d)
D
D
[image:6.612.81.522.65.203.2]aexchange
Figure 3.Macropore flow concept.(a)Concept of a water particle at the pore wall possessing a kinetic energyEkinwhich is dissipated by
friction in the macropore network and exchange with the matrix due to the matric potentialψmatrix.(b)Projected advection of a particle
where the potential advective velocityv0is decelerated by theafrictionandaexchangeit experiences along the projected pathsproj, resulting in
a reduced step lengthsreal.(c)Reduced advection with macropore–matrix exchange (1), and possible infiltrationsinf(2).(d)Fast advection
of a particle as film flow to the end of the film (0) and further decelerated advection (1).
consensus that macropore–matrix interaction depends on the matric head and the wetting of the macropore wall (Klaus et al., 2013) and is optionally affected by organic coatings which may act hydrophobically (Jarvis, 2007; Rogasik et al., 2014). Moreover, it is dependent on the flow velocities. Cur-rent dual-permeability approaches treat this key process as either based on a leakage/exchange coefficient and the poten-tial difference between the domains (Gerke, 2006) or based on using the geometric mean of the saturated hydraulic and actual hydraulic conductivity and the potential gradient be-tween both domains. The latter depends on an exchange length (Beven and Germann, 1981). The drawback of these approaches is that neither the exchange length nor the leak-age parameter is observable, and they depend on model grid size, state dynamics and event characteristics (Köhne et al., 2009a).
Here we propose a thermodynamic approach for describ-ing this key process on a physical basis without introducdescrib-ing additional parameters based on the Bernoulli equation:
0.5%
const.
z}|{
v2adv
| {z }
Ekin
+%gz
|{z}
Epot
+ =0
z}|{
p +εfriction=const. (5)
Measured advective flow velocity values in earthworm pores range closely around 7.5×10⁻²m s−1, as given in Ta-ble 1.
These measurements compare with a theoretical laminar flow velocity through a pipe of the same cross section and with a unit pressure gradient by a factor of about 500. A the-oretical laminar flow velocityumxthrough a pipe can be
cal-culated using the Hagen–Poiseuille equation (assuming unit pressure gradient):
umx=2·
ρgR2
8·η , (6)
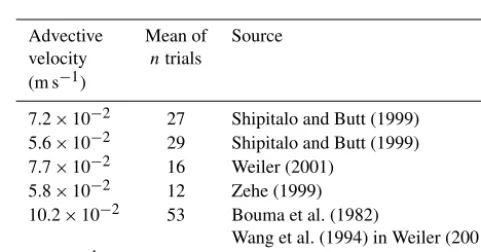
Table 1.Measured mean maximum advective velocity in burrows of
the earthwormLumbricus terrestrisat a mean radius of 4.5 mm and theoretical value calculated using the Hagen–Poiseuille equation.
Advective Mean of Source velocity ntrials
(m s−1)
7.2×10⁻² 27 Shipitalo and Butt (1999) 5.6×10⁻² 29 Shipitalo and Butt (1999) 7.7×10⁻² 16 Weiler (2001)
5.8×10⁻² 12 Zehe (1999) 10.2×10⁻² 53 Bouma et al. (1982)
Wang et al. (1994) in Weiler (2001) 3.8×101 using the Hagen–Poiseuille equation
withρ and ηas the density and dynamic viscosity of wa-ter,gthe gravitational acceleration andR the radius of the pore. The direct measurements compare with the theoretical velocity through a pipe of the same cross section by a factor of about 500. This deviation is conceptualised as friction in the macropore set-up.
Given its velocity, each particle in motion possesses anEkin:
Ekin=0.5mparticleu2mx. (7)
With this and the current velocity of a particleureal, we may
estimate the dissipation by friction in the macroporeεfriction
as an impulseIfrictioncounteracting the hypotheticalEkinby
Ifriction=Ekin/ureal. (8)
Following Kleidon and Schymanski (2008) and Zehe et al. (2013) soil water experiences a certain capacitative (or capil-lary binding) energy density dEcap=9dVθ, as the matric
[image:6.612.308.549.335.461.2]to macropore–matrix exchange affects its capillary binding energy approximately as
εexchange=dEcap=%g
∂9z ∂θz
·θdθ, (9)
with9zas the matric pressure head at a certain depthzand θzas the volumetric soil water content. With this we can
es-timate dissipationεexchangeduring the infiltration of one
par-ticle as an impulse by using the parpar-ticle volumeVparticleand
a projected infiltration fluxqexchange:
Iexchange=%g
∂9z ∂θz
Vparticle
qexchange
. (10)
The projected infiltration rate qexchange is calculated as
the Darcy flux:qexchange=ku(ψ )· −ψ/2rparticle. Notice that
this is only the necessary assumption for the change ofθin Eq. (10) directly at the interface. All state-dependent vari-ables are formulated as the geometric mean of the references at an initial depthziand a projected depthzprojin a predictor–
corrector scheme.
Now, the reduced advective velocity of a particle is esti-mated using friction and exchange drag acting against Ekin
of the particle in a steady state:
ux= −
Ekin
Iexchange+Ifriction
. (11)
If the projected infiltration exceeds the particle radius
qexchange·1t > rparticlethe particle will be transferred to the
adjoining matrix. With the given equations, the dynamic film flow and infiltration into the matrix is governed by the state-dependent retention properties of the soil (van Genuchten pa-rameters) and the supply of new particles. In Appendix D synthetic references are presented.
3.4 Infiltration into macropores and the matrix domain at the upper boundary
With the extension of the model to two dimensions, the par-titioning of infiltration into macropores and the soil matrix became an important aspect of the model. As pointed out by Weiler (2005) and Nimmo (2011) and others, initialisa-tion of the macropores is critical and non-trivial. We em-ploy a generalisation of the concept of macropore drainage areas (Weiler, 2005; Weiler and Naef, 2003) and the con-cept of preferential flow initiation and partitioning according to Nimmo (2011): when precipitation is converted into parti-cles, they are randomly distributed over the top boundary. All particles which happen to fall on soil first form a film layer similar to the macropore walls described earlier. Excess pcipitation or particles directly falling on macropores are re-distributed to the macropores according to proximity and ca-pacity. If one macropore’s capacity is reached, it is excluded from the redistribution process. Particles in the film layer are included in the diffusive calculation step of the top matrix
cells. Particles in the macropore domain are treated as film flow advection and possible infiltration from the macropores into the matrix as described above. Thus, infiltration is only limited by the transport capacity of matrix and macropores. The higher the soil matrix infiltration capacity, the lower the share of particles entering the macropores.
3.5 Data requirements, technical implementation and numerical issues
The parameterisation of the echoRD model based on ob-servables is a key objective of this study. As pointed out previously, the required parameters for the model are reten-tion characteristics (van Genuchten parameters) and a lateral and vertical density distribution of macropores. The reten-tion properties of the soil matrix can be measured in standard pedo-physical analyses.
To derive macropore density distributions, horizontal panes of dye tracer stains (e.g. Brilliant Blue experiments) can be analysed with the model preprocessor. With this we make use of experimental data directly as explained in Ap-pendix B. Moreover initial soil water content and a precipi-tation time series need to be defined.
We rely on sequential calculation of the process domains: 1. infiltration at the top boundary into matrix and
macrop-ores;
2. diffusive matrix flux as a spatially explicit 2-D random walk;
3. film flow in the macropore;
4. macropore–matrix interaction (infiltration and exfiltra-tion).
Checks for saturation and percolation below the lower boundary are performed after step 2 and 3. The time step is controlled through Courant and Neumann criteria based on the maximum possible diffusive and advective step at the current max(θt)or occupied bin respectively:
1tD=1z2/6max Dmax(θt)
and
1tu=1z/max kmax(θt)
. (12)
4 Model application tests and experimental references In this section, we outline our application tests of the echoRD model and a reference to real-world conditions in order to ex-amine the capability of the chosen simplifications. In order to focus on the proposed concept and hypothesised process de-scriptions, the following tests are realised with an underlying grid resolution for particle density calculation of 5 mm. The water particles are set to a size of 0.002 times a grid cell (equivalent to 0.33 mg).
With the extension to two dimensions and the introduc-tion of representative macropores, the test applicaintroduc-tions shall especially address the following aspects:
a. 2-D diffusive, non-uniform soil water redistribution; b. interaction of 1-D advective paths with the 2-D soil
ma-trix;
c. sensitivity to state variables and model parameters; d. robustness of the representative macropore setting; e. reproduction of a real-world irrigation experiment. 4.1 Generic application test cases
The central benchmark of the model is a series of generic test applications with different soil types, precipitation intensities and antecedent soil moisture. The aim is to examine the con-sistency and capability of the model and the self-controlled non-uniform flow with regard to points a–c. The test matrix is spanned by
– soil water retention parameters for a sandy soil, a loamy soil and a loess soil (Table 2),
– two different antecedent moisture states at 0.15 and 0.31 m3m−3and
– precipitation intensities at 10, 40 and 60 mm h−1lasting
for 30 min.
[image:8.612.307.546.140.248.2]The resulting model runs are compared visually based on the infiltration patterns and numerically based on the distribu-tion of newly added particles as breakthrough curves (BTCs). In our Lagrangian approach neither particle interaction nor solute transfer from one particle to another is considered. Hence we neglect diffusive mixing, and the breakthrough is simply the depth distribution of new particles. Addition-ally, we compare these resulting travel depth distributions based on means of the first three central moments. In these scenarios, the macropore network is the same. It is defined based on earthworm macropore assessments in an agricul-tural loess landscape using the preprocessor (Appendix B). To gain insight into the model robustness, alternative defini-tions of macropores based on the same input statistics are compared separately (aspect d). Moreover we test the in-fluence of different particle resolutions with 100, 200 and 500 particles per grid cell atθsfor some examples.
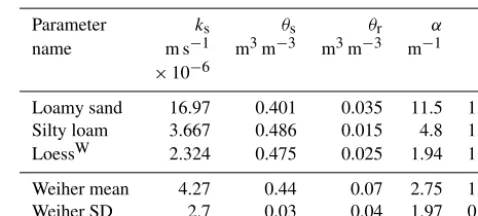
Table 2.Soil matrix retention parameters used in the application
tests. Loamy sand and silty loam according to Carsel and Parrish (1988). LoessWrefers to measured values from soils at the location of the experiment described in Sect. 4.2. Weiher comprises seven ensemble soil matrix references of the Weiherbach basin as mean and standard deviation (SD).
Parameter ks θs θr α n
name m s−1 m3m−3 m3m−3 m−1 –
×10−6
Loamy sand 16.97 0.401 0.035 11.5 1.47
Silty loam 3.667 0.486 0.015 4.8 1.21
LoessW 2.324 0.475 0.025 1.94 1.21
Weiher mean 4.27 0.44 0.07 2.75 1.25
Weiher SD 2.7 0.03 0.04 1.97 0.08
4.2 A plot-scale irrigation experiment as a real-world test case
We conducted a series of plot-scale irrigation experiments in different soil landscapes (Jackisch, 2015). Our model devel-opment is founded on these findings, based on the hypothesis that irrigation experiments can reveal the distribution of ad-vective flow paths and the resulting non-uniform soil water redistribution characteristics (Jackisch et al., 2017). By using a sprinkler with a very fine drop spectrum and a drip irriga-tion pad in the presented case on undisturbed surface con-ditions, we neglect drop splash impact (Iserloh et al., 2013) and macropore drainage area connectivity (Weiler and Naef, 2003). Diffusive soil water transport parameters are deter-mined based on laboratory analyses of undisturbed soil cores for their retention properties.
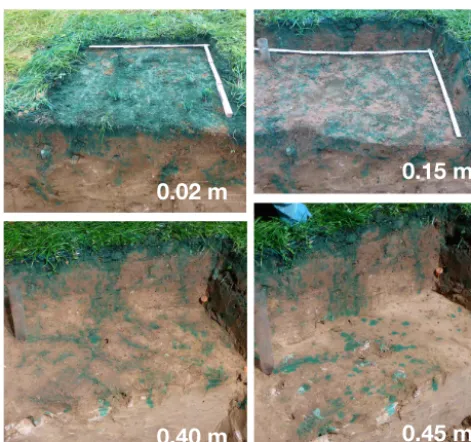
Because the model is intended as an exploration tool ex-tending real-world experiments, a further test of the model aims at reproducing one experiment in the Weiherbach basin in south-west Germany with loess soils on a fallow plot (49.13517◦N, 8.74415◦E; 20 October 2015). The irrigation was realised with 40 mm water in 2 h on a 1 m2 plot with a drip irrigation pad. The water was enriched with 5 g L−1 potassium bromide (KBr) salt tracer and 4 g L−1 Brilliant Blue dye tracer. The plot remained covered during the whole experiment until excavation. The state was monitored with a TDR soil moisture tube probe (Trime IPH, IMKO GmbH) and time-lapse 3-D ground-penetrating radar (GPR; All-roggen et al., 2017). The plot was excavated 20 h after ir-rigation onset for dye stain recovery (Fig. 4). In addition two core samples (80 mm diameter) were drawn 20 and 30 h af-ter irrigation onset, respectively. The cores were sliced every 15 mm and were analysed for Bromide concentration as in Jackisch (2015).
0.02 m
0.40 m
0.15 m
[image:9.612.49.285.64.285.2]0.45 m
Figure 4. Weiherbach irrigation experiment as model reference.
Brilliant Blue dye stains in excavation horizons.
Plate and Zehe, 2008; see Table 2 for the case of Weiher). The macropore domain has been parameterised based on ob-served dye stain patterns in four depth layers using the pre-processor (Appendix B). The vertical extent of the signal guides of the TDR tube probe is 18 cm. It was manually low-ered in the tube in 10 cm increments. In order to compare the observed and modelled soil water state dynamics, the mid-point of the probe is taken as reference, and the total soil moisture of the depth increment referring to the respective probe depth is averaged.
5 Results
5.1 Generic application tests
The generic application tests show the capability of the model to calculate self-controlled, non-uniform infiltration patterns (Figs. 5 and 6).
The simulations of 40 mm irrigation in 0.5 h on loess silt with different antecedent soil water content show the devel-opment of a non-uniform flow field conditioned by the repre-sentative macropores (Fig. 5). The overall soil water dynam-ics (a) exhibit a quickly expanding advection in the larger macropores. The respective BTCs (c, and marginal plots in a) allow this behaviour to be quantified. After 10 min new particles already reach a depth up to 0.2 m, while the cen-tre of mass is around 0.05 m. The results also show that the fast advective displacement requires continuous supply. Af-ter the end of irrigation soil waAf-ter is mostly redistributed dif-fusively, which can be seen as blur in the soil water con-tent. This is also depicted by relatively steady BTCs. Thus
0 0.1 0.2 width (m)
Dep
th
(
m
)
0 5 10 15
−0.7 −0.6 −0.5 −0.4 −0.3 −0.2 −0.1 0.0
0 5 10 15
0 5 10 15
Centre of mass x1000
−0.7 −0.6 −0.5 −0.4 −0.3 −0.2 −0.1 0.0
−0.7 −0.6 −0.5 −0.4 −0.3 −0.2 −0.1 0.0 −0.7 −0.6 −0.5 −0.4 −0.3 −0.2 −0.1 0.0
0 12 24 36 48 vol.% Simulated soil water content
(a) Simulation of 40 mm irrigation in 0.5 h
15 vol.% 31 vol.% (b) Representative macropores
(c) Breakthrough of new particles
31 % 15 % Antecedent state 5 min
10 min
30 min
[image:9.612.309.543.65.556.2]60 min
Figure 5.Simulated soil moisture dynamics in generic application
tests of loess soil. The marginal plots give the distribution of all particles (blue) and newly infiltrated particles (red).(b)The defini-tion of the representative macropore domain.(c)The breakthrough curves of new particles at the different time steps for the two an-tecedent states.
10 mm / 0.5 h 40 mm / 0.5 h 60 mm / 0.5 h
15 % 31 % 15 % 31 % 15 % 31 %
Loamy Silty
sand loamLoess Loamy Silty Loesssand loam
0 12 24 36 48 vol.% Simulated
soil moisture 0
0.7
0
0.7
0
0.7
0
0.7
0
0.7 Depth
(m) 0 0.35 0 0.35 0 0.35 0 0.35 0 0.35 0 0.35 0 0.35 0 0.35 0 0.35 0 0.35 0 0.35 0 0.35 0 0.35 0 0.35 0 0.3500.3500.35Width (m)
218
min 151 min 193min
280
min min245 287min 187min 143min 150 min min141 min18 608min 155min min672 128min min641 min27 min504
sim sim sim no
sim simsimsim
sim sim sim Initial
moisture Intensity
Soil type
30 min Irrigation end 10 min 5 min
60 min
Last sim
No
No
No
No
Loamy Silty
[image:10.612.50.548.65.398.2]sand loam Loess Loamy Silty Loesssand loam Loamy Siltysand loam Loess Loamy Silty Loesssand loam
Figure 6.Table of simulated soil moisture dynamics in generic application tests for loess. Marginal plots give the distribution of all particles
(blue) and newly infiltrated particles (red).
Comparing the different soil types of loamy sand, silty loam and loess silt, the two respective antecedent moisture states and three irrigation intensities, more insight into the simulated soil water dynamics is given (Fig. 6). Generally, with increased supply intensity, the non-uniform flow field becomes more prominent. However, moderate intensity can also develop such patterns, depending on the diffusive mo-mentum. It becomes apparent that the more conductive the matrix was, the less pronounced the advective fraction be-came. The diffusive redistribution of particles is especially obvious for the highly conductive loamy sand. With low sup-ply intensities and high antecedent soil water content, this leads to almost uniform infiltration. The diffusive redistribu-tion is especially visible when comparing the results of dif-ferent antecedent states. Under dry conditions the film flow is experiencing more drag with less exfiltration into the ma-trix. Wet conditions and more conductive soils lead to less friction but also more lateral displacement. In the long simu-lation runs (bottom row) the lateral gradients are increasingly dissipated as one would expect.
Moreover, the larger the supply sustaining the advec-tive fraction, the greater the depth or breakthrough reached.
When analysing the simulated dynamics this also led to dif-ferent apparent velocities in the respective macropores (see video in the Supplement). This behaviour is consistent with field observations and our expectations. As such, the model proves to fulfil the required objectives a–c.
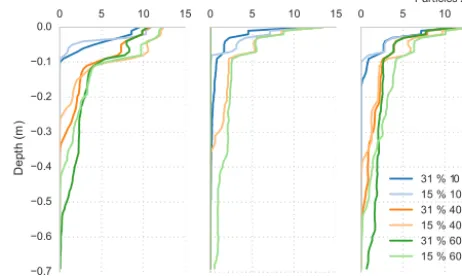
A more quantitative reference is obtained when compar-ing the depth distribution of new particles of the application tests directly (Fig. 7). The temporal dynamics of the infil-tration patterns in loamy sand start with a largely intensity-controlled situation (low deviation between antecedent con-ditions). The picture changes to antecedent-state-controlled top soil retention for the higher intensities with very similar profiles. Total irrigation amount controls deeper percolation in the later course of the simulation. There, the deeper tail-ing is reduced by the top soil retention, leadtail-ing to different reached depths of all simulations with high irrigation inten-sity. Low intensities resulted in similar overall breakthrough. In Appendix Fig. E1 the breakthrough curves after 1 h sim-ulation of all generic application tests show the same depen-dency on soil type and antecedent state.
0 103 3x10³ 5x103100101102103104105
Particles
0 5 10 15
10 min −0.7
−0.6 −0.5 −0.4 −0.3 −0.2 −0.1 0.0
De
pt
h
(
m
)
0 5 10 15
30 min
0 5 10 15
60 min Particles x1000 (a) Loamy sand - breakthrough of new particles
31 % 10 mm 15 % 10 mm 31 % 40 mm 15 % 40 mm 31 % 60 mm 15 % 60 mm Centre of mass
log-scaled (b) Different macropore realisations
[image:11.612.103.493.64.216.2]Dry Wet Median of 10
Figure 7.Simulated depth distribution of new particles in generic application tests.(a)Loamy sand at different times after irrigation start.
(b)Simulations with different macropore realisations based on the same input data.
0 20 40 60 80 100
Time (min) 0.00
0.02 0.04 0.06 0.08 0.10 0.12 0.14 0.16 0.18
De
p
th
(a) Centre of mass (m)
0 20 40 60 80 100
Time (min) 0.000
0.005 0.010 0.015 0.020 0.025
15% 10 mm
(b) BTC variance (m2)
0 20 40 60 80 100
Time (min) 1
12
(c) BTC skewness (m3)
31 % 10 mm 15 % 10 mm 31 % 40 mm 15 % 40 mm 31 % 60 mm 15 % 60 mm End of irrigation
0 20 40 60 80 100
Time (min) 0.00
0.02 0.04 0.06 0.08 0.10 0.12 0.14
0.16 (d) Dispersion length (m)
4 8
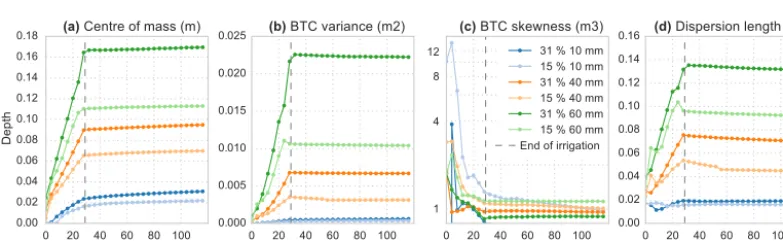
Figure 8.Dynamics of the moments of the breakthrough curves (BTCs) of loamy sand simulations.(a)First moment as centre of mass,
(b)second moment as variance of depth distribution,(c)third moment as skewness of depth distribution and(d)dispersion length defined by< A > / < B >.
particles (Fig. 8). The average travel depth increases with time in a clearly non-linear way during rainfall-driven ditions, and remains nearly constant during non-driven con-ditions afterwards. The variance exhibits a similar temporal pattern. The skewness of the travel depth distributions gener-ally peaks shortly after the irrigation onset and decreases af-ter that. This rising limb and the early peak marks the initial development of “flow fingers” in a single or a few macrop-ores. The activation of additional macropores does however reduce the skewness as the median of travel depth starts to “chase” the mean. This finding shows clearly that a flow pat-tern that is strongly dominated by preferential flow is not necessarily skewed (Dreuzy et al., 2012). As the third mo-ment tends to minimise for the cases with high antecedent soil moisture and thus lateral diffusion, the qualitative ob-servations of relatively smooth infiltration patterns in Fig. 6 are reflected very well. The temporal evolution of the disper-sivity in Fig. 6d reveals clearly that the transport is not well mixed during the entire duration of the rainfall forcing. It op-erates in the near field, as the variance grows quadratically with time. Later, diffusion dominates the soil water redistri-bution.
In addition, we performed model parameter-related tests drawing different realisations of the macropore setting from the same ensemble (Fig. 7, right panels). The breakthrough curves of eight alternative realisations of the representative macropores under two different antecedent conditions are given with the 0.25 and 0.75 percentiles as variability bands. In order to evaluate the effect on potential contaminant break-through, a log-transformed plot is given. The results are within realistic bands and well below the uncertainty of tracer recovery of such experiments. Thus, test aspect d is achieved. Variance can be narrowed by defining a larger domain width. This may become important for highly skewed macropore distributions, for which the requirement for the minimal do-main width may be higher than assumed.
[image:11.612.104.496.265.386.2]0.0 0.25 0.5 0.75 1.0 -0.6
-0.45 -0.3 -0.15 -0.0
Width (m)
De
p
th
(
m
)
[image:12.612.51.285.66.203.2]New All Old 0 12 24 36 48 vol.% Simulated soil moisture Particle marginals
Figure 9. Simulated particle distribution in mimicry of the
Wei-herbach, 40 min after irrigation onset. A video of the simulated dy-namics is given in the Supplement.
5.2 Reproduction of irrigation experiment
The last benchmark is the reproduction of observed tracer profiles based on measured parameters (test aspect e).
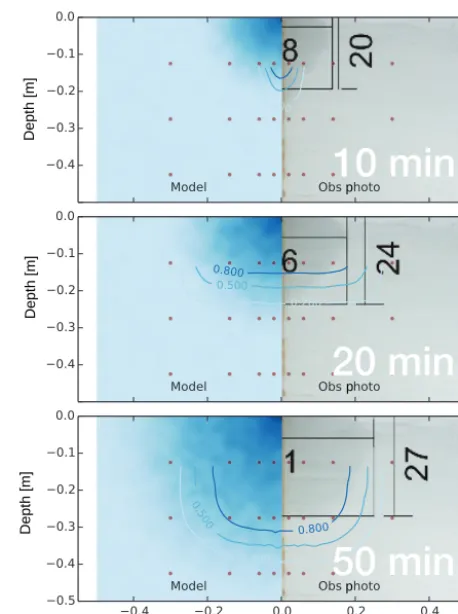
The simulation depicts the observed stain patterns and concentration profiles very well (Fig. 9; see video in the Sup-plement). Despite a lack of precise observation of the actual non-uniform flow dynamics, the simulated behaviour also matches the time-lapse GPR records. In combination with the GPR data, the simulation snapshot taken at about one-third of the irrigation period refers well to the profiles of tracer and soil water content recorded in the field (Fig. 10). For compa-rability, the simulated distribution of new water particles is converted to a tracer mass by assuming a domain thickness of one particle diameter, referring the simulated mass to the sampled volume and applying the Br− concentration in the irrigation solution. Moreover, the snapshot is scaled to the total irrigation to be conclusively comparable to the recov-ered profile. Despite overall good fit with the first hump, the profile still deviates at shallow accumulation around 0.05 m and at deeper percolation to 0.3 to 0.4 m. Although the GPR records also suggest that the second concentration hump is resulting from deeper percolation just after the reference time of 45 min, the model runs had to be seized after this time due to computation time constraints. However, the generally rea-sonable recovery of the BTC is very much in line with the findings in the generic application tests presented earlier. The overall shape of the distribution of new particles was estab-lished relatively soon after irrigation onset, while the fast and slow fractions are fixated after the end of irrigation.
Changes in soil water content are accumulated to the in-tegration volume of the TDR sensor for better comparison (Fig. 10b). The simulation fits between the reference records at 28 and 60 min after irrigation onset. While the overall shape of the profile is plausible, the high water content near the surface is not reflected in the early soil moisture measure-ments. It is noteworthy that because of the large integration
0 10 20 30 40 50 Br- (mg)
−0.7 −0.6 −0.5 −0.4 −0.3 −0.2 −0.1 0.0
De
pt
h
(
m
)
Simulation after 45 min (scaled) Reference core sample after 24 h
0.00 0.05 0.10 0.15 0.20 ∆ theta (m3m-3)
−0.7 −0.6 −0.5 −0.4 −0.3 −0.2 −0.1 0.0
Simulation after 45 min Simulation accum. to measurement reference volume Irrigation onset 28 min 60 min 94 min 23 h
[image:12.612.313.543.68.225.2](a) (b)
Figure 10.Simulated and observed tracer(a)and soil moisture
pro-files(b) in the irrigation experiment. Tracer mass scaled to core sample volume and total irrigation after 2 h.
volume of the sensor, many of the characteristics of the pro-file are strongly smoothed out.
A closer look at the outcrops in Fig. 4 exhibits a devia-tion of the wetting front and the stain pattern, which hints at chromatographic effects due to a shift in flow velocities switching from high velocities during well-supplied states near saturation to a purely diffusive transport. This process is represented in the model too: the flow in the macropores takes place at different velocities until very shortly after the end of irrigation. Then diffusive redistribution alone governs the lateral water transport. Similar results have been found in Brilliant Blue tracer experiments and simulations with the same model by Reck et al. (2018).
Moreover, it can be noted that the modelled depth distri-bution of new particles coincides with the observed tracer breakthrough. This is especially interesting because the macropores are defined as reaching through the full domain as earthworm burrows are reported to reach depths below 2 m. Hence the self-controlled limitation of advective flow in the macropores appears to be capable of reproducing the true process.
6 Discussion 6.1 Model adequacy
capabilities of the model under various macropore settings in heterogeneous soils. In particular, the universality of the pro-posed macropore–matrix exchange concept and the deriva-tion of site- and event-specific breakthrough references de-serves further assessment for upscaling.
During the development we followed Clark et al. (2011) by testing multiple alternative working process hypotheses for (a) the initial irrigation water redistribution, (b) the ini-tial advective velocity reference, (c) the macropore–matrix exchange and (d) the macropore film flow as further detailed in Jackisch (2015). During preliminary testings the set pre-sented here performed most realistically. However, we en-courage further testing and development of more hypothe-ses within the framework. Especially since the Lagrangian method using water itself as particles required the abandon-ment of most of the well-established theories of soil water movement in a Eulerian domain, there is ample room for further adaptations, extensions and even falsification of the proposed ideas. The provided repository of the model shall invite and prepare the community to do so.
Despite the achievements, the echoRD model also has a number of limitations: because the particles do not interact, any solute transport is governed by the fluid movement alone. For the event scale this might be an acceptable assumption. With a molecular diffusion coefficient of bromide in free wa-ter (Dmol=2.5×10⁻⁹m s−1) and an event duration of a few
hours (1×10⁴s) the diffusion length will range in the order of 5×10⁻³m, but for longer simulations this needs explicit consideration.
6.2 Representative structured domain and particle concept
Building on the idea of self-similarity in flow networks going back to the works of Rodriguez-Iturbe and Rinaldo (1997) and Rinaldo et al. (2014) we propose a topologically explic-itly structured domain set-up for the plot scale. The presence and importance of interfaces in soils (among others Has-sanizadeh and Gray, 1990; Lehmann et al., 2012) led to the proposition of the combination of a 2-D matrix, which ac-counts for non-equilibrium lateral and vertical diffusion, and multiple 1-D vertically oriented advective structures, which account for fast vertical redistribution. With this, we also seek to combine some of the existing modelling approaches with multi-phase soil water dynamics (as introduced Jury and Roth, 1990; Vogel and Roth, 2003; Gerke, 2006; Vogel et al., 2006; Sander and Gerke, 2009).
We explicitly avoid a direct and tortuous representation of a macropore network as commonly observed (e.g. for earth-worm burrow systems Capowiez et al., 2003, 2011). All ef-fects connected to friction in the macropore (which includes the inclination of the macropore gallery and pore roughness) are implicitly summed up in Eq. (8). When more information is given, this can be further differentiated in a future adapta-tion. The effect of coatings in earthworm burrows (Jarvis,
2007) has so far been neglected due to a lack of experimen-tal references. As also found to be important in a study on dynamic macropore settings using the echoRD model (Reck et al., 2018), a dynamic coating factor is however foreseen to scale the macropore–matrix interface. Although most of the specific references have been drawn with relation to earth-worm burrows, the current concept is intended to apply to any kind of macropore.
Representativity of the model domain for the plot scale is achieved when the integral of the dynamics is invariant to a larger domain extent under a given desired process resolu-tion. For the mimicry of the irrigation experiment, we eval-uated different domain size definitions for their respective BTC dynamics.
The combination of the particle approach with the con-nected domains avoids a number of implicit assumptions for the exchange between the domains. Our energy-balance ap-proach to film flow in the macropores enables analyses of different infiltration patterns with self-controlled advection and diffusion. In addition to this process hypothesis, many alternative approaches to model the interfacial processes and the behaviour within the respective domains can be imag-ined. For this, the echoRD model allows for direct process hypothesis testing with the same objects.
We have shown that different infiltration patterns emerge based on different antecedent conditions and forcing of the representative structured domain (Sect. 5.1). The influence of different realisations of the representative macropore domain from the same ensemble has been small. This does corrobo-rate the validity of the selection of the representative domain. The non-stationary and non-linear dispersivity underpins the limitations when the processes during driven conditions are subsumed by explicit and universal parameterisation. However, diffusive transport dominates quickly after the sup-ply ceases. This motivates a potential use of the full echoRD model to derive state- and forcing-dependent distribution ref-erences for the advective flow field, which can successively be used in more simple versions of the particle model like our 1-D approach (Zehe and Jackisch, 2016) or the MIPs model (Davies et al., 2011). Moreover, the concept can also be downscaled to analyse porewater fractionation in the va-dose zone, extending our initial binning approach in the pore spectrum. Both aspects are present within the same frame-work. With this, an alternative scaling in the sense of the scaleway (Vogel et al., 2006), but without the need to inter-face different conceptualisations, is possible.
6.3 Capability and limits of the model
for the determination of the diffusive and storage properties of the soil and consist of soil water retention parameters. If desired, the van Genuchten model can be replaced by any other soil water retention model. Each calculation grid node of the matrix domain can be assigned to a different soil ma-trix definition. Macropores host the advective flow and are determined by the spatial distributions (relative lateral dis-tances and connected pore depth) and a reference to maxi-mum flow capacity. In addition some coating factor may be defined for earthworm burrow coatings (Jarvis, 2007) which scales the contact interface to the matrix.
There has been much debate about the derivation of effec-tive parameters in hydrological models (e.g. Bashford et al., 2002; Neuweiler and Vogel, 2007). With the physical de-scription of the two domains and their exchange, the parame-ters become much more specific and scale-aware. Soil water retention properties are determined for the matrix in standard lab procedures, while macropore settings can be quickly as-sessed with dye staining experiments in the field (e.g. Reck et al., 2018). With this, we also aim to contribute to model falsifiability (e.g. Harte, 2002). As it is making direct use of the laboriously gathered and valuable data from experi-ments, surveys and monitoring, it also improves the match-ing of model concepts and hydrological observables (Beven, 1993, 2006). However, the echoRD model is still relying on numerous conceptual assumptions and process approxima-tions which are not scale-independent. As such the model is not suitable for blind upscaling by multiplication of the in-dividual representative domains. Instead, the model delivers a physically based foundation for infiltration statistics which can then inform Markov processes of higher orders.
We envisage further use with dynamic macropore settings as the domain may update once it is empty and as a foun-dation to derive state- and forcing-dependent stochastic site properties which can be used in more lumped versions of the approach. Since the particle domain can always be con-verted into a Eulerian field of matric potential or soil wa-ter content and vice versa, the model can also be linked to a Richards model for periods when the diffusive flow assump-tion is valid.
In the application tests it was seen that the model is quite sensitive to antecedent conditions. Under hardly deter-minable state data this may lead to susceptibility of the model to uncertainty about the macropore–matrix exchange, which can be amplified through the non-linear retention properties. Moreover, the model has shown sensitivity to dead-ended macropores. Hence special care has to be given to provide valid data on the macropore distribution and vertical connec-tivity.
6.4 Numerical concerns
The simulation of soil water dynamics based on water itself as particles is generally very different from the common par-ticle tracking for solutes. On the one hand there is no
ex-ternal drift and the activity of each particle depends on its neighbours. On the other hand a very large number of parti-cles is needed to enable robust calculation of the low event signal against a rather high background or pre-event concen-tration. The reason for this is that the resolution of the pro-cess dynamics scales with the number of particles per vol-ume reference (grid cell in our case). At the same time we require relatively small volume references to avoid integra-tion over scales that are too large. All of these points demand a large number of particles which require frequent state up-dates about their relative concentration distributions and bin-ning in the porewater space. Moreover, the calculation of film flow with many particles is similarly self-dependent.
The Courant and Neumann criterion for the time step con-trol calculates a global specification. Hence local wetting causes very small time steps for the whole model. In com-bination with the previous concerns, this makes the model computationally very expensive. Due to the self-dependent state, we could not find any option to make use of the more efficient continuous time random walk methodology (Met-zler and Klafter, 2000; Delay and Bodin, 2001; Dentz et al., 2012).
In the current state of experimental code, the model runs at about 10 to 200 times more slowly than the real time of the simulated case. Despite its potential, we abandoned trials using grid-free methods to calculate the particle density, e.g. by Voronoi polygon area calculation (Rycroft, 2009), as they multiplied the calculation effort even further. A next step will be to optimise the model for performance in the frequent state updates.
6.5 Model-based extension of real-world experiments
One of the intended uses of the model is to overcome the limitations of destructive irrigation experiments. So far it is impossible to repeat tracer-based plot irrigation experiments as the site needs excavation for sampling. Moreover the spa-tial and temporal scales of such experiments are very dif-ficult to observe (Jackisch et al., 2017). Since the model is promising with regard to simulating infiltration, advective flow, macropore–matrix exchange and diffusive redistribu-tion without explicit exchange parameterisaredistribu-tion, it provides opportunities for virtual experiments on the controls of non-uniform subsurface flow.
Besides the initial development of flow fingers and the evolution of the skewness of the depth distribution of the event water (Sect. 5.1), another aspect is that a large number of macropores does not necessarily result in deeper percola-tion since the irrigapercola-tion supply is distributed to all effective macropores. This can lead to situations whereby the supply rates in the macropores drop below the macropore–matrix exchange rates. As the model is capable of reproducing this behaviour, we hope that it can contribute to a unification of the debate about the importance of non-uniform flow and preferential flow paths.
7 Conclusions
In a recent paper (Zehe and Jackisch, 2016) we provided the foundation for an alternative representation of soil water dif-fusion based on a random walk of water particles in the space domain. We showed that this is a true alternative to solvers of the Richards equation. In this study, we extended the ap-proach to a multi-domain model of infiltration, advection and diffusion in a representative structured domain, with a 2-D matrix hosting topologically explicit 1-D macropores as a physical and least adequate representation of the processes – the echoRD model (ecohydrological particle model based on representative domains).
In a series of application tests we showed the model’s ca-pability to represent (a) 2-D diffusive, non-uniform soil water redistribution, (b) self-controlled interaction of the 1-D ad-vective paths with the 2-D soil matrix, (c) sensitivity to state variables and observable model parameters and (d) robust-ness of the representative macropore setting based on macro-pore depth distributions. Moreover, the model was success-fully used to mimic a real-world irrigation experiment based on measured parameters.
This implies the structural adequacy of the model sim-ulating advective flow as dynamic film flow in topologi-cally explicit macropores and accounting for macropore– matrix exchange based on an energy-balance approach. The multi-domain interplay of advective and diffusive soil wa-ter redistribution exhibited a non-linear temporal evolution of the dispersivity. While the process description appears to be rather sophisticated, its parameterisation is very simple as the model relies on soil water retention properties for the soil matrix and data on the depth distribution of effective macro-pores.
As the model is intended to be a learning tool to extend real-world experiments, we have shown its potential for vir-tual experiments under different antecedent states, macrop-ore settings and precipitation forcing. The model is also en-visaged to deliver a physically based foundation for infiltra-tion statistics, which can then inform Markov processes of higher orders in simpler 1-D versions of the model (Zehe and Jackisch, 2016) scaling the approach to the hillslope by means of definition of representative soil domains connected to an explicit lateral structure (Zehe et al., 2014).
Appendix A: Variables used
Symbol Description Unit
D(θ ) Diffusivity m2s−1
Ekin Kinetic energy kg m2s−2
ε Dissipation kg m2s−2
η Dynamic viscosity of water kg m−1s−2
g Gravitational acceleration m s−1
I Impulse counteractingEkin kg m s−1
k(θ ) Unsaturated hydraulic conductivity m s−1
m Mass kg
n Count –
9 Matric head Pa
ψ Matric head as column water m
q Flux m s−1
R Macropore radius m
rparticle Particle radius m
ρ Density of water kg m−3
t Time s
θ Volumetric soil water content m3m−3
u Advective velocity in matrix m s−1
v Advective velocity in structures m s−1
V Volume m3
x Lateral distance m
ξ Uniform random number−1 . . . 1 –
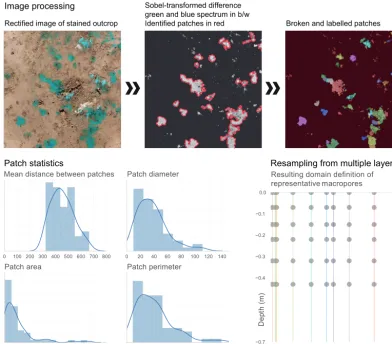
Appendix B: echoRD model set-up and preprocessor The echoRD model can be set up based on soil water reten-tion data (as a table of van Genuchten parameters) for differ-ent soil layers and any sort of information about the macro-pore distribution. The easiest way is to provide images of horizontal outcrops of dye stain patterns to the preprocessor. The rectified and cropped images with a defined resolution are read and analysed for stained patches using scikit-image (van der Walt et al., 2014) and scipy.ndimage packages. To do so, the patches are identified by using the watershed image processing in scikit-image (Beucher and Lantuejoul, 2006) based on a Sobel-transformed difference of the green and blue spectrum of the RGB image. Small patches below a given threshold are discarded. Large patches are assumed to consist of multiple macropores and are broken down by means of watershed segmentation. After removal of clutter the patches are labelled and their geometry is assessed.
In a next step these identified patches are analysed for distribution of topological parameters like total number, dis-tance, size and diameter. Based on the least density among all horizons, the representative domain is scaled so that at least one effective macropore exists in the sparsest case. Thus, the fewer macropores, the larger the domain.
Subsequently, topological parameters are then resampled on the representative domain by allocating all representative macropores to a certain position on the 2-D matrix domain based on the observed lateral distance distribution. Moreover, contact areas are defined, depending on the circumference distribution of the patches.
An example is given in Fig. B1. The code is included in the repository and initiated by
Rectified image of stained outcrop
Sobel-transformed difference
green and blue spectrum in b/w
Identified patches in red Broken and labelled patches
0 100 200 300 400 500 600 700 800 0 20 40 60 80 100 120 140
0 2000 4000 6000 8000 10 000 12 000 0 100 200 300 400 500 600
Mean distance between patches Patch diameter
Patch area Patch perimeter
0.0 0.2 0.4 0.6 Width (m)
−0.7 −0.4 −0.3 −0.2 −0.1 0.0
De
pt
h
(m
)
Resulting domain definition of representative macropores
Image processing
[image:18.612.103.496.71.415.2]Patch statistics Resampling from multiple layers
Figure B1.Example of preprocessing of stain images, patch identification and statistics and resulting macropore positions in the
0 20 40 60 80 Rel. saturation of matrix (%) 101
103 105 107 109 1011 1013 1015
Exfiltration time (s)
Soil type Sand Sandy loam Silt loam Clay loam
[image:19.612.313.542.66.373.2]1 min 5 min 30 min
Figure C1.Exfiltration time of a particle from the macropore wall
into the adjoined soil matrix for different soils and soil moisture states.
Appendix C: The echoRD repository
This paper is accompanied by a repository at GitHub, in which the echoRD model and the presented test cases are made publicly available: https://github.com/cojacoo/ echoRDmodel. The model is developed and tested based on Python 3.5.2. The examples are given as Jupyter Notebooks and as standalone scripts. The packages NumPy, SciPy, Pan-das and Matplotlib are required. The preprocessor requests more specific packages as outlined there.
All software and data are given under the GNU General Public License (GPLv3) and the Creative Commons License (CC BY-NC-SA 4.0) respectively. This is scientific, exper-imental code without any warranty or liability in any case. The code is not fully optimised yet and calculations are com-putationally demanding. However, you are invited to use, test and expand the model at your own risk. If you do so, please contact the first author and repository owner to keep them informed about bugs and modifications.
The repository holds the folder echoRDwith the model engine and the foldertestcasewith routines controlling the model and several set-ups and exemplary results. For a quick view, the Jupyter Notebooks can be accessed online from the repository home. If you want to run the model your-self, please clone and fork the repository.
Appendix D: Synthetic references for exfiltration from macropores into the surrounding matrix
In Sect. 3.3.3 we present the dynamic calculation of macropore–matrix interaction. On this basis one can calcu-late a mean exfiltration time of a particle at the pore wall for different properties and states of the surrounding soil matrix. Figure C1 presents results for different soils defined accord-ing to Carsel and Parrish (1988). Counteractaccord-ing saturation of the matrix in case of limited drainage is neglected.
10 min
20 min
50 min
Depth [m]
Depth [m]
Depth [m]
Width [m] p p p
(a) (b)
Figure D1.Diffusive exfiltration from an irrigated artificial
macro-pore. Experiment by Germer and Braun (2015). The irrigation rate was 3.78 L h−1. (a): model simulation of relative saturation (the half cylindrical column is assumed as planar column).(b): observed photograph of proceeding wetting front (vertical and lateral extent marked by black annotation). Contour lines: relative saturation cal-culated and interpolated from tensiometer (red dots) measurements.
[image:19.612.87.250.68.203.2]Appendix E: Further model figures
Figure E1 presents breakthrough curves of the different soils used in the generic application tests.
The videos of the modelled evolution of soil water content are given in the Supplement.
0 5 10 15
Loamy sand
−0.7 −0.6 −0.5 −0.4 −0.3 −0.2 −0.1 0.0
De
pt
h
(
m
)
0 5 10 15
Silty loam
0 5 10 15
Loess silt
31 % 10 mm 15 % 10 mm 31 % 40 mm 15 % 40 mm 31 % 60 mm 15 % 60 mm Particles x1000
Figure E1.Simulated depth distribution of new particles in generic