Chemistry Theses Department of Chemistry
Summer 7-19-2011
Synthesis and Characterization of Metal Nanoclusters Stabilized
Synthesis and Characterization of Metal Nanoclusters Stabilized
by Dithiolates
by Dithiolates
Donald A. Robinson III
Georgia State University, [email protected]
Follow this and additional works at: https://scholarworks.gsu.edu/chemistry_theses
Recommended Citation Recommended Citation
Robinson, Donald A. III, "Synthesis and Characterization of Metal Nanoclusters Stabilized by Dithiolates." Thesis, Georgia State University, 2011.
https://scholarworks.gsu.edu/chemistry_theses/44
This Thesis is brought to you for free and open access by the Department of Chemistry at ScholarWorks @ Georgia State University. It has been accepted for inclusion in Chemistry Theses by an authorized administrator of
by
DONALD ARLINGTON ROBINSON, III
Under the Direction of Dr. Gangli Wang
ABSTRACT
Rapidly expanding research in nanotechnology has led to exciting progress in a versatile
array of applications from medical diagnostics to photocatalytic fuel cells. Such success is due to
the ability of researchers to manipulate the desired properties of nanomaterials by controlling
their size, shape, and composition.Among the most thriving areas of nanoparticle research has
been the synthesis and characterization of stable metallic nanoclusters capped by thiolate ligands.
Our group has extended this research to study copper, silver, and gold clusters with remarkable
stability and energetics, which was achieved by using dithiolates as the ligand stabilizers. In
addition to the enhanced stability offered by the chelate effect, the use of dithiolate ligands
instead of monothiolates is proposed to provide an alternate interfacial bond structure that is
shown to strongly influence energetic properties of nanoclusters, with strong evidence of
metal-ligand charge transfer. Energetic properties were characterized by spectroscopic and
electrochemical methods.
by
DONALD ARLINGTON ROBINSON, III
A Thesis Submitted in Partial Fulfillment of the Requirements for the Degree of
Master of Science
in the College of Arts and Sciences
Georgia State University
Copyright by
by
DONALD ARLINGTON ROBINSON, III
Committee Chair: Dr. Gangli Wang
Committee: Dr. Markus Germann Dr. Gabor Patonay Dr. Hao Xu
Electronic version approved:
Office of Graduate Studies
College of Arts and Sciences
Georgia State University
DEDICATION
I dedicate this work to the memory of my father, Donald Arlington Robinson, Jr. I also
devote this to my wonderful family; especially my mother, Mary, and my wife, Caroline, for
ACKNOWLEDGEMENTS
I express the utmost gratitude to Dr. Gangli Wang for the opportunity to work on this
fascinating project and for all the motivation and guidance he has provided. I want to also thank
my colleague, Zhenghua Tang for training me in the laboratory and for all his collaborative
efforts. Additionally, I thank Dr. Dabney Dixon for all her tips on good presentation and
professionalism. I am also very appreciative for the assistance from Hui Zhao of the GSU AFM
laboratory and Dr. Siming Wang along with all the members of the GSU mass spectrometry
facility. And last but not least, I would like to recognize the collective teamwork from all the
members of the Gangli Wang research group, who have greatly inspired me throughout my time
TABLE OF CONTENTS
LIST OF TABLES ix
LIST OF FIGURES x
LIST OF ABBREVIATIONS xiii
CHAPTER
1. INTRODUCTION ... 1
1.1 Metal Nanoparticles and Thiolate-Stabilized Metal Nanoclusters ... 1
1.2 Gold Nanoclusters ... 3
1.2.1 Synthesis of AuMPCs ... 3
1.2.2 Structure of the AuMPC ... 5
1.2.3 Energetics of the AuMPC ... 6
1.2.3.1 Optical Absorption ... 7
1.2.3.2 Electrochemistry ... 8
1.2.3.3 Luminescence ... 10
1.2.4 Other Methods of Characterization ... 11
1.2.5 Applications of AuMPCs ... 12
1.3 Silver Nanoclusters ... 13
1.3.1 Silver Nanoclusters Stabilized by Thiolates ... 13
1.3.2 Silver Nanoclusters Stabilized by Dithiolates... 15
1.4 Copper Nanoclusters ... 15
1.4.1 Copper Nanoclusters Stabilized by Thiolates ... 16
1.4.2 Potential Applications of Copper Nanoclusters ... 16
2. ENERGETIC PROFILE OF MIXED THIOLATE GOLD CLUSTERS ... 18
2.1 Introduction ... 18
2.2 Results and Discussion ... 18
2.2.1 Electrochemistry of Au130MTCs ... 18
2.2.2 Correlation of Electrochemical and Optical Energetics ... 22
2.2.3 Electrochemistry of Durene-DT Ligand ... 23
2.2.4 Metal to Ligand Charge Transfer Quantization ... 25
2.3 Conclusions ... 28
3. SILVER DITHIOLATE-STABILIZED NANOCLUSTERS ... 30
3.1 Introduction ... 30
3.2 Synthesis ... 30
3.3 Results and Discussion ... 31
3.4 Conclusions ... 35
4. COPPER DITHIOLATE-STABILIZED CLUSTERS ... 36
4.1 Introduction ... 36
4.2 Hydrophobic CuDTCs Stabilized by Durenedithiolate ... 36
4.2.1 Synthesis ... 37
4.2.2 Results and Discussion ... 39
4.2.3 Conclusions ... 43
4.3 Hydrophilic CuDTCs Stabilized by Dimercaptosuccinic Acid ... 44
4.3.1 Synthesis ... 44
4.3.2 Results and Discussion ... 45
5. SUMMARY ... 49
6. REFERENCES ... 50
7. APPENDICES ... 55
A. Chemicals ... 55
B. Measurements ... 55
C. Synthesis of AuMTCs ... 56
D. Synthesis of LA AgDTCs ... 56
E. Synthesis of Durene-DT CuDTCs ... 56
LIST OF TABLES
Table 1. Formal potential spacings for the AuMTCs, data calculated from Figure 13. ... 21
LIST OF FIGURES
Figure 1. Cartoon illustrating the basic structure of a metal nanocluster protected by
monothiolate ligands. ... 1
Figure 2. Results of a SciFinder® search for various thiolate-protected metal nanoparticles. ... 2
Figure 3. Diagram for the synthesis of AuMPCs, one-phase and two-phase approaches. ... 4
Figure 4. Crystal structure of Au25(SR)18 [image taken without permission from ref. 41].
Thiolate ligands (SR) that have proven effective in the synthesis of Au25MPCs are shown in
bottom panel. ... 6
Figure 5. (a) UV/Vis absorption spectra for AuMPCs of varying core sizes [image taken without permission from ref. 38]. (b) Absorption spectrum for Au144(SR)60. (c) Absorption
spectrum for Au25(SCH2CH2Ph)18. ... 7
Figure 6. (a) Differential pulse voltammogram for Au144(SR)60 [image taken without permission
from ref. 51]. (b) Differential pulse voltammogram for Au25(SR)18 [image taken without
permission from ref. 52]. ... 8
Figure 7. Energy diagram correlating optical and electrochemical responses, using a
combination of optical band values from UV/Vis absorption spectroscopy and electrochemical band gap values from voltammetry [image taken without permission from ref. 52] ... 9
Figure 8. Summary of electrochemical behavior by MPC core size, showing estimated energy gaps (HOMO-LUMO gaps) and electrochemical energy gaps [image taken without permission from ref. 6]. ... 10
Figure 9. Cartoon diagram showing the relaxation pathways in Au25(SR)18 clusters. [image
taken without permission from ref. 58]. ... 11
Figure 10. (a) PAGE separation for both Agx(GS)y and Aux(GS)y mixtures. (b) Optical
absorption spectrum for select fractions of Agx(GS)y from PAGE [images taken without
permission from ref. 97]. (c)Absorption spectrum of monodispersed Agx(GS)y(CS)z clusters
with varying pH [image taken without permission from ref. 92]. ... 14
Figure 11. Cyclic voltammograms of the Au130 MTCs in CH2Cl2 with 0.1 M TBAP,
measurements were taken at low temperature (-70 °C) and 100 mV/s scan rate. ... 18
Figure 12. (a) Square wave voltammogram (SWV) of AuMTCs, recorded in 0.1 M TBAP in CH2Cl2 solvent at -70°C. (b) Zoom in of oxidation scan in SWV with one corresponding
Figure 13. SWV oxidation scan of the Au130 MTCs from Figure 6 with 1st derivative plot shown
in bottom panel. Stars indicate peaks used for optical correlation. ... 20
Figure 14. Differential pulse voltammogram of the Au130 MTCs in CH2Cl2 with 0.1 M TBAP, measurement was taken at narrow potential range, room temperature. ... 20
Figure 15. Energy diagram that correlates optical and electrochemical features. The SWV oxidation scan (left) and absorbance spectrum (right) are aligned based on the energy states shown in the middle. The undetermined degeneracy of those states are denoted x, y and z. ... 22
Figure 16. (a) Cyclic voltammograms of (green)25 mM ferrocene, (red) 25 mM durene-DT, and (blue) reduction peak for AuMTCs (data scaled by factor of ten for clarity). All scans were performed with 0.1 M TBAP supporting electrolyte in CH2Cl2 and 100 mV/s scan rate, Pt disk
working electrode (7.4 μm). CV of AuMTCs was recorded at ca. -70°C in dry ice/acetone bath. (b) Structural representation of durene-DT reduction to durene-disulfide radical anion and oxidation to durene-disulfide. ... 24
Figure 17. Plot of peak currents measured from CV versus square root of the scan rate for QDL peak 2. ... 26
Figure 18. (a) CVs at various scan rates for LUMO peak collected at -76°C with corresponding ip vs. v1/2 plot. (b) CVs at various scan rates for QDL peak 2 of AuMTCs collect at RT with
corresponding ip vs. v1/2 plot. The linear fit and corresponding slope, m, is also shown. CVs were
recorded using 7.4 μm Pt electrode in CH2Cl2 with 0.1 M TBAP supporting electrolyte. ... 28
Figure 19. Synthetic scheme for LA AgDTCs. Cartoon of cluster is not drawn to scale or indicative of composition. ... 31
Figure 20. Optical absorption spectrum for as-synthesized AgDTCs. Inner panel shows
absorption plotted on energy axis and labeled peak energies. Green label points to the absorption band edge. ... 32
Figure 21. (left panel) UV-Vis absorption spectrum of 2X-LA-Ag synthesis, pH effect, and purification. (right panel) Fluorescence spectra of LA-AgDTCs in NaOH solution, 3 nm slitwidth with photograph of LA-AgDTCs under UV lamp radiation. ... 32
Figure 22. Optical absorption spectrum for AgDTCs in dichloromethane after phase transfer with tetraoctylammonium bromide. ... 33
Figure 23. H-NMR Spectrum for LA AgDTCs in D2O solvent. ... 34
Figure 24. Two-phase synthesis of CuDTCs with durene-DT ligands. ... 37
chloride after phase transfer (blue). (b) Absorption spectra of the aqueous phase during phase transfer of copper cation to organic phase (CHCl3) using ascorbic acid reduction procedure;
copper(II) chloride before phase transfer (red), copper(I) chloride formed by ascorbic acid reduction before phase transfer (purple), copper(II) chloride formed by H2O2 oxidation of
copper(I) chloride after phase transfer (blue), and an equimolar solution of copper(II) chloride reduced by ascorbic acid, then oxidized back to copper(II) chloride by H2O2 without organic
phase mixing (green). ... 38
Figure 26. 1H-NMR spectrum for CuDTCs in deuterated dichloromethane solvent. ... 40
Figure 27. Fourier transform infrared (FTIR) spectrum for CuDTCs. Dashed circle indicates where S-H stretching would be observed for thiol. ... 40
Figure 28. UV/Vis absorption spectrum for purified CuDTCs in dichloromethane. ... 41
Figure 29. (left)Cyclic voltammogram of CuDTCs in dichloromethane, 100 mV/s scan rate and (right) corresponding differential pulse voltammogram (bottom panel). ... 42
Figure 30. MALDI-MS (+) reflectron mode for CuDTCs with DCTB matrix, laser intensity 5000. ... 42
Figure 31. AFM image for CuDTCs and height profiles for three particles. ... 43
Figure 32. One-phase synthesis of CuDTCs with DMSA ligands. Cartoon of cluster is not drawn to scale or indicative of composition. ... 45
Figure 33. 1H-NMR spectrum for CuDTCs in D2O. ... 45
Figure 34. FTIR spectrum for CuDTCs. Dashed circle indicates where S-H stretching would be observed for thiol. ... 46
Figure 35. Representative AFM image of CuDTCs (left panel) and histogram showing height distribution for randomly measured particles (right panel). ... 46
Figure 36. UV/Vis absorption spectrum for purified CuDTCs in water. ... 47
LIST OF ABBREVIATIONS
A surface area of electrode
AFM atomic force microscopy
C concentration
CS captopril
CV cyclic voltammetry/voltammogram
D diffusion coefficient
DCM dichloromethane
DMSA dimercaptosuccinic acid
DOSY diffusion-ordered spectroscopy
DPV differential pulse voltammetry/voltammogram
DTC dithiolate-protected cluster
Durene-DT durene-(α1, α2)-dithiol
E energy
Echg charging energy
Egap electrochemical band gap energy
Eopt optical band gap energy
ECHEM electrochemistry
ESI electrospray ionization
ET electron transfer
FTIR Fourier-transform infrared
4-FTP 4-fluorothiophenol
GS glutathione
H2MSA mercaptosuccinic acid
HOMO highest occupied molecular orbital
ip peak current
IR infrared
LA alpha(+/-) lipoic acid
LUMO lowest unoccupied molecular orbital
MALDI matrix-assisted laser desorption ionization
MPC monothiolate-protected cluster
MS mass spectrometry
MTC mixed-thiolate protected cluster
n number of atoms, number of electrons transferred
nDur number of durene-DT electrons transferred
nQDL number of electrons transferred in gold core by QDL charging
NIR near-infrared
NMR nuclear magnetic resonance
ORR oxygen reduction reaction
PAGE polyacrylamide gel electrophoresis
PhC2S phenylethanethiol
PL photoluminescence
QDL quantized double layer charging
RT room temperature
SH thiol
SPR surface plasmon resonance
SR generic monothiolate ligand
TBAP tetrabutylammonium perchlorate
TEM transmission electron microscopy
TOA tetraoctylammonium
UV ultraviolet
v scan rate
ΔV change in potential, charging energy
Vis visible
X halide
1. INTRODUCTION
1.1 Metal Nanoparticles and Thiolate-Stabilized Metal Nanoclusters
Great advances have been achieved in recent decades toward the development of metallic
nanoparticles with control over size, shape, and composition in order to fine tune the desired
properties.1 Tailoring the properties of nanoparticles is important for various applications,
including medicine,2-4 nanoelectronics,2,5,6 and catalysis.2,5,7 Many different types of ligands and
ionic surfactants8-12 can be used to stabilize nanoparticles and control their growth. The most
popular ligand stabilizers include ligands such as carboxylates,13,14 amines,15-17 thiolates,8-12 and
dendrimers.18-20 Our group focuses on thiolates as stabilizers, as they have so far proven to be the
most suitable ligands in a solution-based synthesis to effectively control the aggregation of noble
metal atoms and ultimately form stable nanoclusters* with high monodispersity (i.e. uniform
size, shape, and composition).8-12 We propose that dithiolates will provide even stronger
enhancement to stability due to entropy gain.21 Shown in Figure 1 is a simplified model for the
monothiolate-protected cluster (MPC), composed of one spherical cluster of zerovalent metal
atoms forming the core with the ligands (in this case monothiolates), forming a protective
monolayer shell around the cluster.
Figure 1. Cartoon illustrating the basic structure of a metal nanocluster protected by monothiolate ligands.
*Although the terms “nanoparticle” and “nanocluster” are commonly used interchangeably, for the purpose of this
[image:17.612.168.415.515.618.2]MPCs of various transition metal cores have been synthesized, including but not limited to
platinum, palladium, gold, silver, and copper. Gold is by far the most well-researched core metal
for MPC synthesis and characterization, as shown in the pie chart in Figure 2. Gold’s popularity
in nanoparticle and self-assembled monolayer research is largely based on its relative inertness
(e.g. resistance to oxidation), yet strong binding affinity for thiolates.22,23 Therefore gold has
many of the same advantages of platinum and palladium without the cost. Of course, gold is still
very expensive, and it would be ideal to expand the research base to more cost effective
transition metals. Silver ranks in a distant 2nd place for overall depth of research. Elemental
silver, however, can react with atmospheric oxygen under ambient conditions, so a more careful
synthesis is required. The most difficult metal to work with out of the five listed below is copper,
which is the most reactive, thus making the synthesis of stable copper nanoclusters a very
challenging task. However, the affinity of copper and silver to thiolates is comparable to that of
[image:18.612.160.417.432.678.2]gold, so thiolates are preferred over other ligands such as amines or carboxylates.24
1.2 Gold Nanoclusters
While gold nanoparticles have been synthesized using non-thiolate ligands such as amines,25
carboxylates,14 and dendrimers,26 the particles synthesized by these methods are primarily large
in size and relatively polydispersed. Gold nanoclusters synthesized using thiolate ligands are
generally smaller and more monodispersed in comparison. Due to the extensive literature
background on gold monothiolate-protected clusters (AuMPCs), a concise review of AuMPC
research serves as an appropriate introduction to metal nanoclusters in general. It should be noted
that the characteristics of metal nanoclusters composed of different metal cores (e.g. copper,
silver, platinum) are not expected to mimic the properties of AuMPCs based on similarities in
size, shape, or metal atom core composition. However, the experimental methods used to
investigate AuMPCs have proven relevant and necessary in the characterization of nanocluster
species with alternative metal and/or ligand types, as evidenced in the chapters to come.
1.2.1 Synthesis of AuMPCs
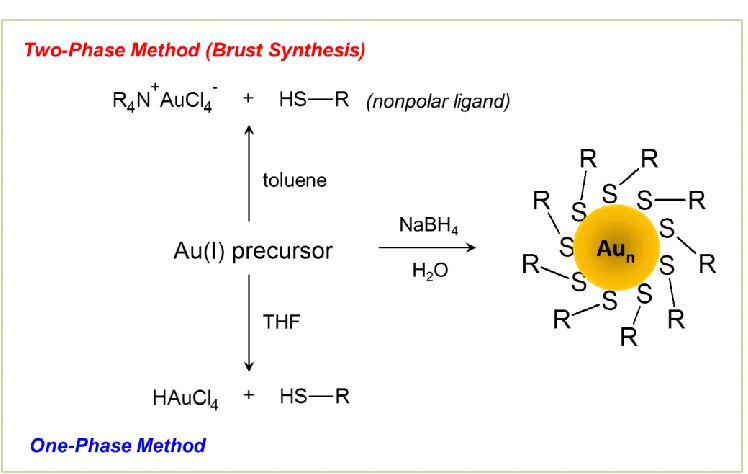
A general outline of the synthesis of AuMPCs is shown in Figure 3. The most commonly used
synthetic procedure is the Brust-Schriffin method,27 which involves a two-phase aqueous and
organic system. First, an aqueous solution of the gold salt is mixed with a solution of the
quaternary ammonium phase-transfer reagent (R4N+) in nonpolar organic solvent (commonly
toluene). The aqueous phase is usually removed after all of the gold is transferred to the organic
phase. Next, the desired thiol compound is added to the organic phase, resulting in a color
change from dark yellow/orange to colorless solution, indicating the reduction of Au3+ to Au+.
The final step involves the addition of excess sodium borohydride in aqueous solution. The
borohydride reduces Au+ to Au0, resulting in nanoparticle nucleation and growth, which is
mixed-solvent one phase method can also be used, whereby the gold salt and thiols are reacted
together in a polar organic solvent, such as THF. The second step is similar to the two-phase
method, whereby excess sodium borohydride in water is added to achieve complete reduction of
gold and trigger AuMPC formation.9,28 Water-soluble AuMPCs have also been prepared without
the use of phase-transfer reagents in water/methanol mixed solvent reaction systems29,30 and
[image:20.612.120.494.228.465.2]all-aqueous systems31,32 using thiols with polar functionalities.
Figure 3. Diagram for the synthesis of AuMPCs, one-phase and two-phase approaches.
The mechanistic details of AuMPC synthesis are poorly understood, although researchers
have made significant progress in recent years.33-36 The Au(I) precursor of the two-phase method
was generally assumed to be a polymeric Au(I)-thiolate complex. Such polymers could be
observed by dynamic light scattering and the size uniformity of these polymers was confirmed to
affect the monodispersity of resulting AuMPCs.10 Yet, under anhydrous conditions the precursor
was determined by Goulet and Lennox to be a complex of Au(I) with R4N+.33 The thiols, upon
polar solvents are employed, Au(I) thiolate complexes are in fact the precursors. It was later
discovered that the R4N+ actually forms an inverse micelle structure with the anionic gold halide
complex for both the Au(III) and Au(I) species.34 It was further revealed that if water is present
during thiol mixing, the resulting precursor is a mixture of a [R4N+][AuX2] complex micelles and
polymeric [Au(I)SR]n. The amount of water present after phase-transfer is important for the
composition of this mixture. As more water is introduced, the amount of [Au(I)SR]n increases.
Water is encapsulated inside the polar core of the inverse micelles and was found to function as a
proton acceptor to remove the thiol proton, thus facilitating the formation of [Au(I)SR]n
polymers.35 This mechanistic detail also explains why [Au(I)SR]n polymers are the observed
precursor in the one-phase syntheses using polar solvents. After the addition of sodium
borohydride, the evolution of AuMPC size is controlled by the amount of thiol in the system. It
has been shown repeatedly that smaller, more monodispersed AuMPCs are resulted from
syntheses that use relatively higher thiol:Au synthetic ratios.32,37,38
1.2.2 Structure of the AuMPC
The thiolate-gold interfacial bonding structure on the nanocluster surface remained a mystery
for the greater period of AuMPC research, until the elucidation of the “staple” motif in 2008.39
More recently, complete structures have been experimentally resolved for a select few AuMPC
compositions, including Au25(SR)18, Au38(SR)24, and Au102(SR)44 by X-ray crystallography.40-43
The crystal structure of Au25(SR)18 is shown in Figure 4, along with different monothiolate
ligands that have been used to successfully synthesize the AuMPC with monodispersity. The
core structure consists of thirteen gold atoms total, as one gold atom is entrapped within a
forming the staple-like S-Au-S-Au-S structure. Both gold core and interfacial bonding structures
contribute to the energetic properties of AuMPCs, which is discussed next.
Figure 4. Crystal structure of Au25(SR)18 [image taken without permission from ref. 41].
Thiolate ligands (SR) that have proven effective in the synthesis of Au25MPCs are shown in
bottom panel.10,44-46
1.2.3 Energetics of the AuMPC
The energetic properties for AuMPCs have been extensively studied.6,47,48 The characteristics
of gold nanoparticles differ drastically from those of bulk gold, and these differences become
more substantial with decreasing particle size, due to quantum confinement. For the especially
small AuMPCs (75 gold atoms or less), optical and electrochemical features resemble those of a
small complex. Slightly larger AuMPCs such as Au144(SR)60 exhibit energetics at the transition
between small molecule and bulk gold. Fascinating energetics has been detected for AuMPCs,
primarily using UV/Vis absorption spectroscopy, fluorescence spectroscopy, and electrochemical
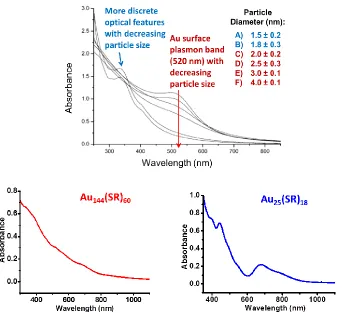
[image:22.612.129.464.123.341.2]1.2.3.1 Optical Absorption
One optical property of gold that is widely exploited for biosensing is its surface plasmon
resonance (SPR). For metal nanoparticles, localized surface plasmons occur, which are collective
charge oscillations in the particle after excitation by light. This phenomenon can be detected by
UV/Vis absorption spectroscopy as the so-called SPR band, which for spherical gold
nanoparticles generally has a 520 nm wavelength. However, for AuMPCs smaller than 2 nm in
diameter, the SPR absorption band is not visible. Discrete optical features appear for
monodispersed AuMPCs, as shown in Figure 5.38 The absorption spectrum for Au144(SR)60
consists of weak shoulders49 while that of Au25(SR)18, which falls into the small molecule
[image:23.612.131.475.346.659.2]category, displays more discrete absorption peaks.45,50
Figure 5.(a) UV/Vis absorption spectra for AuMPCs of varying core sizes. [image taken without permission from ref. 38] (b) Absorption spectrum for Au144(PhC2S)60. (c) Absorption
1.2.3.2 Electrochemistry
The electrochemical properties of AuMPCs also clearly demonstrate the effects of quantum
confinement. Differential pulse voltammograms (DPV) for both Au144(SR)60 and Au25(SR)18 are
displayed below in Figure 6.51,52 These AuMPCs are too small to exhibit the continuum charging
behavior of bulk gold. A single nanocluster’s double-layer capacitance (C) upon electron transfer
is substantially increased as nanocluster size is decreased. In turn, the change in potential (ΔV) is
increased for smaller nanocluster size (Equation 1).
ΔV = ze/C (1)
Therefore, each electron transfer to and from the AuMPC can be specifically detected by
voltammetry, termed “quantized double-layer charging.”6 For Au144(SR)60, several continuous
quantized double-layer charging events are observed, each separated by a regular peak spacing,
which is known as the charging energy, analogous to ΔV.
Figure 6. (a) Differential pulse voltammogram for Au144(SR)60 [image taken without permission
from ref. 51] (b) Differential pulse voltammogram for Au25(SR)18. [image taken without
permission from ref. 52]
In contrast to the continuous charging behavior of Au144(SR)60, the voltammetric response of
and the first reduction peak. Equating the energetics of Au25(SR)18 to that of a small molecule,
this electrochemical band gap is interpreted as an estimate for the energy difference between the
HOMO and LUMO. The pair of peaks at ca. 0.2 V represents the two electron transfers to/from
the HOMO while the pair of peaks at ca. -1.5 V is attributed to the LUMO. At ca. 1.0 V, yet
another pair is resolved, indicating a molecular orbital at an even lower energy state. Each pair of
peaks is separated by a relatively uniform charging energy. An energy diagram was constructed
based on the correlation of electrochemical band gap values from voltammetry to the
HOMO-LUMO optical band gap value determined from the onset of UV/Vis absorption, as shown in
Figure 7.52
Figure 7. Energy diagram correlating optical and electrochemical responses, using a
combination of optical band values from UV/Vis absorption spectroscopy and electrochemical band gap values from voltammetry [image taken without permission from ref. 52].
Using similar experimental techniques, the HOMO-LUMO band gaps were determined for
many more AuMPC compositions. The diagram in Figure 8 displays the general trend for
HOMO-LUMO band gaps with respect to Au core composition for the smaller AuMPCs (Au75,
Au55, Au38, Au25, and Au13). As gold core size decreases, the respective HOMO-LUMO band
HOMO-LUMO small molecule energetics, but are compared based on the magnitude of relative
quantized charging energies, which decreases as gold nanoparticle compositions grow larger
until the voltammetric response is no longer quantized but instead represents the continuum
[image:26.612.89.524.180.436.2]charging behavior of bulk gold.6
Figure 8. Summary of electrochemical behavior by MPC core size, showing estimated energy gaps (HOMO-LUMO gaps) and electrochemical energy gaps [image taken without permission from ref. 6].
Luminescence
Another defining optical characteristic for AuMPCs is its luminescent properties. AuMPCs
less than two nanometers in diameter exhibit luminescence in both the visible and near-infrared
(NIR) range. The wavelength of NIR luminescence for AuMPCs with gold core compositions of
less than 200 atoms is not dependent on core size.53 NIR luminescence intensities have also been
found to increase linearly with proportion of polar thiolate ligands on the monolayer surface.54
Further evidence indicates that the NIR luminescence emission of AuMPCs occurs from excited
bond structure and the nature of the ligand play an important role in NIR fluorescence
emission.32,56-58 A model has been proposed for Au25(SR)18 in which excitation arises from the
Au core, while luminescence decay results from relaxationof the Au13 core states to
S−Au−S−Au−S semi-ring states. Therefore, the higher energy visible emission is dependent on
core size, while the NIR emission is resulted from the electronic transition from S-Au-S-Au-S
[image:27.612.130.487.240.441.2]semi-ring states (LUMO) back to the ground Au13 core states (HOMO) (Figure 9).58
Figure 9. Cartoon diagram showing the relaxation pathways in Au25(SR)18 clusters [image taken
without permission from ref. 58].
1.2.4 Other Methods of Characterization
In addition to being a reliable method for confirming the purity of the sample, nuclear
magnetic resonance (NMR) spectroscopy is a particularly useful technique for AuMPC
characterization. One well known 1H-NMR characteristic of AuMPCs is the line-broadening
effect, which is caused by motion restriction incurred on ligand protons by the rigid interfacial
bond structure. Motion is heavily restricted for protons closest in proximity to the thiolate-gold
for protons on the ligand tails, which experience more freedom and range of motion.37 2D-NMR
methods can also be used to estimate the size of AuMPCs in a monodispersed solution.
Diffusion-ordered NMR spectroscopy (DOSY) was used to determine the diffusion coefficients
of various gold nanocluster species, which by the Stokes-Einstein relationship can be applied to
calculate the effective Bohr radii of each cluster.32,59
Many other methods are used to characterize AuMPCs. X-ray photoelectron spectroscopy
(XPS) is a valuable tool for confirming the oxidation state of gold in the sample, based on the
Au-Au and Au-S binding energies. Various imaging techniques are widely employed to
determine nanoparticle size and sample dispersity, such as transmission electron microscopy
(TEM)27 and atomic force microscopy (AFM).60 AuMPC composition is best resolved by
high-resolution mass spectrometry (MS). The most widely used ionization methods for AuMPC
characterization by MS are matrix-assisted laser desorption ionization (MALDI) and electrospray
ionization (ESI).49,61-63
1.2.5 Applications of AuMPCs
The versatility of AuMPC application has attracted the attention of researchers from various
disciplines. Larger AuMPCs ( > 2 nm ) can be exploited for biosensory applications based on
surface plasmon resonance.64-66 Scientists have extensively studied the possible roles of gold
nanoclusters in new technologies for energy conversion. For example, gold nanoclusters have
been utilized to serve as charge-transfer mediators for semiconductor-based photovoltaic
devices.67 Additionally, AuMPCs have been found to exhibit high catalytic activities for the
catalysis of various reactions important for fuel cell implementation, such as methanol
oxidation68 and oxygen reduction.47,69-73 AuMPCs have also shown great potential for application
1.3 Silver Nanoclusters
Silver is the second-most studied metal nanoparticle behind gold, due to the ease of silver
nanoparticle oxidation by reacting with atmospheric oxygen, leading to decomposition of the
nanoparticles.85 Non-thiolate ligands such as carboxylates,13,85,86 amines,87 and dendrimers26,88
have been used to stabilize silver nanoparticles and nanoclusters with wide size distributions.
One dendrimer-based synthesis has been reported to stabilize very small silver nanoclusters with
a narrow size distribution.89
1.3.1 Silver Nanoclusters Stabilized by Thiolates
The most monodispersed syntheses have been performed by using dithiolate ligands as
stabilizers. Rao et al. recently reported the solid-state synthesis of a monodispersed species,
whose composition was indicated by ESI-MS to be Ag9(H2MSA)7, where H2MSA =
mercaptosuccinic acid. Unfortunately, the stability of Ag9(H2MSA)7 is poor when dissolved in
water, which severely hinders attempts made towards further characterization.90 It is also
arguable whether or not the ion peaks observed by ESI-MS for this species are indicative of the
intact cluster in solution or ion fragments generated in the analysis chamber, as significant ESI
fragmentation is observed for other monodispersed AgMPC species.91,92
Similar to AuMPCs, the absorption spectra for AgMPCs are unique to each cluster
composition within a certain size range, while larger silver nanoparticles all display the SPR
absorption band at ca. 411 nm.90-97 Another reported AgMPC synthesis employed glutathiolate
(GS) as the stabilizing ligand, resulting in a mixture of several AgMPCs, which were separated
by polyacrylamide gel electrophoresis (PAGE).97 By comparing the PAGE separation bands
between the AgMPCs and AuMPCs of known composition synthesized by a similar route, an
each fraction was used to estimate each HOMO-LUMO band gap, and an inverse relationship
[image:30.612.92.524.126.393.2]was established between the magnitude of the band gap and the Ag core size (Figure 10).97
Figure 10. (a) PAGE separation for both Agx(GS)y and Aux(GS)y mixtures. (b) Optical
absorption spectrum for select fractions of Agx(GS)y from PAGE [images taken without
permission from ref. 97]. (c) Absorption spectrum of monodispersed Agx(GS)y(CS)z clusters
with varying pH [image taken without permission from ref. 92].
Cathcart et al. recently reported the synthesis of monodispersed AgMPCs using a mixed
monolayer of GS and captopril (CS) thiolate ligands.92 The absorption spectrum for this species
remarkably resembles that of fraction 6, sharing the same strong absorption peak at ca. 490 nm
(2.5 eV) (Figure 10-B,C). The comparable patterning of the PAGE separation may indicate
structural similarities between band 6 and its respective gold analogue, Au29(GS)20.44,97
Unfortunately, no molecular ions could be resolved for the Agx(GS)y(CS)z clusters by ESI-MS,
only fragments Ag4L4- and Ag4L3-.92 Note that the absorption for the Agx(GS)y(CS)z clusters is
sensitivity is hypothesized to be attributed to the function of the carboxylate groups on each
thiolate ligand molecule, as discussed in Chapter 3.
Unlike AuMPCs, the luminescence emission for AgMPCs is usually only observed in the
visible range,90-92,97 with the exception of 4-fluorothiophenol (4-FTP) capped AgMPCs reported
by Bakr et al., for which the emission maximum was centered at 1375 nm.96 No X-ray crystal
structure has yet been reported for an AgMPC, but it will be interesting to discover how the
interfacial bond structure compares to the staple motif of AuMPCs and how such structural
characteristics govern AgMPC energetics.
1.3.2 Silver Nanoclusters Stabilized by Dithiolates
One synthesis has been reported in literature for a monodispersed dithiolate-stabilized silver
nanocluster (AgDTC) using dimercaptosuccinic acid (DMSA) as the ligand. The resulting
species was given the composition Ag7(DMSA)4 using ESI-MS.98 Contradicting this assignment
is the absorption spectrum, which displays a well-defined peak at 500 nm, bearing a striking
resemblance to band 6 in the PAGE separation, therefore corresponding to a larger core size. It is
possible that the base peak observed in ESI-MS is actually a stable fragment ion of the larger
cluster. But as was mentioned in the introduction of Chapter 1, the properties of AgDTCs cannot
be predicted based on trends set by AgMPCs, so the MS assignment may be correct. The stability
of this AgDTC is an issue which has hindered attempts at characterization.
1.4 Copper Nanoclusters
Reports of successful syntheses are more limited for copper nanoclusters, due to the relatively
higher reactivity of copper versus gold and silver. Copper nanoparticles are easily prone to
oxidation from atmospheric oxygen. Despite these drawbacks, researchers have made substantial
nanoclusters with Cun, (n ≈ < 14), stabilized only by tetrabutylammonium cation.99 For this
synthesis, however, the nanoclusters must be kept in solution with excess tetrabutylammonium
salts to remain stable. Other wet chemical methods employing non-thiolate capping agents as
stabilizers resulted in large copper nanoparticles exhibiting plasmonic properties.17,100-105
1.4.1 Copper Nanoclusters Stabilized by Thiolates
Thiolates have proven so far to be the best choice of ligand for producing stable copper
nanoclusters, due to the strong covalent nature of the Cu-S interaction.24 Monothiolates have
been used to synthesize stable CuMPCs, with some reported clusters being of relatively large
size ( > 2 nm in diameter).106 Other CuMPC syntheses have resulted in smaller, more stable
clusters ( < 2 nm in diameter).107-110 Quantized double-layer charging has been observed for
CuMPCs,107 as well as luminescence in the visible range.110 Much more has yet to be
accomplished in CuMPC research, as there are no known reports for the synthesis and
characterization of a monodispersed sample. The synthesis of copper nanoclusters by using
dithiolate ligands has not been reported by a previous group.
1.4.2 Potential Applications of Copper Nanoclusters
The reactivity of elemental copper gives credence to the potential utilization of copper
nanoclusters as catalysts. In organic synthesis, copper nanoparticles have been exploited as
useful catalysts for various click chemistry reactions.111,112 Efficient catalysis of selective
Michael addition reactions has been achieved using copper nanoparticles in ionic liquid.113
Dispersions of copper nanoparticles on semiconductor surfaces have proven effective in
catalyzing the water-gas shift reaction for oxidation of carbon monoxide.114 In a recent paper,
CuMPCs have shown electrocatalytic activity in the oxygen reduction reaction (ORR).110
currently used platinum-based catalysts for ORR in fuel cell applications. The development of
such affordable catalysts could lead to the realization of fuel cells as economically feasible
alternatives to the combustion of fossil fuels.
1.5 Research Aims: Metal Nanoclusters Stabilized by Dithiolates
To create nanoclusters with novel properties, the primary method of synthesis investigated by
our group involves the use of dithiolates as protecting ligands. The dithiolates are proposed to
have advantages over the more commonly used monothiolates due to the chelate effect, resulting
in clusters with enhanced stability.21 Little progress has been made in understanding the structure
and properties of dithiolate-protected clusters (DTCs), although metal nanoparticle syntheses
have previously proven successful by employing dithiols as stabilizing ligands.32,115-118 It is
hypothesized that the structure and properties of the chosen dithiolate ligand plays a substantial
role in the unique energetics for the resulting DTCs. Described herein is the investigation into
new gold, silver, and copper nanocluster species stabilized by dithiolates with an emphasis on
2. ENERGETIC PROFILE OF MIXED THIOLATE GOLD CLUSTERS
2.1 Introduction
A gold mixed-thiolate protected cluster (AuMTC) was synthesized in our group by employing
a mixture of durenedithiolate (durene-DT) and phenylethanethiolate (PhC2S) as the stabilizing
ligands. The average composition for these clusters was characterized to be
Au130(durene-DT)29(PhC2S)22 by mass spectrometry, H-NMR spectroscopy, and
thermogravimetric analysis.119 Electrochemical methods were used to elucidate the energetics of
the AuMTC. An energy diagram is proposed, correlating the optical and electrochemical
properties. The AuMTC properties do not fit in with the core size trend established by AuMPCs.
While they do display some properties that would be expected based on AuMPC research, e.g.
quantized double layer charging, they also exhibit rich optical features, not previously observed
for AuMPCs of such size.
2.2 Results and Discussion
2.2.1 Electrochemistry of Au130MTCs
Figure 11. Cyclic voltammograms of the Au130 MTCs in DCM with 0.1 M TBAP,
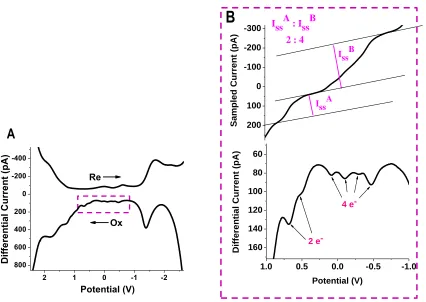
Cyclic voltammograms (CVs) (Figure 11) and square wave voltammograms (SWVs) shown
in Figure 12 were collected at low temperature for better peak resolution at broad potential
window. Precise peak potentials were measured by differentiating the data and extrapolating the
derivative plot to cross zero (Figure 13). Those values corresponding to the notable SWV peaks
were listed in Table 1 for the calculation of electrochemical energetics. Four uniformly spaced
peaks (#2-5) near zero potential can be clearly seen in panel B of Figure 12. This corresponds to
continuous quantized charging of two degenerated energy states. A differential pulse
voltammogram at room temperature is provided in Figure 14, clearly showing the uniform peak
[image:35.612.96.522.319.621.2]spacing between each of the four peaks.
Figure 12. (a) Square wave voltammogram (SWV) of AuMTCs, recorded in 0.1 M TBAP in DCM solvent at -70°C. (b) Zoom in of oxidation scan in SWV with one corresponding sampled current shown above. Step amplitude was at 25 mV with 4 mV increments. Frequency was 15 Hz.
2 1 0 -1 -2
800 600 400 200 0 -200 -400 Potential (V) Diff er ent ial Current ( pA) Ox Re
A
200 100 0 -100 -200 -300 Iss A: IssB
2 : 4
IssB
Sa
mp
led Current (
pA)
IssA
1.0 0.5 0.0 -0.5 -1.0
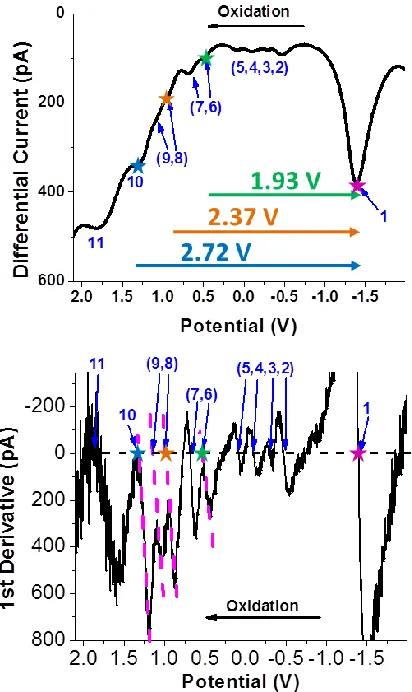
Figure 13. SWV oxidation scan of the Au130 MTCs from Figure 6 with 1st derivative plot shown
in bottom panel. Stars indicate peaks used for optical correlation.
[image:36.612.192.391.499.660.2]Table 1. Formal potential spacings for the AuMTCs, data calculated from Figure 13.
Peak # 11 10 9 8 7 6 5 4 3 2 1
Potential (V) 1.84 1.32 1.14 0.97 0.68 0.53 0.09 -0.10 -0.30 -0.47 -1.40
Peak spacing 11-10 10-9 9-8 8-7 7-6 6-5 5-4 4-3 3-2 2-1
Energy (V) 0.52 0.18 0.17 0.29 0.15 0.44 0.19 0.20 0.17 0.93
Recall from Chapter 1 that continuous quantized charging behaviors have been observed from
large AuMPCs such as Au144(SR)60,16,17 in contrast to smaller clusters such as Au25(SR)18 that
display electron transfer (ET) activities at discrete energy states.18 Au130 MTCs exhibit unique
electrochemical behaviors that set them apart from either category. The charging energy of
Au130MTCs is determined by the average peak spacing at 0.19 V. This value is slightly smaller
than that observed in PhC2S and hexanethiolate stabilized MPCs.15,16 Durene-DT has one instead
of two methylene groups between the Au core and benzene ring in contrast to PhC2S, therefore
slightly less monolayer thickness and larger dielectric constant, which leads to smaller charging
energy. Separated by a 0.44 V gap (peak # 6-5), another pair of ET peaks reveals one energy
state below the two degenerated states. The current ratio is found to be 2:4 from one scan of the
square wave data (comparable to CV current). Therefore, all six differential current peaks are
attributed to single electron transfer activities. The baseline distortion in sampling current
2.2.2 Correlation of Electrochemical and Optical Energetics
Figure 15. Energy diagram that correlates optical and electrochemical features. The SWV oxidation scan (left) and absorbance spectrum (right) are aligned based on the energy states shown in the middle. The undetermined degeneracy of those states are denoted x, y and z.
Each UV-Visible absorption peak is a result of photon-induced electronic transitions from
lower to higher energy states, and thus should also correlate to observed electrochemical band
gaps. Oxidation scan generally offers better resolved features compared to reduction scan,
presumably due to the impacts on Au-thiolate bonding by reduction. This is supported by the
cyclic voltammetry in Figure 11, in which the high potential peaks are found to be irreversible
and significantly distorted. Shown in Figure 15, excellent match is established between optical
bands and respective electrochemical gaps.
Starting from the molecular orbital diagram at the center, two degenerated HOMO orbitals
could hold 0-4 electrons (two shown), generating four continuous ET peaks separated by
charging energy. Interestingly, a single dominant ET peak at -1.4 V is observed upon reduction,
suggesting common LUMO states. With the distinct LUMO as reference point, electrochemical
[image:38.612.101.515.94.301.2]2.54 eV are matched with corresponding electrochemical peaks as indicated. Note the first of the
two ET peaks in each energy state (corresponding to 1.73 and 2.13 optical bands) is used in the
comparison. The second electron transfers per orbital are indicated by the arrow, requiring
additional charging energy compared to the initial ET. The average differences between
measured optical and electrochemical transitions (0.20 V) are approximately equivalent to the
measured charging energy (0.19 V). The high background signal at high potentials and potential
structure/composition changes of MTC at high charge states in electrochemistry prohibit the
precise correlation of the 3.50 eV optical band, as well as the degeneracy of those energy states
indicated by x, y and z.
The HOMO-LUMO band gap is extrapolated to be ca. 0.88 eV from the absorption spectrum,
but varies from sample to sample and is not as well-defined as the other bands. For an ideal
neutral MTC sample, the HOMO-LUMO gap is predicted to be 0.74 V from electrochemistry,
calculated from the gap between the LUMO peak and the last charging peak of the HOMO (0.93
V) with one charging energy value (0.19 V) subtracted. With several electrons filling the
degenerate HOMO states, the Fermi level will shift accordingly, which will cause the apparent
optical band gap to fluctuate. Indeed, the rest potential of the sample used here is ~0.2 V with
Ag/AgCl wire as quasi reference electrode. Precise control of the rest potential by bulk
electrolysis methods is currently underway.
2.2.3 Electrochemistry of Durene-DT Ligand
The free durene-DT alone displays electrochemical behavior at negative potential. This was
found to be a one-electron reduction by comparing the CV current response to that of an
equimolar solution of ferrocene (Figure 16). Since the electrochemical reduction of benzene to
was attributed to the formation of an intramolecular anionic cyclic disulfide radical. Radical
disulfide anions on six-membered rings have been detected previously for dithiothreitol by EPR
spectroscopy.121,122 Durene-DT is reduced at -1.81 V to durene-disulfide radical anion, which is
then oxidized in the reverse scan to durene-disulfide at -1.67 V (Figure 16).
Figure 16. (a) Cyclic voltammograms of (green)25 mM ferrocene, (red) 25 mM durene-DT, and (blue) reduction peak for AuMTCs (data scaled by factor of ten for clarity). All scans were performed with 0.1 M TBAP supporting electrolyte in DCM and 100 mV/s scan rate, Pt disk working electrode (7.4 μm). CV of AuMTCs was recorded at ca. -70°C in dry ice/acetone bath. (b) Structural representation of durene-DT reduction to durene-disulfide radical anion and oxidation to durene-disulfide.
The electrochemical response from the LUMO of AuMTCs, however, is not the same as that
of durene-DT alone, as the latter occurs at more negative potentials (higher energy). This
suggests that the electrons being transferred are much more stable in the form of durene-DT that
is attached to the AuMTC. It is therefore proposed that the electrons are being conducted through
the delocalized disulfide radicals to charge the Au core. The conduction of charge through the
ligands effectively increases the dielectric constant for the compact layer of the AuMTC,
resulting in the overall substantial increase of the quantum double layer capacitance and decrease
negligible (i.e. no longer discernable by voltammetry), as no peak separation is observed
between each ET at the LUMO potential (-1.4 V). Such behavior has never been observed
before, as previously reported AuMPC voltammograms all display relatively regular potential
difference spacings between ET peaks, regardless of corresponding energy level.40-47 However,
as mentioned earlier, the regular charging phenomena still exists for the electron transfers at the
HOMO and more positive potentials (Figures 12-14). At these potentials the AuMTCs behave
“normally,” i.e. the attached durene-DT ligands no longer serve as conductors, so the typical
capacitive effects of the compact layer are still present.
2.2.4 Metal to Ligand Charge Transfer Quantization
Since there are multiple durene-DT ligands attached on the monolayer of an AuMTC, the
amount of charge transferred to each conducting ligand cannot be determined by direct
comparison of steady state current from voltammetry, as was used for the peaks at positive
potential in Section 2.2.1 (Figure 12-B). However, if each attached durene-DT is treated as a
redox-active analyte, then the quantification of ET per attached durene-DT molecule can be
achieved by comparing the relative scan rate dependence in cyclic voltammetry, according to
Equation 2:123
ip = (2.69 x 10⁵)n3/2AD1/2Cv1/2 (2)
ip = peak current, n = # of electrons transferred, A = area of working electrode,
D = diffusion coefficient, C = concentration, v = scan rate
The radius of the disk electrode used in these measurements is 7.4 μm. For a nanoelectrode of
this particular size, which lies in the transition from microelectrode to ultramicroelectrode, the
kinetics of mass-transfer can be described by either radial diffusion or linear diffusion,
the square root of the scan rate for the single electron transfer at QDL peak 2 (Table 1). The
transition from diffusion-limited current response to steady-state response is clearly evidenced
by the change from a steep slope at high scan rates to an almost flattened slope at lower scan
rate.
Figure 17. Plot of peak currents measured from CV versus square root of the scan rate for QDL peak 2.
Based on this finding, the CV current responses at high scan rates were analyzed. As shown
in Figure 18, the scan rate dependence for both the Au QDL peak and the durene-DT peak were
determined from the linear fit of their respective ip vs. v1/2 plots. Since the values of A, D, and C
are all equivalent, the following relationship can be established based on Equation 2:
iQDL(nQDL)-3/2 v-1/2 = iDur(nDur)-3/2 v-1/2 (3)
Substituting the slope, k, for i / v1/2 gives:
kQDL(nQDL)-3/2 = kDur(nDur)-3/2 (4)
And since nQDL = 1 e-, the expression is even further simplified as:
kQDL(nQDL)-3/2 = kDur (5)
The slope values from Figure 18 were then used to solve for an nDur value of 4 e-. Assuming each
Au130(Durene-DT)29(PhC2S)22, a total of 116 electrons would be charged into the Au130 core at
the potential of -1.4 V. This is impossible because the steady state current ratio of issDur : issQDL
from SWV is 48:1, which cannot occur if all 29 durene-DT ligands are activated (Table 2).
Therefore the nDur value of 4 e- can only be correct if a fraction of the total durene-DT ligands are
participating in charge transfer. This is reasonable since the steady state current of the durene-DT
response varies from sample to sample. Following this logic, a total of 12 durene-DT ligands are
calculated as participants in 4e- charge transfer for this particular sample.
Table 2. Comparison of Steady State Current from SWVox in Figure 12.
Durene-DT Peak 4 QDL Peaks
Potential (V) -1.40 (0.09, -0.10, -0.30, -0.47)
iss (pA) 1288 108
issDur : issQDL(total) 12 : 1
issDur : issQDL(individual) 48 : 1
The nDur value may also be in error, since the H-NMR of the sample used in this analysis still
displays a significant degree of sharp durene-DT proton signals in relation to the broadened
peaks, suggesting free durene-DT is present in the sample or a small complex. In either case the
presence of another component that is also electroactive at -1.4 V significantly complicates the
analysis, such that the diffusion coefficients and concentrations can no longer be treated as
equivalent in Equation 2. Instead the current for attached durene-DT appears to be much larger
than it really is. In relation, the calculated nDur in this experiment might be much larger than the
real value. If the value of nDur is actually 1e-, agreeing with the results from Section 2.2.3, then a
total of 48 charge transfer active durene-DT ligands is suggested from Table 2. This value is
somewhat larger than the accepted composition of 29 durene-DT ligands, which can be
each charge transfer is 1e-, it is proposed that all of the attached durene-DT ligands are
[image:44.612.82.534.137.449.2]participating in charge transfer.
Figure 18. (a) CVs at various scan rates for LUMO peak with corresponding ip vs. v1/2 plot. (b)
CVs at various scan rates for QDL peak 2 of AuMTCs collect at RT with corresponding ip vs.
v1/2 plot. The linear fit and corresponding slope, m, is also shown. CVs were recorded using 7.4 μm Pt electrode in DCM with 0.1 M TBAP supporting electrolyte.
2.3 Conclusions
The electrochemical behavior of Au130(Durene-DT)29(PhC2S)22 has been characterized and
energetics correlated to the absorption spectrum. At negative charge states (negative applied
potential), the attached durene-DT ligand is transformed into a delocalized radical species which
serves to conduct electrons into the gold core. While the methods used to quantify charge
transfer of the attached durene-DT ligand are correct, the results are not reliable due to the
transfer occurs for free durene-DT at ca. -1.6, it is predicted that just one electron is transferred
per attached durene-DT on the MTC surface. To test this hypothesis correctly in the future, the
AuMTC sample must be pure. A more pure sample is also necessary to confirm the proposed
optical and electrochemical correlation. Experiments are currently underway to sufficiently
3. SILVER DITHIOLATE-STABILIZED NANOCLUSTERS
3.1 Introduction
One synthesis has been reported in literature for a monodispersed dithiolate-stabilized silver
nanocluster (AgDTC) using dimercaptosuccinic acid (DMSA) as the ligand. The resulting
species was given the composition Ag7(DMSA)4 using ESI-MS.98 Contradicting this assignment
is the absorption spectrum, which displays a well-defined peak at 500 nm, bearing a striking
resemblance to band 6 in the PAGE separation, therefore corresponding to a larger core size. It is
possible that the base peak observed in ESI-MS is actually a stable fragment ion of the larger
cluster. But as was mentioned in the introduction of Chapter 1, the properties of AgDTCs cannot
be predicted based on trends set by AgMPCs. The stability of this AgDTC is an issue which has
hindered attempts at characterization, a problem shared by the newly reported AgDTC discussed
below, which features lipoic acid (LA), a 1,3-substituted disulfide.
3.2 Synthesis
AgDTCs were synthesized by a one-phase method in aqueous solvent under basic conditions
(Figure 19). Briefly, lipoic acid in 25 mM NaOH solution was used to dissolve silver nitrate by
sonication, forming a pale yellow solution. Next, a solution of sodium borohydride in 25 mM
NaOH was added. The color of the reaction mixture gradually changed from yellow to dark red.
After reduction the reaction mixture was stirred for twelve hours to allow the clusters to evolve
Figure 19. Synthetic scheme for LA-AgDTCs. Cartoon of cluster is not drawn to scale or indicative of composition.
3.3 Results and Discussion
The rich defined features in the absorbance spectrum of the AgDTCs indicate that the most
thermodynamically favored species was synthesized (Figure 20). Four absorbance peaks are
clearly visible at 4.77 eV, 3.73 eV, 2.90 eV, and 2.47 eV. The HOMO-LUMO band gap is
estimated from the band edge at ca. 2.0 eV. This band edge is very close in value to that reported
by Kumar, et al. for a species proposed to have a core composition of Ag15.97 If the pH is brought
below pH 8 the clusters appear to become more polydispersed with larger clusters formed
(Figure 21). This effect is analogous to that observed for the AgMPCs stabilized by
glutathione/captopril, as described in Section 1.3.1.91,92 The clusters also exhibit strong red
fluorescence emission with only one maximum centered at ca. 645 nm, another property shared
Figure 20. Optical absorption spectrum for as-synthesized AgDTCs. Inner panel shows
[image:48.612.127.480.89.352.2]absorption plotted on energy axis and labeled peak energies. Green label points to the absorption band edge.
Figure 21. (left panel) UV/Vis absorption spectrum of 2X-LA-Ag synthesis, pH effect, and purification. (right panel) Fluorescence spectra of LA-AgDTCs in NaOH solution, 3 nm slitwidth with photograph of LA-AgDTCs under UV lamp radiation.
200 400 600 800
0.0 0.2 0.4 0.6 0.8 1.0
Abso
rbance
Wavelength (nm)
As-synthesized AgDTCs pH 8
[image:48.612.75.537.420.601.2]The unpurified AgDTC sample can maintain its optical features for several weeks in alkali
solution under ambient conditions. Since the carboxylate groups on the tails of the attached
ligands are negatively charged at pH > 8, the clusters can be transferred to the organic phase via
TOA cation. The efficiency of this transfer is poor, since there is a great excess of competing
Na+in the system. The absorption spectrum of the AgDTCs in organic solvent is virtually
[image:49.612.157.440.253.493.2]identical to that observed in water (Figure 22).
Figure 22. Optical absorption spectrum for AgDTCs in dichloromethane after phase transfer with tetraoctylammonium bromide.
1.0 1.5 2.0 2.5 3.0 3.5 4.0 4.5 5.0
0.0
0.5
1.0
1.5
2.0
2.5
E (eV)
Abs
orbanc
e
3.72
2.47
Figure 23. H-NMR Spectrum for LA AgDTCs in D2O solvent. Structure of dihydrolipoic acid
shown in top left corner.
The altered product after dialysis purification can still be dissolved in water, and was
analyzed by NMR spectroscopy (Figure 23). The H-NMR spectrum of the lipoic acid silver
clusters shows signal broadening effects, indicating ligand attachment to a silver nanocluster.
Broadening is much more obvious for the proton signals downfield, which pertain to the protons
closest to the thiolate and silver core. Sharper signals are observed for the protons neighboring
the carboxyl group on the ligand tail, located furthest away from the point of attachment to the
metal core. It is suggested by the H-NMR evidence that AgDTCs still survive the purification,
yet aggregate and form larger particles, creating a polydispersed size distribution, as suggested
3.4 Conclusions
Nanocluster synthesis under basic conditions with LA ligand results in a monodispersed, yet
pH sensitive AgDTC sample. The cluster exhibits intense fluorescence and well-defined
absorbance features. The negatively charged AgDTCs can be transferred to the organic phase by
quaternary ammonium salt. An anhydrous synthesis in organic phase is therefore feasible using
quaternary ammonium cation instead of sodium cation as the charge stabilizer, resulting in DTCs
that are more stable. Investigations into the anhydrous synthesis of LA-AgDTCs in organic
solvent are currently underway. If the aqueous AgDTCs are to be successfully purified, the pH
must be controlled at pH > 10 by using a buffer compatible with ESI-MS, such as Tris. The
dialysis tube and chamber can both be comprised of the buffer, maintaining a constant pH during
purification. All characterization must include the buffer to keep the clusters stable. Regardless
of the means used to synthesize and purify these AgDTCs, a mass spectrum is necessary for
compositional characterization. ESI-MS experiments are currently in progress. Also necessary
are IR spectroscopy and/or H-NMR in organic solvent to determine whether or not there are any
thiol groups still present in the sample. Quantum efficiency should also be calculated for the
4. COPPER DITHIOLATE-STABILIZED CLUSTERS
4.1 Introduction
While much research has been focused on the synthesis, characterization, and applications of
noble metal nanoclusters (primarily gold), little improvement has been achieved with low cost
metals such as copper. Advancing research into the realm of copper may lead to the discovery of
exciting new cost-effective catalysts for energy conversion technologies such as fuel cells and
photovoltaics or green chemistry applications such as organic synthesis and catalytic conversion
of carbon monoxide.113,114
The major reason why research is lacking for monolayer-protected copper nanoparticles is the
high reactivity of copper with oxygen, forming oxides which contaminate the sample and
compromise stability.124 Dithiol ligands are expected to enhance the overall stability of the
cluster by entropy gain and prevent oxidation and decomposition of the copper nanoparticles.
Furthermore, the high stability of the dithiolate-Cu bond structure is proposed to aid in the
synthesis of monodispersed relatively small copper dithiolate-protected nanoclusters (CuDTCs),
by stabilizing the most thermodynamically and kinetically favored cluster size. Described herein
is the synthesis of hydrophilic and hydrophobic CuDTCs and their characterization by
electrochemical methods, UV-visible absorption spectroscopy, IR, and 1H-NMR spectroscopy.
4.2 Hydrophobic CuDTCs Stabilized by Durenedithiolate
The ligand chosen for this synthesis is durene-DT, as shown in Figure 24. The linker length
between the two thiolates is a four carbon chain, with the two middle carbons belonging to a
benzene ring. This semi-rigid structure is proposed to provide excellent stability to the
energetics between these CuDTCs and the AuMTCs discussed earlier, particularly the
electrochemical behavior resulted from the attached durene-DT ligand.
4.2.1 Synthesis
The synthesis of CuDTCs using durene-DT ligand is described in Figure 24 shown below.
The synthetic procedure has evolved substantially from first attempts at this system which
included the standard Brust procedure29 commonly used to synthesize gold nanoclusters and
possible one-phase methods, both of which resulted in very low yields and oxidized side
products.
Figure 24. Two-phase synthesis of CuDTCs with durene-DT ligands. Cartoon of cluster is not drawn to scale or indicative of composition.
An important technical detail is the phase-transfer of copper to the organic phase from the
aqueous cationic salt (CuCl2). Phase transfer to chloroform organic solvent was achieved by first
chemically reducing the copper(II) chloride to colorless copper(I) chloride by the addition of 2
molar equivalents of ascorbic acid in a saturated solution of sodium chloride. The excess
chloride anion from saturated NaCl generates the formation of anionic copper(I) chloride
[image:53.612.143.478.295.481.2]electrostatic interaction with the TOA cation from TOABr. Copper(II) chloride without reduction
by ascorbic acid cannot transfer to the organic phase under similar saturated NaCl conditions, as
shown by the overlap of the absorption spectra in the visible range (Figure 25-A). However, if
the Cu2+ salt is first reduced to Cu1+ before phase mixing, then the efficiency of phase transfer is
>95% on average, as shown by the difference between copper(II) absorption before and after
phase transfer (Figure 25-B).
[image:54.612.84.516.255.426.2].
Figure 25. (a) Absorption spectra of the aqueous phase during phase transfer of copper cation to the organic phase (CHCl3); copper(II) chloride before phase transfer (red) and copper(II)
chloride after phase transfer (blue). (b) Absorption spectra of the aqueous phase during phase transfer of copper cation to organic phase (CHCl3) using ascorbic acid reduction procedure;
copper(II) chloride before phase transfer (red), copper(I) chloride formed by ascorbic acid reduction before phase transfer (purple), copper(II) chloride formed by H2O2 oxidation of
copper(I) chloride after phase transfer (blue), and an equimolar solution of copper(II) chloride reduced by ascorbic acid, then oxidized back to copper(II) chloride by H2O2 without organic
phase mixing (green).
Copper(I) cannot be detected by UV/Vis spectroscopy, as it is colorless and does not absorb
in the limits of detection (purple line). Therefore to confirm that no copper is left in the aqueous
phase after the procedure, copper(II) is regenerated after reduction to copper(I) by oxidation with
4 molar equivalents of H2O2. If an equimolar solution undergoes similar reduction-oxidation


![Figure 4. Crystal structure of Au25(SR)18 [image taken without permission from ref. 41]](https://thumb-us.123doks.com/thumbv2/123dok_us/9141006.989200/22.612.129.464.123.341/figure-crystal-structure-au-sr-image-taken-permission.webp)