Full Length Research Article
HISTOGRAM FEATURES OF OSMF IMAGES FOR CLASSIFICATION BY AANN
*
Venkatakrishnan, S.
Assistant Professor, Mechanical Engineering, Engg-Wing DDE, Annamalai University
ARTICLE INFO ABSTRACT
Oral Submucous Fibrosis (OSMF) is an insidious chronic progressive precancerous condition of the oral cavity and oropharynx with a high degree of malignant potential. It is a precancerous condition associated with the use of areca nut in various forms. there is a progressive inability to open the mouth and tongue movement gets restricted to varying degrees depending up on the severity of the disease process thus it becomes essential to intervene the disease at an early stage to avoid progression to cancer. histopathological investigations are the gold standards for diagnosis , but subjective variations are always problematic. Computer aided classification with image analysis techniques are on the research line already with some positive outcomes this research has attempted to classify osmf microscopic images with aann classiffer by using histogram features
Copyright© 2017,Venkatakrishnan. Thisis an open access article distributed under the Creative Commons Attribution License, which permits unrestricted use, distribution, and reproduction in any medium, provided the original work is properly cited.
INTRODUCTION
Early detection of premalignant and cancerous mucosal lesions improves the survival and morbidity of patient’s sufferings (Shilpa et al., 2012). Currently one of the greatest challenges to oral oncobiologists is to determine and identify the degree of tissue damage or stages of various precancerous states of oral tissue and to detect the exact transition of a normal tissue to precancerous state (Sanjit Mukherjee et al., 2010). Traditionally, the pathologists use histopathological images of biopsy tissue and examined them under light microscope to detect OSMF which is a highly qualitative process (Joel B. Epstein et al., 2008). Oral Submucous Fibrosis (OSMF) is a precancerous condition associated with the use of areca nut in various forms. Worldwide, estimates of OSMF shows a confinement to Indians and Southeast Asians, with overall prevalence rate in India to be about 0.2% to 0.5%. Ingestion of chillies, genetic susceptibility, nutritional deficiencies, altered salivary constituents and autoimmunity and collagen disorders may be involved in the pathogenesis (Rajendran, 2009). The condition is well recognized for its malignant potential rate of 7.6% and is particularly associated with use of areca nut in various forms with significant duration and frequency of chewing habits.
*Corresponding author: Venkatakrishnan, S.,
Assistant Professor, Mechanical Engineering, Engg-Wing DDE, Annamalai University.
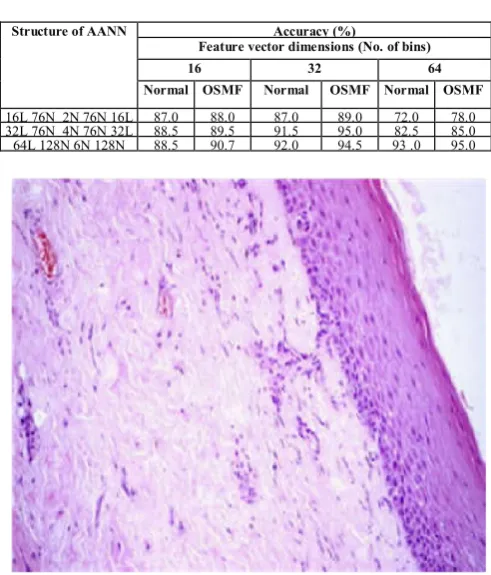
In OSMF, there is a progressive inability to open the mouth and tongue movement gets restricted to varying degrees depending up on the severity of the disease process (Mitesh Amitkumar Modi et al., 2005). Fig. 4.2 shows the microscopic image of OSMF. Atrophic epithelium with loss of retepegs and dense fibrous connective tissue are seen. Presently, no specific diagnostic test is available for OSMF except for histopathological studies. The main histopathological characteristic of OSMF is the deposition of collagen in the subepithelial connective tissue leading to epithelial atrophy. It has been found that exposure of buccal mucosal fibroblasts to alkaloid may result in the accumulation of collagen. Collagenase activity has been found to be lower in OSMF than in normal oral mucosa. These findings suggest that OSMF should be considered as a collagen metabolic disorder resulting from alkaloid exposure and individual variations in collagen metabolism. Outcomes of OSMF are characterized by two features: the persistence of the disease and its potential to become malignant. OSMF is strongly associated with a risk of oral cancer (Sanjit Mukherjee et al., 2010). OSMF has been graded by many pathologists based on clinical features or histopathology or both. It has been graded into Grades I, II and III based on the microscopic features. Initially, OSMF lesions are characterized by a few epithelial and inflammatory changes in the connective tissue and subsequently as the disease progresses, fibrosis and later hyalinization with less vascularity occur.
ISSN: 2230-9926
International Journal of Development Research
Vol. 07, Issue, 05, pp.12679-12683, May,2017
DEVELOPMENT RESEARCH
Article History:
Received 07th February, 2017 Received in revised form 21st March, 2017 Accepted 27th April, 2017 Published online 31st May, 2017
Key Words:
OSMF, AANN,
Fig. 4.1. Intraoral photograph of the buccal m blanched oral mucosa with erosions in the ini
[image:2.595.47.278.265.438.2]submucous fibrosis
Fig. 4.2. Microscopic image of OSMF showi epithelium and fibrous connective tissue; E-E Connective Tissue; K-Keratin
Fig. 4.3. (a) Normal Microscopic Image (b) Histogram of Normal Microscopic Image given in (a)
mucosa showing itial stages of oral
owing an atrophic Epithelium; CT-in
(a) Normal Microscopic Image (b) Histogram of Normal Microscopic Image given in (a)
The simple pathological evalu does not provide a quantitative the tissues; that is, epithelial d fibrosis (Fernando Augusto et al
based diagnostic approach w diagnosis as well as may assist
et al., 2012).
Related Work
Application of Image Analysis methods in OSMF, other precancerous conditions and oral cancer for diagnosis, staging and classification aspects is being expertise in the recent years. In June 2013, Anuradha K and Sankaranarayanan K described feature extraction techniques to classify oral cancers using Image Processing (Joel B. Epstein
system is developed to segment, extract features and classify cancers. Later, a comparison is made. The proposed system consists of five steps. First, the images are enhanced and the Region of Interest (ROI) is segmented using Marker Controlled Watershed Segmentation.
Feature Extraction methods like Gray Level Co
Matrix (GLCM), Intensity Histogram and Gray Level Run Length Matrix (GLRLM) are used to extract features from ROI. Next, classification is made using Support Vector Machine (SVM) classifier to classify
malignant mass and a comparative study is performed to identify the best feature extraction technique.
Mitesh Amitkumar Modi, Vishal R. Dave, Viral G. Prajapati and Keyur A.Mehta described “A A Clinical P
Submucous Fibrosis” (Sanjit Mukherjee
hospital-based study was conducted on 80 oral Submucous Fibrosis cases who visited our hospital in Jamnagar. A detailed history of each patient was recorded along with a clinical examination. Biopsy was performed for histopathological correlation. Clinical stage of the disease in terms of the ability to open one's mouth was correlated with histopathological grading.
Features for osmf classification
Color histogram features: Th
with gray levels in the range where L is the number of discre
P(rk)= nk ,0<k<L-1 (4.1)
where rk is the kth gray level the image with that gray lev pixels in the image with k = P(rk) gives an estimate of the p level rk. The technique used fo is known as histogram equaliza
The steps to perform histogram
Find the probability o (rk) in the input image
Use the transformation
histogram equalized image. Histogram
significantly improves the visual appearance of the image.
uation procedure currently used e analysis of the vital changes in dysplastic changes, subepithelial
et al., 2009). Thus a computer will enhance the accuracy of t in grading OSMF (Rusha Patra
Application of Image Analysis methods in OSMF, other precancerous conditions and oral cancer for diagnosis, staging and classification aspects is being expertise in the recent years. In June 2013, Anuradha K and Sankaranarayanan K described feature extraction techniques to classify oral cancers using Joel B. Epstein et al., 2008). In this work, a m is developed to segment, extract features and classify cancers. Later, a comparison is made. The proposed system consists of five steps. First, the images are enhanced and the Region of Interest (ROI) is segmented using Marker
tation.
Feature Extraction methods like Gray Level Co-occurrence Matrix (GLCM), Intensity Histogram and Gray Level Run Length Matrix (GLRLM) are used to extract features from ROI. Next, classification is made using Support Vector to classify the tumor as benign or malignant mass and a comparative study is performed to identify the best feature extraction technique. In August 2012, Mitesh Amitkumar Modi, Vishal R. Dave, Viral G. Prajapati and Keyur A.Mehta described “A A Clinical Profile of Oral Sanjit Mukherjee et al., 2010). A based study was conducted on 80 oral Submucous Fibrosis cases who visited our hospital in Jamnagar. A detailed history of each patient was recorded along with a clinical examination. Biopsy was performed for histopathological correlation. Clinical stage of the disease in terms of the ability to open one's mouth was correlated with histopathological
on
he histogram of a digital image (0, L−1) is a discrete function, ete gray level
l, nk is the number of pixels in vel, n is the total number of = 0, 1, 2, .., L − 1. In short, probability of occurrence of gray or obtaining a uniform histogram ation or histogram linearization.
m equalization are
of occurrence of each gray level e
function sk = T(rk) to obtain the
[image:2.595.43.284.489.635.2]The feature is defined as a function of one or more measurements, each of which specifies some quantifiable property of an object, and is computed that it is quantifying some of the important characteristics of the object (Duda, 2000). Feature selection helps to reduce the feature space which improves the prediction accuracy and minimizes the computation time. Quantitative evaluation of histopathological features is not only vital for precise characterization of any precancerous condition but also crucial in developing automated computer aided diagnostic system (Muthu Rama Krishnan, 2009). Sub- epithelial hyalinization and fibrosis are characteristic histological features of OSMF. In this research work, color histogram features were extracted from both normal and OSMF microscopic images. Histogram construction has already been explained in detail in a previous work published by the same author, on OSMF
(Venkatakrishnan, ?).
Four fold cross validation: In this research work fou fold
cross validation is carried out. In four fold cross validation the dataset with 200 images consists of 100 normal microscopic images and 100 affected microscopic images is divided into four equal size sub samples. Out of the four sub samples, a single sub sample is retained as the validation data for testing the model and the remaining samples were used as the training data. Cross validation process was repeated four times and performance of the system was analyzed. In four fold cross validation, the training set is randomly divided into 4 disjoint sets namely fold1 (f1), fold2 (f2), fold3 (f3), fold4 (f4), where each fold having same number of data values. These folds are formed with the following grouped folders namely gfi (i=1, 2, 3, 4) = f j (training data) in which fi is
[image:3.595.314.553.53.212.2]tested against training data. Table 4.1 shows the four fold cross validation of data organized for training and testing for classification.
Table 4.1. Four fold cross validation
1 2 3
Grouped Folder No. Training Data Test Data
gf1 f2+f3+f4 f1
gf2 f1+f3+f4 f2
gf3 f1+f2+f4 f3
gf4 f1+f2+f3 f4
Further a total of 200 images with 100 normal microscopic images and 100 OSMF affected microscopic images are collected and used for training and testing. The 200 microscopic images are (i= 1, 2, 3, 4) divided into four folds, namely fi. Each fold (fi) contains 50 microscopic images.
Experimental results
A total of 200 microscopic images which consists of 100 OSMF images and 100 normal images are considered. For four fold cross validation training data gfi (i=1,2,3,4) consisting of 150 microscopic images (50 images (25 Normal + 25OSMF) + 50 images ( 25 Normal + 25 OSMF) + 50 images (25 Normal + 25OSMF) ) are used. For testing, 50 microscopic images (25 normal and 25 OSMF)are used.
Evaluation using AANN
[image:3.595.310.556.265.553.2]AANN models perform an identical mapping of the input space (Abdul Jaleel, 2012).
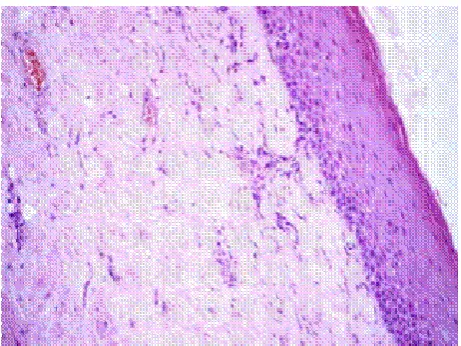
Table 4.4: Average performance of normal and OSMF classification by
AANN model using Histogram features
Structure of AANN Accuracy (%)
Feature vector dimensions (No. of bins)
16 32 64
Normal OSMF Normal OSMF Normal OSMF
16L 76N 2N 76N 16L 87.0 88.0 87.0 89.0 72.0 78.0
32L 76N 4N 76N 32L 88.5 89.5 91.5 95.0 82.5 85.0
64L 128N 6N 128N 88.5 90.7 92.0 94.5 93 .0 95.0
The distribution of 16, 32 and 64 dimensional feature vectors in the feature space for different bins is captured using an AANN model. Separate AANN models are used to capture the distribution of feature vectors of each class and the network is trained for 500 epochs(10). One epoch of training is a single presentation of all the training vectors to the network. For evaluating the performance of the system, the feature vector is given as input to each of the models. The output of the model is compared with the input to compute the normalized squared error. The normalized squared error (E) for the feature vector y is given by E where
|| y o ||2
|| y ||2
, where
The class is decided based on the highest confidence score. The classification results for the different bins are shown in Fig. 4.7. The performance of the system is evaluated, and the method achieves 95.0% for classification rate for 64 bins. The structure of AANN model plays an important role in capturing the distribution of the feature vectors. After some trial and error, the network structure 64L - 128N - 8N -128N - 64L is obtained. This structure seems to give good performance in terms of classification accuracy. The number of units in the third layer (compression layer) determines the number of components captured by the network. The AANN model projects the input vectors onto the subspace spanned by the number of units (nc) in the compression layer. If there are nc units in the compression layer, then the histogram feature vectors are projected onto the subspace spanned by nc components to realize them at the output layer.
The effect of changing the value of nc on the performance of OSMF classification is studied. There is no major change in the performance if nc is between 4 and 6 and the performance of the system decreases if it is less than 2 or more than 6. The decrease in the performance for nc< 2 indicates that there may not be a boundary between the components representing the microscopic image information.
The decrease in the performance for nc> 6 indicates that the training data may not be sufficient for capturing the distribution of feature vectors. The results are shown in Table 4.4 and maximum performance is obtained with the structure 64L - 128N - 8N - 128N - 64L as shown in Fig. 4.7. Similarly, the performance is obtained by varying the number of units in the expansion layer keeping the number of units in the compression layer to 4. When the number of units in the expansion layer is increased from 128 to 146, there is no considerable increase in the performance.
DISCUSSION
OSMF being a PMD(potentially malignant disorder) with a high risk of cancer formation needs appropriate diagnosis at the early stage this research work has proposed an AANN pattern classiffier with extracted histogram features with a considerable outcome already many research workers have experimented other classifiers in OSMF and the results had also been satisfied .In this work a maximum accuracy of 95% was achieved for the structure 64L-128N-8N-128N-64L.
Conclusion
This technique proves to be a reliable method to classify OSMF images in future more research works with other features could be attempted for better results.
REFERENCES
Abdul Jaleel, SibiSalim J and Aswin R.B. 2012. “Artificial Neural Network Based Detection of Skin Cancer”, International Journal of Advanced Research in Electrical, Electronics and Instrumentation Engineering, vol.1, no. 3, pp. 200-205, September.
Anuradha, K. and Sankaranarayanan, K. 2013.
“Comparison of Feature Extraction Techniques to
classify Oral Cancers using Image Processing”, International Journal of Application or Innovation in Engineering and Management (IJAIEM), vol. 2, no. 6, pp. 456-462, June.
Duda R, Hart P and Stork D. 2000. “Pattern Classification”, Second Edition, John Wiley and Sons, Inc.
Duda R, Hart P and Stork D. 2000. “Pattern Classification”, Second Edition, John Wiley and Sons, Inc.
Fernando Augusto C, Garcia de Sousa, Paradella and Thas Cachut, 2009. “Malignant potential of oral lichen planus: A meta-analysis”, Revista Odonto Ciência (Journal of Dental Science), vol. 24, no. 2, pp. 194-197, February.
Joel B. Epstein, Meiv Gorsky, Robert J. Cabay, Terry Day and Wanda Gonsalves, 2008. “Screening for and diagnosis of oral premalignant lesions and oropharyngeal squamous cell carcinoma”, Canadian Family Physician, vol.54, p. 827, June.
Mitesh Amitkumar Modi, Vishal R. Dave, Viral G. Prajapati and Keyur A. Mehta. 2005. “A Clinical Profile of Oral Submucous Fibrosis”, National Journal of Integrated Research in Medicine, vol. 3, no. 3, pp. 152-155, July-August 2012 Journal of Clinical Pathology, vol. 58, pp. 932-938, September.
Mitesh Amitkumar Modi, Vishal R. Dave, Viral G. Prajapati and Keyur A. Mehta, 2012. “A Clinical Profile of Oral Submucous Fibrosis”, National Journal of Integrated Research in Medicine, vol. 3, no. 3, pp. 152-155, July-August.
Muthu Rama Krishnan M, Mousumi Pal, Suneel K. Bomminayuni, Chandan Chakraborty, Rajan Rashmi Paul, Jyotirmoy Chatterjee and Ajoy K. Ray, 2009. “Automated classification of cells in sub-epithelial connective tissue of oral sub-mucous fibrosis - An SVM based approach”, Computers in Biology and Medicine, vol.39, no. 12, pp. 1096-1104, December.
Rajendran R. and Sivapathasundaram B. 2009. “Shafer’s Textbook of Oral Pathology”, 6th Edition, Elsevier India.
Rusha Patra, Chandan Chakraborty and Jyotirmoy Chatterjee, 2012. “Textural Analysis of Spinous Layer for Grading Oral Submucous Fibrosis”, International Journal of Computer Applications, vol. 47, pp. 0975-0987, June.
Sanjit Mukherjee, Jay Gopal Ray and Keya Chaudhuri, 2010. “Microscopic analysis of histological and immunohistochemical sections to differentiate normal, precancer and cancerous oral squamous epithelial
Tissues”, Microscopy: Science, Technology,
Applications and Education, pp. 993-1000.
Shilpa B. Rajesh and Satheesha B. H. Reddy, 2000-2005. “Cytomorphometric Analysis of Obtained Squames Obtained from Normal Oral Mucosa and Lesions ofOral Submucous Fibrosis”, Journal of Indian Academy of
Oral Medicine and Radiology, vol. 24, no. 3, pp.
July-September 2012.
Venkatakrishnan S, Ramalingam V, Palanivel S. ”Classification of Oral Submucous Fibrrosis Using Svm”, International Journal Of Computer Application, Vol 78-No.3, Pp.0975-8887.
Yegna Narayana, B. 1999. “Artificial neural networks”, prentice hall of india, new delhi 1999.