Journal of Chemical and Pharmaceutical Research
__________________________________________________
ISSN No: 0975-7384 CODEN(USA): JCPRC5
J. Chem. Pharm. Res., 2011, 3(6):450-457
Optimization of Reactive Black 5 dye and Reactive Red 120 dye degradation
Usha M. S.*, Sasirekha B., Bela R. B., Devi S., Kamalini C., Manasa G. A. and Neha P. M.
Department of Microbiology, Centre for P.G. Studies, Jayanager, Jain University, Bangalore
______________________________________________________________________________
ABSTRACT
The present study was undertaken to study the statistical optimization of medium components for improved Reactive Red 120 dye and Reactive Black 5 dye degradation by P. aeruginosa and A. punctata. Yeast extract, aeration and temperature were identified as significant components influencing Reactive Red 120 dye degradation whereas dye and pH were highly significant on Reactive Black 5 dye degradation. The main factors that had significant positive effects on both the dye degradation were glucose, yeast extract, aeration, inoculum, dye concentration, pH. This statistical optimization approach has led to 100% and 95% degradation of Reactive Red 120 dye and Reactive Black 5 dye respectively within 24 hours of incubation. Statistical approach was found to be very effective in optimizing the medium components in manageable number of experimental runs.
Key words: Reactive Red 120 dye, Reactive Black 5 dye, degradation, optimization, Plackett-
Burman Design.
______________________________________________________________________________
INTRODUCTION
Synthetic dyes are extensively used in textile, paper and printing industries as well as in dye houses [1]. The coloring process discharge huge quantities of dye effluents, which pollute local terrestrial habitat, aquatic bodies as well as rivers. Synthetic dyes are not easily amenable for microbial attack as they contain substitution such as azo, nitro and sulpho groups [2, 3].
There are reports on degradation of Reactive Black 5 dye and Reactive Red 120 dye [6-10]. However reports on effect of various parameters on degradation of Reactive Black 5 dye and Reactive Red 120 dye are limited. Hence the present investigation has been selected to study optimization of Reactive Black 5 dye and Reactive Red 120 dye degradation.
EXPERIMENTAL SECTION
Dyes and other chemicals: Reactive Black 5 dye, Reactive Red 120 dye and other chemicals
were procured from Hi-media Pvt. Ltd., Mumbai, India.
Culture: Aeromonas punctata and Pseudomonas aeruginosa isolated from textile industrial
effluent, identified by nucleotide sequencing and deposited in gene bank with the accession numbers JN561149 and JN561148 respectively were used for degradation studies.
Degradation studies: One ml of cultures were inoculated into separate flasks containing 100 ml
of mineral salts medium with pH 7 and the flasks were incubated at 37°C in static condition [11]. Degradations of dyes were analysed using UV-Vis spectrophotometer reading of samples at 597 nm for Reactive Black 5 dye and 520 nm for Reactive Red 120 dye.
Optimization of media components by Placket-Burman design: Plackett-Burman design, an
efficient way to identify the important factors among a large number of variables was used in the present study to screen the important variables that significantly influenced reactive dye degradation [12]. A total of nine variables (table1) were selected for the study with each variable being represented at two levels, high (+) and low (-) and two dummy variables in 12 trials. The number of positive and negative signs per trial was (k +1)/2 and (k – 2)/2, respectively. Each row represents a trial and each column represents an independent (assigned) variable. The main effect of each variable was determined by the following equation:
E (Xi) = 2 ( ∑ Mi+ − Mi− ) / N (1)
Where, E (Xi) is the concentration effect of the tested variables. Mi+ and Mi− represent dye
degradation from the trials, where the independent variable (Xi) measured was present at high
and low concentrations respectively. N, total number of the trials equals to 12. Experimental error was estimated by calculating the variance among the dummy variables as follows:
Veff = Σ (Ed)2 / n (2)
Where, Veff is the variance of concentration effect, Ed is the concentration effect for dummy
variable and n is the total number of dummy variables. The standard error (SE) of concentration effect was the square root of variance of an effect, and the significance level (P-value) of each concentration effect was determined using the student’s t-test:
t (Xi) = E (Xi) / SE (3)
Table 1. Variables representing medium components used in placket- Burman design
Variables Medium components - level +level
X1 Glucose (g/ml) 0.001 0.01
X2 Maltose (g/ml) 0.001 0.01 X3 Yeast extract (g/ ml) 0.001 0.01
X4 Ammonium nitrate (g/ ml) 0.01 0.1
X5 Aeration (rpm) 0 120
X6 Inoculum (%) 1 5
X7 Dye concentration (mg/ ml) .5 5
X8 Temperature (°C) 25 42
X9 pH 7 11
X1- X7 represent different assigned variables; the sign ‘+’ is for high concentration of variables and ‘-’ is for low
concentration of variables.
LC-MS analysis: LC-MS was carried out using LCMS-2010SA, Shimadzu, Japan. The column
used for LC-MS analysis was C18 (4.6 × 250 mm). Mobile phase was methanol:water (50:50 v/v). The flow rate was 0.6 ml/min and UV detector at 254 nm was used. The injection volume of the dye and its degraded product was 10 µl. Mass spectra was obtained using an ion – trap mass spectrometer fitted with an electron spray (ESI,Thermo Finnigan LCQ-DUO, USA) interface operated in negative ionization mode with a spray voltage of 4.5 kV, at a capillary temperature of 275⁰C, sheath gas at 40 AU (arbitrary unit) and auxillary gas at 26 AU.
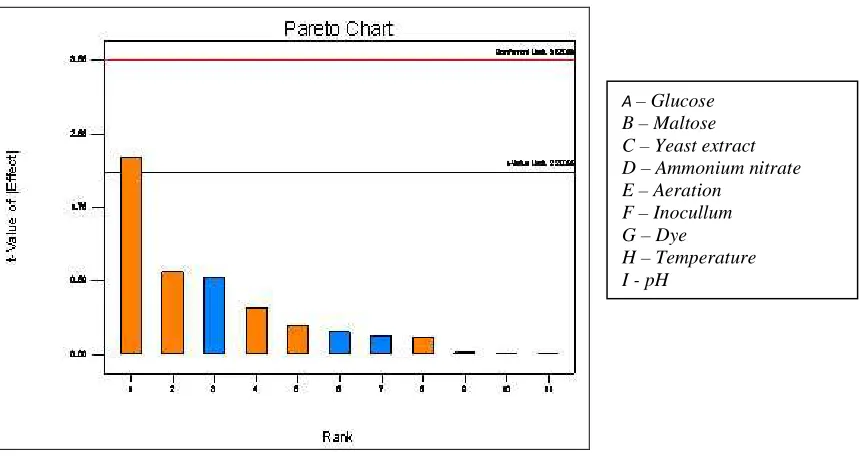
Figure 1: Pareto chart of nine -factor standard effects on Reactive Black 5 dye degradation.
A – Glucose
B – Maltose C – Yeast extract D – Ammonium nitrate E – Aeration
F – Inocullum G – Dye
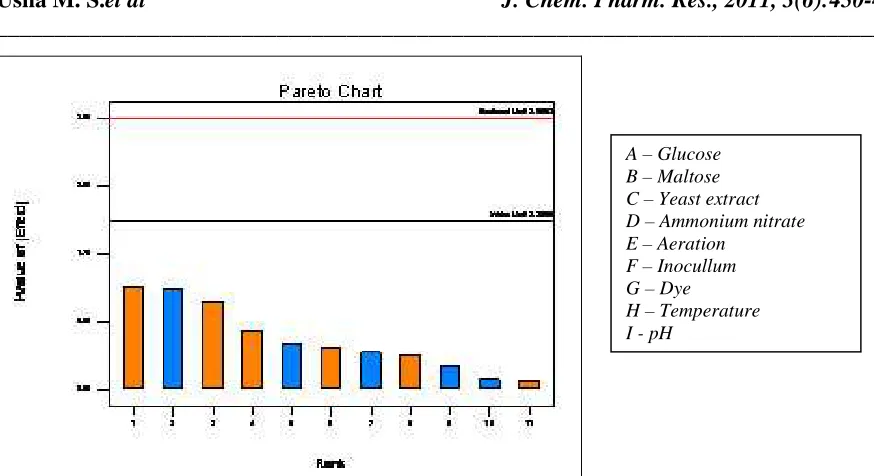
Figure 2: Pareto chart of nine -factor standard effects on Reactive Red 120 dye degradation.
RESULTS AND DISCUSSION
Optimization of media components by Placket-Burman design:
[image:4.595.72.509.78.316.2]Statistical methods for medium optimization have proved to be a powerful and useful tool. Screening of important media components by placket Burmann design showed a wide variation. This variation reflected the importance of medium optimization to attain higher yields. Within the range of the tested levels of variables, glucose, maltose, yeast extract, aeration, inoculum, dye concentration, pH had positive effects whereas, high levels of the other variables showed negative effects for reactive red dye degradation. In case of reactive black degradation glucose, yeast extract, ammonium nitrate, aeration, inoculum, dye concentration, pH had positive effects whereas, maltose and temperature showed negative effect. Fig. 1 & 2 (Pareto chart) shows, the positive and negative influence of the screened variables on both the dye degradation.
Table 2: Degree of positive or negative effect independent variables on reactive red degradation by P. aeruginosa
variables Medium components Effect SE t (Xi) Significance Level X1 Glucose (g/ml) 0.04 0.051 0.78 N.S X2 Maltose (g/ml) 0.09 0.051 1.76 N.S X3 Yeast extract (g/ ml) 0.27 0.051 5.29 S X4 Ammonium nitrate (g/ ml) -0.03 0.051 -0.58 N.S X5 Aeration (rpm) 0.43 0.051 8.43 S X6 Inoculum (%) 0.09 0.051 1.76 N.S X7 Dye concentration (mg/ ml) 0.01 0.051 0.19 N.S X8 Temperature (°C) -0.26 0.051 -5.09 S
X9 pH 0.22 0.051 4.31 N.S
Bold type indicates positive effect, italic type indicates negative effect S-Significant; N.S- Non-Significant
A – Glucose B – Maltose C – Yeast extract D – Ammonium nitrate E – Aeration
F – Inocullum G – Dye
Statistical analyses of the data (t-test) showed that variations of yeast extract, aeration and temperature in the tested range of variables had the most considerable effects on reactive red whereas dye concentration and pH were highly significant on reactive black dye degradation. The main effect of each variable upon reactive red and reactive black dye degradation has been given in table 2 and 3. The percentage contribution of each factor is shown in Fig. 3.
Table 3: Degree of positive or negative effect independent variables on reactive black degradation by Aeromonas punctata
variables Medium components Effect SE t (Xi) Significance Level
X1 Glucose (g/ml) 0 0.068 0 N.S
X2 Maltose (g/ml) -0.06 0.068 -0.88 N.S X3 Yeast extract (g/ ml) 0.073 0.068 1.07 N.S X4 Ammonium nitrate (g/ ml) 0.16 0.068 2.35 N.S X5 Aeration (rpm) 0.18 0.068 2.64 N.S X6 Inoculum (%) 0.056 0.068 0.82 N.S X7 Dye concentration (mg/ ml) 0.73 0.068 10.73 S X8 Temperature (°C) -0.30 0.068 -4.41 N.S
X9 pH 0.28 0.068 4.11 S
Bold type indicates positive effect, italic type indicates negative effect S-Significant; N.S- Non-Significant
Figure 3: Percentage contribution of each factor for Reactive Red 120 dye and Reactive Black 5 dye degradation
experiment is usually indicated by high value of CV. In the present case, a low CV (30.81 & 18.54) denoted that the experiments performed were highly reliable.
Table 4: Analysis of variance for reactive red dye degradation by P. aeruginosa
Source Sum of square Degree of freedom Mean square F- value P- value
Model 1.01 3 0.34 10.88 0.0034 Significant
C-yeast extract 0.23 1 0.23 7.45 0.0259
E-aeration 0.56 1 0.56 18.27 0.0027
H-temperature 0.21 1 0.21 6.92 0.0302
Residual 0.25 8 0.031
Cor Total 1.25 11
CV - 30.81; R2 - 0.80
Table 5: Analysis of variance for reactive black dye degradation by A. punctata
Source Sum of square Degree of freedom Mean square F- value P- value
Model 1.87 2 0.93 16.63 0.0009 Significant
G-dye 1.63 1 1.63 28.97 0.0004
J-ph 0.24 1 0.24 4.29 0.0683
Residual 0.51 9 0.056
Cor Total 2.37 11
CV -18.54; R2 - 0.78
According to the data obtained from the Plackett-Burman experimental results the predicted optimum medium for reactive red was as follows (g/ml): glucose, 0.01; maltose, 0.01; yeast extract, 0.01; ammonium nitrate, 0.01; dye concentration, 5; temperature, 25°C incubation at 120 rpm shaking condition. Optimum media composition for reactive black dye degradation is (g/ml): glucose, 0.01; maltose, 0.001; yeast extract, 0.01; ammonium nitrate, 0.1; dye concentration, 5; temperature, 25°C incubation at 120 rpm shaking condition. Under optimized conditions, maximum degradation was achieved at one and two days for reactive red and reactive black.
Effect of carbon and nitrogen sources on degradation efficiencies of microorganisms have been worked out few investigators. Nosheen et al. and Wang et al. have reported increased efficiencies of bacterial cultures with addition of carbon and nitrogen sources to the degradation medium [9, 13]. Many different co-substrates have been found to suit as electron donor, like glucose and yeast extract [14, 15].
LC-MS analysis: LC-MS analysis of the dyes and their degraded product confirmed degradation
of Reactive Black 5 by Aeromonas punctata and Reactive Red 120 dye by Pseudomonas
aeruginosa. The peak present in the spectra of the dyes were absent in the degraded products,
Figure 4: LC-MS spectra of Reactive Black 5 dye degradation product.
Figure 5: LC-MS spectra of Reactive Red 120 dye degradation product.
Acknowledgement
REFERENCES
[1] H Claus, GK Faber and H Konig. Appl. Microbiol. Biotehnol., 2002, 59, 672-678.
[2] GM Shaul, TJ Holdswort, CR Dempsey and KA Dostall. Chemosphere, 1991, 22, 107-119. [3] U Pagga and D Brown. Chemosphere, 1986, 15, 479-491.
[4] BR Lars and I Mallika. Chemosphere, 1997, 35, 585-597.
[5] R Fatemeh, W Franklin and CE Cerniglia. Appl. Environ. Microbiol., 1990, 56, 2146-2151. [6] M Karatas, D Sukru and EA Mehmet. Ekoloji., 2010, 19(74), 15-23.
[7] DC Kalyani, AA Telke, RS Dhanve and JP Jadhav. J. Haz. Mat., 2009, 163, 735-742. [8] NT Sheth and SR Dave. Biodegrad., 2009, 20, 827-836.
[9] X Wang, X Cheng, D Sun and H Qi. J. Envtl. Sci. 2008, 20, 1218-1225.
[10]A Telke, K Dayanand, J Jyoti and G Sanjay. Acta Chim Slov, 2008, 55, 320-323. [11]C Brilon, W Beckmann and M Hellwig. Appl. Environ. Microbiol., 1981, 42, 39-43. [12]RL Plackett and JP Burman. Biometrika, 1946, 33, 305 -325.
[13]S Nosheen, R Nawaz, M Arshad and A Jamil. Int. J. Agr. Boil. 2010, 12, 426-430.
[14]CM Carliell, SJ Barclay, N Naidoo, CA Buckley, DA Mulholland and E Senior. Water SA,
1995, 21, 61-69.