Study on Face Classification and Modeling Based on the
Respirator-fit Problem for Chinese Adults
Xiaotong Zhou, Xiaoxia Song*
Fashion Institute, Shanghai University of Engineering Science, China
Copyright©2019 by authors, all rights reserved. Authors agree that this article remains permanently open access under the terms of the Creative Commons Attribution License 4.0 International License
Abstract
Introduction: In China, respirator is widely used to protect the public from air pollution. The design of respirator is based on anthropometric date obtained from groups of people in RFTPs (respirator fit test panels). Meanwhile the respirator-user fit is not satisfied as unsatisfactory seal exist. Methods: To solve the respirator-user fit problem in China, this study was divided into four parts: The public head-face measurement and analysis of head data clustering; reverse establishment of head model can be based on the clustering results; using the model, forward design of mask structure can be conducted. Results: Combined with Rotation component matrix counting and the relative index, 3 out of 7 representative facial indexes can be used as clustering variables. They are nose length, bitragion breadth and face height. The optimal number of clusters was 5 determined by Mix-F statistics. According to the methods of mathematical statistics, it shows that the main kind is short and narrow which is the fifth in this article. By using the plaster replica method based on the 3D print of the facial model, the chart pattern of optimized small-face mask was achieved.Keywords
Mask, Head-face Measurements, Facial Classification, Reverse Modeling1. Introduction
In the context of environmental complexity, the use of masks is increasing, and the research on the dust filtration performance of scholars has also increased, which tends to be saturated. The problem of respirator-fit shows up. There are gaps in the solution for the fit of face and mask.
In Adri Spies’s study, only 13.8% of the volunteers demonstrated a successful fit with the medium sized mask through the Quantitative respirator fit test. He pointed out that the large percentage of failed fit tests indicates that reliance on off-the-shelf respirators could be problematic [1]. Zhang Xueyan et al used off-the-shelf masks to find
out the factors for FF (fitness factors). The results shows that gender has no significant effect on FF and face length and width are the main influencing factors [2].
The design of respirators on market is based in anthropometric data obtained from group of people in RFTPs(respirator fit test panels) which were originally developed by the NIOSH(National Institute for Occupational Safety and Healthy) based on a facial anthropometric survey of USA Air Force personnel[3]. A subsequent study’s results showed that over 35% China’s workforce fell outside the ranges derived from American PFTPs [4]. Then Yang lei et al. analyzed the head measurement data of hundreds of college students and teachers. They pointed out a new panel called LANL and the coverage of LANL is only 65.1% [5].
Therefore, in order to solve the problem of compactness, this study carried out head-face measurement and model analysis on the related indicators of human head and face.
2. Methods
2.1. The Experimental Measurements
The sample size was determined according to the ISO15535-2003,<Establish the sample size requirement
of human head database>[6],The calculation formula of
maximum sample size is as follow:
2
Δ σ × 96 . 1
n
= (1)
The maximum sample size is n=166. According to the random sampling method, the study selected 200 adults aged 18 to 29 (87 males and 113 females), among which 6 were excluded from invalid samples, and 194 were effectively measured (84 male and 110 female).
measurement points is marked on the head [7]. The measurement items include: face height, face width, bitragion breadth, bigonial breadth, nose length, nose width, nose depth [8].
2.2. Statistical Analysis
All statistical analysis was conducted by using professional data statistical analysis software. For presenting and analyzing facial anthropometric data, descriptive statistics were calculated. Facial dimension data were compared with RFTPs and LANL. In addition, the head-face clusters were analyzed by K-means cluster in order to find out the individual facial characteristics and provide basis for the establishment of head mode. Clustering variables was selected by rotation component matrix counting and the relative index (𝑅𝑅𝑖𝑖2).
𝑅𝑅𝑖𝑖2= (∑ 𝑟𝑟𝑖𝑖𝑖𝑖2)/(𝑚 −1),𝑗= 1,2, … ,𝑚 (2)
In the formula:𝑅𝑅𝐽𝐽2 is the eigenvalue of variable j;𝑟𝑟𝑖𝑖𝑖𝑖 is the coefficient of association, i≠j, j = 1,2,3, … , m,m is the number of indexes in the class.
The optimal classification number [9-10] was determined by using mixed F statistics (FMixed). FMixed is a
generalization of the degree of closeness and inter-class dispersion in all variables. The larger the value is, the closer the connection is within the class of all variables, and the more dispersed the interclass connections are. That is, when the FMixed value is the largest, the corresponding
classification number is the optimal classification number, and its calculation formula is as follows:
𝐹𝑀𝑖𝑖𝑥𝑒𝑑=∑ 1 𝐹(𝑘)
∑𝑃𝑘=1𝐹(1𝑘) 𝑃
𝑘=1 =∑ 𝑃 1
𝐹(𝑘)
𝑃
𝐾=1 (3) In the formula: P is the number of variables of clustering; F(k) is the F value of the Kth cluster variable, which can be
calculated by formula (4).
𝐹(𝑘) = ∑𝑐𝑖=1𝑛𝑖�𝑣𝑖𝑘−𝑣𝑘�×(𝑛−𝑐) ∑𝑐𝑖=1∑𝑛𝑖𝑗=1�𝑥𝑖𝑗𝑘−𝑣𝑖𝑘�2×(𝑐−1)
, 𝑘= 1,2, … ,𝑝 (4)
2.3. Reverse Modeling
Combined with the human body scanner equipment, we selected a subject of each index to be close to the main class cluster center. For processing and building head-face model, reverse modeling software was used.
2.4. Acquisition of Mask Pattern
In order to further analyze the dart value of the optimized mask, the two dimensional paper patterns were obtained by using the plaster replica method [14]. In this paper, 3D printing equipment is used to print out the mask model established above, with the external accuracy retained and the cover thickness of 0.5 cm.
3. Results
3.1. Results of Basic Data Statistics
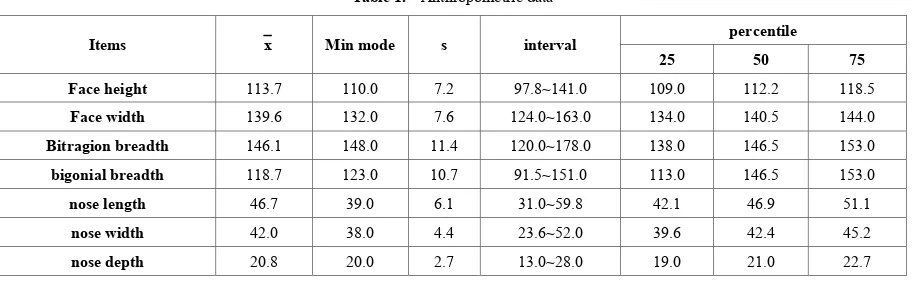
Table 1 compares the mean, minimum mode, standard deviation, range and corresponding percentile of 194 effective subjects.
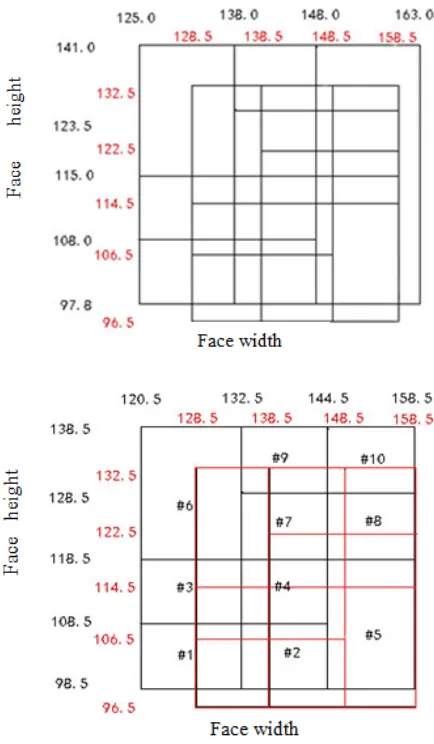
Figure.1 compares two dimensions (Face height and Face width) measured in this study with the RFTPs (the left one) published by NIOSH and the LANL (the right one). The results of facial width dimensions measured in this study were generally wider than RFTPs and LANL. However, Face height was shorter than those two kinds of panels.
Table 1. Anthropometric data
Items x Min mode s interval percentile
25 50 75
Face height 113.7 110.0 7.2 97.8~141.0 109.0 112.2 118.5
Face width 139.6 132.0 7.6 124.0~163.0 134.0 140.5 144.0
Bitragion breadth 146.1 148.0 11.4 120.0~178.0 138.0 146.5 153.0
bigonial breadth 118.7 123.0 10.7 91.5~151.0 113.0 146.5 153.0
nose length 46.7 39.0 6.1 31.0~59.8 42.1 46.9 51.1
nose width 42.0 38.0 4.4 23.6~52.0 39.6 42.4 45.2
[image:2.595.71.527.530.672.2]Figure 1. The comparison of the bivariate panel
3.2. Head-face Cluster Analysis
Factor analysis was carried out on the relevant measurement indexes of the above selected masks. The KMO value reached 0.805, which means the data suitable
[image:3.595.308.537.129.270.2]for factor analysis. The rotation component matrix of factor analysis is shown in table 2. The two main components were extracted.
Table 2. Rotation component matrix
Indexes Main factors
1 2
nose depth -0.070 0.744
nose width 0.228 0.713
nose length -0.052 0.849
Face width 0.789 0.271
Face height 0.493 0.396
bigonial breadth 0.813 -0.111
Bitragion breadth 0.873 -0.109
The first factor has a large load on the face width, bitragion breadth, and bigonial breadth. The second factor has a large load on nose length, nose width, nose depth. Therefore, the two factors actually represent the facial size and the extent of the nose.
To figure out the Selection of cluster variables, table 3 shows the results of Relative index for different dimensions. In the indexes of facial factor, the 𝑅𝑅𝑖𝑖2 of biragion breadth is highest. And in the indexes of nose factor, the value of nose length is highest. Compared the result with previously published data, the face height was selected as well.
Table 3. Relative index of face and nose
Indexes of facial factor Indexes of nose factor
Face
width bigonial breadth Bitragion breadth depthnose widthnose lengthnose
0.30 0.30 0.34 0.15 0.17 0.21
Table4. shows the FMixed values corresponding to each category number(c). When c is 5, the corresponding
FMixed value is the largest, so 194 adult faces are divided into 5 categories.
The clustering center values and frequency statistics of various types of face shapes were summarized in table5.
Table 4. Fmixed values of different cluster number
Cluster
Number 2 3 4 5 6 7 8 9 10
FMixed 8.07 56.77 66.07 76.90 55.85 63.76 53.68 60.30 68.04.
Table 5. Final cluster cente
Types nose length Bitragion breadth Face height Frequency
1 5.15 14.64 11.81 51
2 4.11 15.12 10.91 48
3 4.09 15.84 12.16 19
4 5.34 16.51 12.15 14
[image:3.595.70.525.571.720.2]After comparison of the characteristics of various facial features, it was found that the first class had a small horizontal circumference, and the length of the morphological surface and the longitudinal size of the nose were of moderate deviation.
The horizontal dimension of the second class is at medium level, while the length of the morphological surface and the longitudinal dimension of the nose are short.
The third kind of transverse dimension is wider, the overall face is the longest, but the nose is shorter;
The fourth type is the broadest, and the overall length and nose length are longer.
Category 5 is the narrowest, with a medium and short length, which can be used as the standard face.
As a whole, we can see that the face shape in our adults is short and narrow. However, the uniform size design of the mask in the market is not consistent with that, so we need to further study the facial model.
3.3. Head-face Reverse Modeling
Combined with the human body scanner equipment [11], we selected a subject of each index to be close to the 5th class cluster center, so as to conduct the reverse modeling operation. First, the scanned ASC point cloud files are preprocessed, including point coloring, noise removal and redundancy, and simplified filtration. Due to the feature of multi-curved face, the maximum triangular number is set to 1 million to ensure that the polygonal mesh is tightly packed [12]. Later, the encapsulated triangular faces are saved as STL format, as shown in figure 2.
Figure 2. The triangle model of the head
In addition to the face, the redundant parts are cut. Then the rest is sealed off, and the coordinate system is constructed to create the fitting surface. The specific operation is to select part of the grid surface from the grid surface and use the selected grid surface as the reference water plane, namely the datum plane, through the "fitting plane" tool.
On the datum plane, the vertical line of the line of parallel to the earlobe and the tip of the nasal tip is the XY axis. After determining the positive direction, the upward stretch produces three mutually perpendicular planes. The curve mesh is automatically created on the surface and the
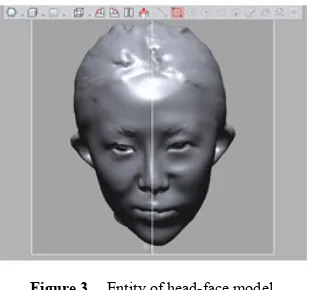
surface is fitted to the grid to maintain the precision of the underlying grid. Finally, the generated entity is saved as STP format file, which can be used for the forward design head model of the mask, as shown in figure 3.
Figure 3. Entity of head-face model
3.4. Chart Pattern of Optimized Small-face Mask
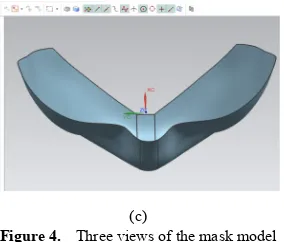
Based on the head entity model, the curved surface is created by section line. The plane formed by the three-dimensional X, Y and Z axes and the rotation deformation of the corresponding angle generates the section. The section and the cross section string (main line string and cross section string) generated by the entity need to intersect within the set tolerance range, and should be roughly perpendicular to each other. The mask is a complex surface based on the head curve. It needs to complete the main or large surface first, then smooth the connection surface, and finally edit and modify it [13]. The final surface model is shown in the figure below.
(a)
[image:4.595.345.501.131.276.2] [image:4.595.349.494.461.754.2](c)
Figure 4. Three views of the mask model
The operation process is as follows: Plastic-shaped clay is attached to the 3D mask model and excess clay at the edge is disposed; after drying with a hair dryer, the clay is removed from the 3d-printed model. The obtained mask plaster mold was cut and decomposed along the connection line between the nose and two gnathions, as well as the horizontal line passing the gnathions.
Figure 5. 3D-mask model AND Chart pattern
4. Discussion
In this study, traditional anthropometric measuring methods were used. Part data were compared with digital scanning to ensure data accuracy. Traditional measuring methods involve not only measuring tools but also a human touch and feelings. Digital face measuring can obtained data quickly and precisely. However there were some problems. One of them is lack of portability so it can be used to carry out large-scale data acquisition. Digital scanning in this article is used to utilize to make head-face model.
Many studies on respirators designed using these NIOSH PFTPS’ have mostly focused on white males [15].Until recently, a small number of studies included other ethnic group, mainly Asian and these studies illustrated that Asians were afforded a lower level of protection than white males when using the same respirators [16]. This study suggests that Chinese adults
had shorter and wider faces nowadays. These facial characteristic differences are similar to those found in present study. In addition, through the fig1 the results of facial length and width were found to be different from those reported in other Chinese studies. People come in many shapes and sizes and therefore the ability of given respirator to form an effective barrier between wearer and the contaminated environment affected by facial characteristic. Larger number of participants coming from different age groups and regions are needed on further researches.
As mentioned earlier, a mean face model was done by selection from the 5th group (small-face group) which is the
main part in the samples and this study provided an optimized chart pattern of small-face mask. However the authors found that all the adults’ face can be divided into five groups. This implies the further studies can be conducted on the other kinds of face shapes.
5. Conclusions
To find a new way to solve the respirator-fit problem for Chinese adults, a study on head-face classification and modeling was performed. In this article, those indexes of 194 adults related to design and production of mask were measured. The adults’ face of our country is divided into 5 categories with the selected representative indicators. After comparison, we found that main shape of our adults’ faces is small, which is not consistent with the large face masks of the present market. Reverse modeling of the standard face shape with the most frequency helps to find out the chart pattern of optimized small-face mask. From this limited study it suggests that larger studies are needed on facial dimensions and further study should aim to develop more types and size respiratory.
Acknowledgment
This work was supported by the Institute of Fashion Technology, Shanghai University of Engineering and Science. The authors are indebted to all the volunteers for their acceptance of measurement.
REFERENCES
Chen Weihong. Research progress on the suitability and [1]
protective effect of self-priming filter respirator.[J] Journal of Public Health and Preventive Medicine, 2014.25(6)J. Clerk Maxwell, A Treatise on Electricity and Magnetism, 3rd ed., vol. 2. Oxford: Clarendon, 1892, pp.68–73.
Yu Dan, Zhuang Z, Cheng Shijuan. Two new. [2]
[image:5.595.105.247.79.200.2] [image:5.595.65.283.300.480.2]400-404.
ISO15535-2003, Establish the sample size requirement of [3]
human head database[S]
Yang.L, Shen.HG, Wu.G. Racial Differences in Respirator [4]
Fit Testing: A Pilot Study of Whether American Fit Panels are Representative of Chinese Faces. Ann. Occup. Hyg, 2007,2:1-7.
Zhuang Z., Bradtmiller B., Shaffer R. (2007) New respirator [5]
fit test panels representing the current U.S. civilian work force. Journal of Occupational and Environmental Hygiene. ZHANG Wenbin, FANGFang. Apparel Somatology [M]. [6]
Shanghai: Donghua University Press,2008:93-95. GB/T5703-1999, Basic human body measurements for [7]
technological design[S].
GBT2428-1998, Adult head facial size[S]. [8]
Aung SC, Ngim RC, Lee ST.Evaluation of the laser scanner [9]
as a surface measuring tool and its accuracy compared with direct facial anthropometric measurements [J]. Br J Surg, 1995, 48 (8).
SUN Caizhi, WANG Jindong, PAN Jun, Research on the [10]
nethod of determing the optimal class number of fuzzy cluster [J]. Fuzzy Systems and Mathematics, 2001(1): 89-91.
TONG Jing, ZHOU Jin, Liu Liguang, et al. Scanning 3D [11]
full human bodies using Kinects [J]. Visualization and Compiter Graphics, 2012, 18(4): 643-650.
WANG Shanshan,WANG Lei,ZHU Bo,WANG Hongbo. [12]
Study on three-dimensional model of onthejob men's neck based on SolidWorks [J]. Journal of Textile Research, 2015, 36 (4):107-112.
Hou yongtao, ding xiangyang. UG/OPEN development and [13]
case study [M]. Beijing chemical first industry press, 2007 Yu Y,iang L, Zhuang Z,et al. Fitting Characteristics of [14]
N95 Filtering-Facepiece Respirators Used Widely in Chin [J]. PLo SOne,2014,9( 1) : e85299
Zhuang z,bradtmiller B, shaffer RE:NEW respirator fittest [15]
panels representing the current U.S Civilian workforce, Occ Environ Hyg 2007, 4:647-659.
Yang L, Shen H, Wu G: Racial differences in respirator Fit [16]