Effect of Mn Doping Concentration on Structural,
Morphological and Optical Studies of ZnO Nano-particles
V. D. Mote
1,*, J. S. Dargad
1, B. N. Dole
21Department of Physics, Dayanand Science College, Latur-413 531, Maharashtra, India
2Advanced Materials Research Laboratory, Department of Physics, Dr. Babasaheb Ambedkar Marathwada University, Aurangabad-431 004, Maharashtra , India
*Corresponding author: [email protected]
Copyright @ 2013 Horizon Research Publishing All rights reserved.
Abstract
We report the crystal structure, morphology and optical properties of the Zn1-xMnxO nanoparticles with nominal composition (x = 0.00, 0.05, 0.10, 0.15 & 0.20) were synthesized by sol-gel route. The crystal structure analysis was carried out by X-ray diffraction technique (XRD), morphology and particle size was investigated using Transition electron microscopy (TEM), Optical characterization was performed using UV-VIS technique. The XRD studies show that samples have wurtzite (hexagonal) crystal structure. In addition to this XRD results also indicate no extra impurity or secondary phases are observed. The lattice parameters a and c of Zn1-xMnxO nanoparticles increase with increasing Mn content which indicates that Mn2+ ions go to Zn2+ ions in the ZnO lattice. The atomic packing fraction (APF) increase of Mn doped ZnO nanoparticles with increasing Mn content. TEM microphotographs show that the pure and 10% Mn doped ZnO nanoparticles are in spherical shape and their average particle size of pure and 10% Mn doped ZnO nanoparticles are found in the range of 20-60 nm. The optical energy band gap decreases with increasing Mn concentration, it may be owing to Mn clustering.Keywords
Nano-particles, APF, surface area to volume ratio, Cluster1. Introduction
Zinc oxide (ZnO) has attracted much attention in the last few decades due to its wide variety of application such as sensors, field-emission transistors, ultraviolet photo-detectors, biomedical systems such as ultrasensitive DNA sequence detectors [1-5]. ZnO is a semiconductor with a wide band gap i.e. 3.37 eV. The stable structure of ZnO is mostly in wurtzite structure, in which four atoms of oxygen in tetrahedral co-ordination surround each atom of zinc. Zinc oxide is also used for spintronics applications with magnetic ions i.e. Co, Ni, Mn, V and Fe doping. For this reason, Mn
doping has valuable spin off in electrical, magnetic and optical properties of ZnO. Thus Mn doped ZnO has become a reasonable choice for diluted magnetic semiconductor (DMS). Diluted magnetic semiconductor (DMS) materials have many unique applications such as magneto-optical, magneto-electrical and magneto-transport properties etc [6]. Different methods have been used to synthesis of nanopowders of Mn doped ZnO like sol-gel [7], co-precipitation [8], combustion [9], solid state sintering methods [10], hydrothermal synthesis [11], thermal evaporation of Zn [12], spray pyrolysis [13] and low temperature wet-chemical method [14] these methods have occurred worldwide in nanotechnology. In this study we focused on the structural, morphological and optical properties of Mn doped ZnO nanoparticles prepared by sol-gel technique. Effect of Mn doping on the lattice parameters, crystallite size, volume of unit cell, atomic packing fraction (APF), X-ray density and energy band gap were investigated qualitatively and quantitatively in this paper.
2. Experimental Details
temperature. To get the powdered sample of pure ZnO. For preparation of Mn doped ZnO, the appropriate amounts of two precursors of Zinc acetate (ZnCH3CO2)2.2H2O) and Manganese acetate (Mn (CH3CO2)2.4H2O) were thoroughly dissolved in N-dimethylformamide (DMF), stirred for 3 hours using hot plate with a magnetic stirrer. The temperature was maintained at 30-40 0C for complete dissolution. It was then raised and held at 70-80 0C for 2 hours until all fluid was evaporated then gel is obtained. These gels were heated at 150 0C for 3 hrs in the furnace for dehydration. These precursors were ground in an agate mortar by pestle for 30 minutes to obtain fine powder. These powders placed in a Al2O3 crucible for sintering in furnace at 450 0C for 8 hrs followed by furnace cooling at room temperature. This time, dark yellowish colored powders were obtained which indicate that only single phase is formed for getting the powdered samples of Zn1-xMnxO system. The crystal structure of all the samples studied using X-ray diffractometer (Model: PW-3710) with Cukα (λ = 1.5406 Ao) radiation. It was used for recording X-ray diffraction pattern operating at 40 kV and 40 mA.
To study the sample morphology, the powders were ultrasonically mixed with ethanol and suspended on a Cu mesh, which was the sample holder of a transmission electron microscope (TEM) operated at 200 kV (TEM- Model CM 200, SUPERTWIN). Absorption spectra of the samples in the UV-visible spectral region were recorded using UV-VIS-NIR (JASCO V 570) spectrophotometer for the determination of energy band gap of Mn doped ZnO nanocrystals.
3. Results and Discussion
3.1. Structural Analysis
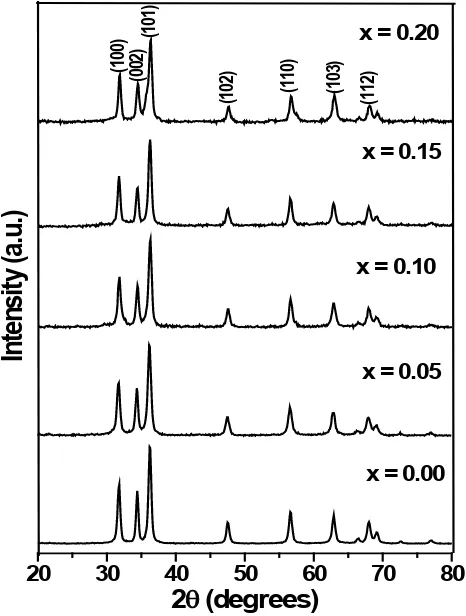
The structure parameters and phase purity of pure and different concentration of Mn substituted ZnO nanoparticles sintered at 4500C were estimated using X-ray diffraction (XRD). Figure 1 shows XRD patterns of pure and Mn substituted ZnO nanoparticles with nominal composition i.e. x = 0.00, 0.05, 0.10, 15 and 0.20 samples. The diffraction peaks with intensity correspond to the plane such as (100), (002), (101), (102), (110), (103), (200), (112) and (201). It indicates that all sintered samples have hexagonal (wurtzite) crystal structure. It also has been seen that the XRD peak broadening increases with increasing Mn content, when the doping of Mn up to 20%. There is no any extra peak of manganese metal, oxides, or any impurity phases were observed. It indicates that all samples are single phase. Sharma et al [15] reported that the presence of secondary phases like ZnMn2O3 or Mn3O4 in the Mn doped ZnO nanoparticles. But in our case the Mn ions go to Zn site up to 20% without changing the wurtzite crystal structure and no formation of secondary phases when the samples prepared by sol – gel route at temperature 4500C. The reflection peaks
in the diffraction patterns of Mn substituted ZnO nanoparticles are slightly shifted to lower angle as compared to the pure ZnO nanoparticles. It evidences the Mn2+ ions go to Zn2+ sites.
20
30
40
50
60
70
80
2
θ
(degrees)
x = 0.05
(100)
x = 0.10
Int
en
sit
y (
a.u
.)
x = 0.20
x = 0.15
x = 0.00
(112)
(103)
(110)
(102)
(10
1)
(00
[image:2.595.314.547.135.443.2]2)
Figure 1. X-ray diffraction pattern of Zn1-xMnxO samples.
3.2. Lattice Parameters
The lattice parameters a & c of the samples were calculated using following equation.
[
2 2]
22 2 2
1
4
3
hkl
h hk k
l
d
a
c
+
+
=
+
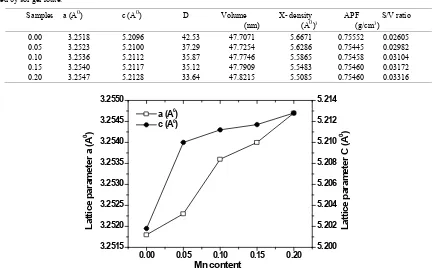
(1)Table 1. The lattice parameters, crystallite size (D), volume of unit cell, X-ray density, APF and surface area to volume ratio of Mn doped ZnO samples synthesized by sol-gel route.
Samples a (A0) c (A0) D Volume X- density APF S/V ratio (nm) (A0)3 (g/cm3)
0.00 3.2518 5.2096 42.53 47.7071 5.6671 0.75552 0.02605 0.05 3.2523 5.2100 37.29 47.7254 5.6286 0.75445 0.02982 0.10 3.2536 5.2112 35.87 47.7746 5.5865 0.75458 0.03104 0.15 3.2540 5.2117 35.12 47.7909 5.5483 0.75460 0.03172 0.20 3.2547 5.2128 33.64 47.8215 5.5085 0.75460 0.03316
0.00 0.05 0.10 0.15 0.20
3.2515 3.2520 3.2525 3.2530 3.2535 3.2540 3.2545 3.2550
a (A0)
c (A0)
Mn content
Lat
tice p
ar
am
et
er
a (
A
0 )
5.200 5.202 5.204 5.206 5.208 5.210 5.212 5.214
Lat
tice p
ar
am
et
er
C
(A
0 )
Figure 2. Lattice parameters versus Mn content of Zn1-xMnxO samples.
3.3. Volume of Unit Cell and X-Ray Density
The volume of unit cell was calculated using the equation 2
3
2
V
=
a c
(2) It was found that the volume of unit cell increases with increasing Mn content. It may be due to increasing the lattice parameters a and c. These values of volume of unit cell are tabulated in table 1. The X- ray density was estimated using the equationx A
nM
P
N V
=
(3)Where n is number of atoms per unit cell, M is the molecular weight, NA is the Avogadro's number and V is the volume of unit cell. The X-ray density reduces with increasing Mn content of Zn1-xMnxO nanoparticles. It may be due the increasing volume of unit cell as well as decreasing molecular weight of the samples. The molecular weight of Mn (58.930 amu) ions is smaller than that of Zn (65.38 amu) ions. The values of X-ray density of Zn1-xMnxO nanoparticles are listed in table 1. The volume of unit cell increases and X-ray density decreases with increasing Mn content respectively. It means that Mn ions go to Zn site in ZnO structure.
3.4. Atomic Packing Fraction (APF)
Atomic packing fraction (APF) was calculated using formula
c
a
APF
3
3
2
π
=
(4)Where a & c are the lattice parameters. The value of APF is listed in table 1. It is found that the APF increases with increasing Mn content, it may be due the decrement of voids in the samples. The APF of bulk hexagonal ZnO materials is about 74% but in our case the APF of Zn1-xMnxO nanoparticles is nearly 75% in hexagonal structure. It means that APF in nanocrystals are slightly larger than that of bulk materials. It may be due to the size effect in the nanocrystalline samples. The APF increases with increasing Mn content of Zn1-xMnxO nanoparticles, it indicates homogenous substitution of Mn ions in the Zn site of ZnO structure.
3.5. Average Crystallite Size (D)
The average crystallite size was estimated using Scherrer’s formula.
hkl
K
D
Cos
λ
β
θ
=
(5)with increasing Mn content of Zn1-xMnxO nanoparticles. It may be due to the small grain growth of Mn doped ZnO nanoparticles as comprised with pure ZnO nanoparticles. The values of average crystallite size are listed in table 1.
3.6. Surface Area to Volume Ratio
It is very important to know the surface area to volume ratio of the nanomaterials were general and in particular the selected system. Therefore, we have initiated the program to determine the surface area to volume ratio of Mn doped ZnO nanoparticles using the following equation
0 0
0 0
3
3
surface
volume
N
SR
R
N
=
V SR
−
=
R
−
R
(6)Where Nsurface and Nvolume are the number of Zn-O pair at surface and in the volume respectively. S is the surface area, V is the volume, R0 is the ZnO distance (0.18 nm) and R- is the average particle radius. The surface area to volume ratio versus Mn concentration plot is shown in figure 3.
[image:4.595.319.540.175.342.2]The values of surface area to volume ratio are listed in table 1. Table 1 show that the surface area to volume ratio increases with increasing Mn doping ZnO samples. It may be due to the decreasing in average crystallite size of the Zn1-xMnxO nanoparticles. The reduction in average crystallite size with increasing Mn content which increases the surface area to volume ratio. The values of surface to volume ratio is small, it means that the particles are completely spherical in shape. Similar results are reported in literature [17]. The surface area to volume ratio is large due to the small particle and the surface effect described for (Zn, Mn)-O pairs at the surface changing the Zn1-xMnxO nanoparticles of average crystallite size. The surface area to volume ratio versus average crystallite size is shown in figure 4.
3.7. Surface Morphology
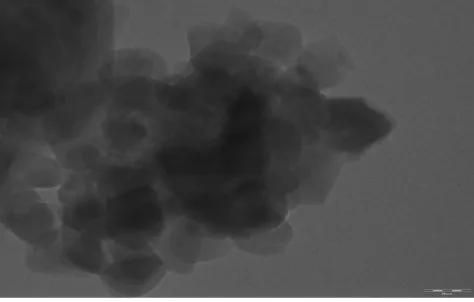
The particle size is determined of pure and Mn substituted ZnO nanoparticles using TEM. From XRD, the average crystallite size was calculated using Scherrer’s formula. However, from TEM the particle size is directly measuring and also morphology of the particles. Figures 5 (a & c) show the TEM images of pure and 10% Mn substituted ZnO nanoparticles. The TEM images of pure and Mn substituted ZnO nanoparticles show the samples are in spherical shape with smooth surface. The particle size of pure and Mn substituted ZnO nanoparticles are estimated to about 20-60 nm in diameter.
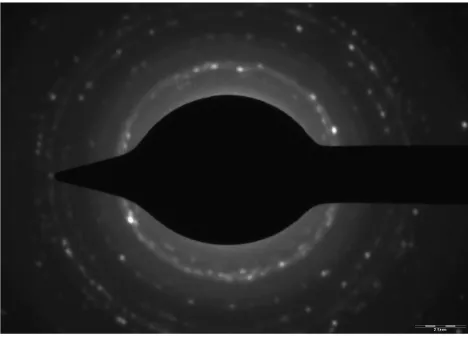
The figures 5 (b & d) present a spotted ring-like SAED (selected area electron diffraction) pattern decorated with random bright spots which demonstrate that the particles have crystalline nature. The selected area electron diffraction (SAED) pattern consists of nine concentric sharp rings, which corresponded to the (100), (002), (101), (102), (110), (103), (200), (112) and (201) of diffraction of the ZnO in the
wurtzite structure. Therefore, it can be further confirmed that the nanoparticles are spherical in shape. Other secondary phases are not observed in figures 5(b & d). It means the Mn ions are diluted in the ZnO matrix. No notable contrast is induced by the interstitial Mn in the ZnO matrix. It indicates that Mn atoms may be mainly located at substitution sites. These results are in good agreement with the XRD results and confirm absence of secondary phases.
0.00 0.05 0.10 0.15 0.20
0.025 0.026 0.027 0.028 0.029 0.030 0.031 0.032 0.033 0.034
Nsurface /Nvo
lu
m
e
[image:4.595.115.257.225.258.2]Mn concentration
Figure 3. Nsurface / Nvolume versus Mn concentration of Zn1-xMnxO samples.
32 34 36 38 40 42 44
0.025 0.026 0.027 0.028 0.029 0.030 0.031 0.032 0.033 0.034
Nsurface
/Nvol
um
e
Average grain size(nm)
Figure 4. Nsurface / Nvolume versus average crystallite size of Zn1-xMnxO
samples.
[image:4.595.320.545.381.535.2] [image:4.595.314.551.578.729.2]Figure 5(c). TEM image of Zn0.90Mn0.10O nanoparticles.
Figure 5(b). Selected area diffraction (SAED) image of pure ZnO
nanoparticles.
Figure 5(d). Selected area diffraction (SAED) image of Zn0.90Mn0.10O
nanoparticles.
3.8. Optical Studies
The effect of Mn on the energy band gap of pure ZnO and substituted of Mn2+ ions in tetrahedral sites of wurtzite structure of ZnO was confirmed using UV-Visible optical spectroscopy measured in the range of 200 – 1000 nm. The UV-Vis absorption spectra of the ZnO and Mn doped ZnO nanoparticles prepared at 4500C are shown in figure 6. The red shift in the absorption edge was observed in the prepared
[image:5.595.63.296.75.232.2]samples. It may be due to the surface effect and average crystallite size or morphology. It is observed that the enhancement in red shift band edge with increasing Mn concentration. It indicates for the incorporation of Mn ions into the Zn site of the ZnO lattice.
Figure 6. Absorption spectra of Zn1-xMnxO nanoparticles.
The absorption coefficient α is calculated from the absorption spectra using the equation.
1
A
d
α = −
(7)Where d is the thickness of samples cell (1 cm) and A is the absorbance. The relation between the incident photon energy (hν) and the absorption coefficients (α) is given below
1/
(
)
m(
)
g
hv
c hv E
α
=
−
(8)Where c is a constant and Eg is the energy band gap of the material and the exponent m depends on the type of the transition. For direct and allowed transition m = 1/2, indirect transition m = 2 and for direct forbidden m = 3/2.
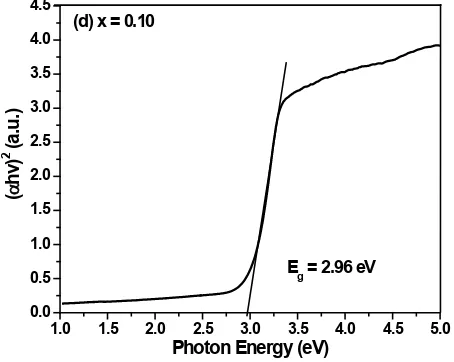
The energy band gap Eg estimated using the intercept of the linear portion of the curve (αhν)2 to Y=0. The plots of (αhυ)2 versus energy (E) is shown in figures 7 (a-e).
1.0 1.5 2.0 2.5 3.0 3.5 4.0 4.5 5.0
0.0 0.5 1.0 1.5 2.0 2.5 3.0 3.5 4.0
(a) x = 0.00
Eg=3.26 eV
(
α
hv
)
2 (a
.u
.)
Photon Energy (eV)
[image:5.595.321.548.143.306.2] [image:5.595.62.293.253.403.2] [image:5.595.58.292.438.607.2] [image:5.595.329.533.565.724.2]1.0 1.5 2.0 2.5 3.0 3.5 4.0 4.5 5.0 0.0
0.5 1.0 1.5 2.0 2.5 3.0 3.5 4.0
Eg = 2.98 eV
(c) x = 0.05
(
α
hv
)
2 (a
. u
.)
Photon Energy (eV)
Figure 7(b). (αhυ)2 versus photon energy of Zn0.95Mn0.05O
nanoparticles.
1.0 1.5 2.0 2.5 3.0 3.5 4.0 4.5 5.0
0.0 0.5 1.0 1.5 2.0 2.5 3.0 3.5 4.0 4.5
Eg = 2.96 eV
(d) x = 0.10
(
α
hv
)
2 (a
.u
.)
Photon Energy (eV)
Figure 7(c). (αhυ)2 versus photon energy of Zn0.90Mn0.10O
nanoparticles.
1.0 1.5 2.0 2.5 3.0 3.5 4.0 4.5 5.0
0.5 1.0 1.5 2.0 2.5 3.0 3.5 4.0
(e) x = 0.15
Eg = 2.93 eV
(
α
hv
)
2 (a
.u
.)
Photon Energy (eV)
Figure 7(d). (αhυ)2 versus photon energy of Zn0.85Mn0.15O
nanoparticles.
1.0 1.5 2.0 2.5 3.0 3.5 4.0 4.5 5.0
0.5 1.0 1.5 2.0 2.5 3.0 3.5 4.0 4.5 5.0
(f) x = 0.20
Eg = 2.85 eV
(
α
hv
)
2 (a
.u
.)
Photon Energy (eV)
Figure 7(e). (αhυ)2 versus photon energy of Zn
0.80Mn0.20O nanoparticles. We obtained the energy band gap of Zn1-xMnxO nanoparticles decreases with increasing Mn content. It may be due to the sp-d spin exchange interaction between the band electrons and localized d electrons of Mn ions substituting in cation sites. It is found that the band gap of Zn1-xMnxO nanoparticles to be in the range of 3.26 to 2.85 eV. Optical energy band gap goes on decreasing with increasing Mn content it may be due to Mn clustering, reduction in average crystallite size and enhancement of surface area to volume ratio. Our experimental results indicate a red shift in the band gap. It indicates that red shift of the band gap confirms the substitution of Mn ions in ZnO nanoparticles. The energy band gap versus Mn content of Zn1-xMnxO nanoparticles is shown in figure 8.
0.00 0.05 0.10 0.15 0.20
2.8 2.9 3.0 3.1 3.2 3.3
Ene
rgy
ba
nd ga
p E
g
(e
V)
[image:6.595.65.291.81.254.2]Mn content
Figure 8. Energy band gap versus Mn content of Zn1-xMnxO
nanoparticles.
[image:6.595.325.537.82.248.2] [image:6.595.65.292.305.486.2] [image:6.595.318.548.448.638.2] [image:6.595.64.290.538.716.2]volume ratio. Wang et al [19] also reported that decreasing energy band gap with increasing Mn content upto 5% in the ZnO. It may be due to sp-d exchange interaction between transition metal ions and Zn anions.
4. Conclusion
The samples of Mn doped ZnO nanoparticles were synthesized successfully by sol-gel method. The crystal structure, morphology and optical properties of the Zn1-xMnxO nanoparticles were investigated at length. The pure and Mn doped ZnO nanoparticles have wurtzite (hexagonal) crystal structure. The lattice parameters a and c increase with increasing Mn content of Zn1-xMnxO nanoparticles. The volume of unit cell increases with increasing Mn content which indicates that Mn2+ ions go to Zn2+ ions in ZnO lattice. The X-ray density decreases with increasing Mn content. Reduction in average crystallite size with increase the Mn content and surface area to volume ratio increases with increasing Mn content i.e. size effect was observed in the samples. The APF of Zn1-xMnxO nanoparticles increases with Mn content. It may be due to the reduction of voids in the prepared samples. TEM results show that pure and 10% Mn doped ZnO nanoparticles are spherical in shape and the average particle size are in the range of 20 – 60 nm. The optical energy band gap decreases with increasing Mn content of Zn1-xMnxO nanoparticles. It may be owing to Mn clustering, reduction in average crystallite size and enhancement of surface area to volume ratio.
REFERENCES
[1] Wang X, Song J, Wang ZL: Nanowire and nanobelt arrays of zinc oxide from synthesis to properties and to novel devices. J. Mater. Chem. 2007, 17: 711-720.
[2] Hongsith N, Viriyaworasakul C, Mangkorntong P, Mangkorntong N, Choopun S: Ethanol sensor based on ZnO and Au-doped ZnO nanowires. Cram. Int. 2008, 34: 823-826.
[3] Arnold MS, Avouris P, Pan ZW, Wang ZL: Field-Effect Transistors Based on Single Semiconducting Oxide Nanobelts. J. Phys. Chem. B 2003, 107: 659-663.
[4] Jun JH, Seong H, Cho K, Moon BM, Kim S: Ultraviolet photodetectors based on ZnO nanoparticles. Cerm. Int. 2009, 35: 2797-2801.
[5] Kumar N, Dorfman A, Hahm JI: Ultrasensitive DNA sequence detection using nanoscale ZnO sensor arrays.
Nanotechnology 2006, 17: 2875-2881.
[6] Dalpia GM, Wei S, Gong XG, Da silva AJR, Fazzio A: Phenomenological band structure model of magnetic coupling in semiconductors. Solid state commun. 2006, 138: 353-358.
[7] Dole BN, Mote VD, Huse VR, Purushotham Y, Lande MK, Jadhav KM, Shah SS: Structural studies of Mn doped ZnO nanoparticles. Current Applied Physics 2011, 11: 762-766. [8] Mote VD, Purushotham Y, Dole BN: Structural and
morphological studies on Mn doped ZnO nanometer-sized crystals. Cryst. Res. Technol. 2011, 46: 705-710.
[9] Riahi-Noori N, Sarrof-Momoory R, Alizadeh P, Mehdikhoni A: Synthesis of ZnO nano powder by a gel combustion method. J. Ceram. Process. Res.2008, 9: 246-249.
[10] Chattopadhyay S, Dutta S, Banerjee A, Jana D, Bandypadhyay S, Chattopadhyay S, Sarkar A: Synthesis and characterization of single-phase Mn-doped ZnO. Physica B.2009. 404: 1509-1514.
[11] Zhang H, Yang DR, Li DS, Ma XY, Li SZ, Que DL: Controllable Growth of ZnO Microcrystals by a Capping-Molecule-Assisted Hydrothermal Process. Cryst. Growth. Des. 2005, 2: 547-550.
[12] Shen GZ, Bando Y, Lee CJ: Synthesis and Evolution of Novel Hollow ZnO Urchins by a Simple Thermal Evaporation Process. J. Phys. Chem. B 2005, 109: 10578-10583.
[13] Kodas TT: Generation of complex Metal Oxides by Aerosol Processes: Superconducting ceramic particles and films. Adv.Mater. 1989, 6: 180-191.
[14] Liu B, Zeng HC: Room Temperature Solution Synthesis of Monodispersed Single-Crystalline ZnO Nanorods and Derived Hierarchical Nanostructures. Langmuir 2004, 20: 4196-4204.
[15] Sharma VK, Varma GD: Investigations on the effect of gaseous environment during synthesis on the magnetic properties of Mn-doped ZnO. J. Alloys compounds 2008, 458: 523-527.
[16] Abrishani ME, Hosseini SM, Kakhki EA, Kompany A: Structural and optical properties of zinc oxide nanopowders doped with Mn. Phys. Stautus C 2010, 7: 1595-1598. [17] Kazemi A, Abayan M, Ketabi SA: Controlled structural and
optical properties of ZnO nano-particles. Phys. Scr. 2010, 82: 035801.
[18] Sanyal D, Chakrabarti M, Chakrabarti A: Synthesis and positron characterizations of ferromagnetic and paramagnetic samples. Solid State Communication, 2010, 150: 2266-2269.