Munich Personal RePEc Archive
Does the Dutch Model Really Exist?
van der Hoek, M. Peter
Erasmus University Rotterdam
2000
Does the Dutch Model Really Exist?
M. PETER VAN DER HOEK
Abstract
The policy that has led from the ‘Dutch disease’ (in the 1980s) to the ‘Dutch miracle’ (in the 1990s)
consists of three tracks: 1) wage moderation, 2) retrenching public expenditure and reducing the tax burden, 3) slimming the welfare system. The wage moderation track seems to have been the most important one. The term ‘Dutch model’ refers to the socioeconomic system of the Netherlands. Most observers point in particular to the relatively low unemployment rate to indicate the success of this model. However, the economic inactivity rate in the Netherlands is not lower than in neighboring countries. This suggests that open unemployment in the Netherlands has partly been replaced with hidden unemployment. In particular the disability scheme seems to contain a large component of hidden unemployment. Another feature of the Dutch model is its consensus seeking nature, which is fostered by its institutional structure. (JEL code: H50)
Introduction
[image:2.595.62.410.485.730.2]Unemployment is one of the main socioeconomic problems of the European Union. In 1999, an estimated 17 million persons were unemployed in the EU, which corresponds with an unemployment rate of 10.1% of the labor force (OECD, 1999, p. 247 and 249). This compares to an unemployment rate of 4.2% in the USA and 4.9% in Japan. Obviously, the European economies performed relatively poorly in the 1990s. Table 1 displays that Luxembourg is the country with the lowest unemployment rate of all EU member states (3.1%). Other countries that perform relatively well are the Netherlands (3.9%), and Por-tugal (5.0%). Spain suffers the highest unemployment rate (17.4%), but Italy (12.1%), France (11.3%), Belgium (11.1%), Germany (10.7%), Finland (10.6%), and Greece (10.2%) are not very successful in fighting unemployment either. Projections for 2000 show a slight decrease of the unemployment rate in the European Union, but it is not expected that this will significantly change the rank order of member states.
Table 1. Unemployment rates in the European Union.
1999 2000
European Union 10.1 9.8
Luxembourg 3.1 3.0
Netherlands 3.9 4.1
Portugal 5.0 5.0
Sweden 5.6 5.3
Denmark 5.7 5.8
Austria 6.3 6.1
United Kingdom 6.7 7.3
Greece 10.2 10.1
Finland 10.6 10.0
Germany 10.7 10.0
Belgium 11.1 10.9
France 11.3 10.8
Italy 12.1 11.9
Spain 17.4 16.2
Source: OECD, 1999, p. 247.
In this paper I will focus on the Netherlands,1 a country that has attracted much attention from for-eign observers. In the 1970s, the Netherlands gave rise to the concept of the Dutch disease. By the end of the decade the economic situation was considered to be more or less deplorable and in the early 1980s the country served as a kind of bugbear to other countries. Within a quarter of a century, however, the Nether-lands seems to have experienced a metamorphosis witness a leader in The Wall Street Journal Europe of April 25-26, 1997:
„Compared to its European neighbors, the Netherlands is a case apart. The Dutch have su
c-cessfully kick-started their economy by reforming their generous welfare state despite the generally reform-stifling constraints of consensus politics. The “Dutch miracle” was helped by cross-party agreement of a generally positive nature.‟
It seems a rather flattering comment that is largely true. In 1997, the Dutch model was even awarded a prize of DM 300,000 by the Carl Bertelsmann Foundation. The president of the biggest federation of trade
unions, Mr. Lodewijk de Waal, and his counterpart at the employers‟ side, Mr. Hans Blankert, received
the prize on September 19, 1997. Obviously, the Dutch model is considered a success and seems to be admired by some observers. Another dimension of the Dutch model was stressed by The Economist of October 12, 1996:
„One quality that suffuses Dutch political and social mores is the notion of gedogen, a
nigh-untranslatable term that means looking the other way when you must. It seems to feed a
na-tional need to compromise at all costs. It is often translated as “tolerance”, but could also
come to mean something pretty close to sogginess, fudge or even hypocrisy.‟
Though less flattering, this statement also seems fairly realistic. The observation in The Economist
of a national need to compromise at all costs seems fairly telling. Consensus and consultation are key words in any characterization of the Dutch society. As Van der Ploeg (1998, p. 74) observes, the Dutch love to have meetings about everything and nothing. Sitting around the table seems a collective social ha-bit and a quintessential feature of the consensus society. The point is that everybody can participate, have their say and feel part of the decision making process. Consensus thus seems to be an essential part of the Dutch mentality.
Another aspect that for a long time has been characteristic for the Dutch society is pillarization (Lijphart, 1968). This was a kind of social apartheid dividing the population in subcultures (pillars). It is not unusual to assume that there were four pillars (a catholic, a protestant, a socialist, and a conservative pillar), though there is no unanimous agreement about the number of pillars.2. In the pillarized society the masses were segmented, but the elites closely cooperated on the national level. As a result, the policy making process could be characterized as functional decentralization giving considerable room to pilla-rized interest groups. Political leaders usually sought the best compromise possible, an elite style that
Lij-phart calls a „consensus democracy‟.
In the late 1960s, however, a process of depillarization began (Andeweg and Irwin, 1993, pp. 44-49). This may have been triggered by the results of the general elections of 1967, when 15 (of the 150) seats in parliament unexpectedly changed political hands. In both the 1971 and 1972 elections this num-ber rose to a record 20, earthshaking by Dutch standards. Though increased electoral volatility is just one indicator, it illustrates the process as such. It may be questioned whether or not the consequences of pilla-rization have been overemphasized in the past. More important may have been the minority position of all the subcultures providing for a crucial incentive for the elites to cooperate rather than compete. Until to date all political parties are still far removed from a parliamentary majority. The Netherlands continues to be a country of minorities, which may be a main reason that consensus seems so engrained in the Dutch political culture.
The remainder of this paper is organized as follows. Section 2 describes the oscillation from con-sensus to polarization and vice versa that can be observed in the Netherlands from the 1970s through the 1980s. Section 3 analyses the policy that led from the Dutch disease in the 1970s to the Dutch miracle in
1
The country is often referred to as Holland, not only by the weekly The Economist - that calls itself a newspaper - but also by Dutch nationals. This may be confusing, however, because the name Holland actually refers to the prov-inces North-Holland and South-Holland located in the western part of the country.
2
the 1990s. Section 4 deals in more detail with the phenomenon of economic inactivity. Finally, section 5 presents some concluding remarks.
From consensus to polarization to consensus
In many areas an oscillation can be observed, including fashion, politics, and economics. Even the degree of consensus seeking, though a basic feature of Dutch society, seems subject to oscillation. The first decades of the post-war period the will to seek consensus was very strong in the Netherlands as a re-sult of the devastating effects of World War II. There was an obvious need to rebuild and reconstruct the
country‟s industry and infrastructure. In the early 1970s, however, the pendulum started to move into the
other direction. Consensus began to erode (Albeda, 1982, p. 170) and polarization became a key word in Dutch politics. This may have to do with the increased electoral volatility, but also with the economic stagnation following the first oil crisis of 1973.
In 1973, five parties formed a cabinet led by the socialist Prime Minister Den Uyl. The formation of this cabinet took five and a half months, which is exceptionally long, even to the Dutch standard.3 This
cabinet adopted as its device „spreading of knowledge, income, and power‟. Political parties and their
leaders stressed political differences more than before, thereby giving rise to polarization in Dutch politics. This was not limited to the political arena, but could also be observed in the relationship between the so-cial partners. In the 1960s, the number of working days lost by labor unrest amounted to 69,000 per year, whereas in the 1970s this number rose to 170,000 per year (Central Bureau of Statistics, 1994, p. 214). In the early 1980s, however, the pendulum began again to move into the reverse direction and the Dutch so-cioeconomic system returned to its tradition of consensus seeking. In the 1980s, the number of working days lost by labor conflicts was even somewhat lower than in the 1960s: 66,000 per year.
Retrospectively, the cabinet-Den Uyl (1973-1977) - a center-left coalition - can be considered a tran-sition cabinet (Van der Hoek, 1999). Starting as a keynesian oriented cabinet, it attempted to cope with the diminishing economic growth by expanding the public sector, resulting in an increasing budget deficit and a rising tax burden. However, during its term non-keynesian insights began to influence policy makers, while
the break in policy makers‟ line of thinking was completed over the term of its successor, the cabinet-Van
Agt I (1977-1981), a center-right coalition. This cabinet explicitly gave up keynesian oriented
politico-economic concepts. As a result, keynesian concepts such as „overspending‟ and „cyclical injections‟ were
replaced with neoclassical concepts such as „real wage cost moderation‟ and „production cost‟.
After policy makers had adopted the (neoclassical) vintage approach (Den Hartog and Tjan, 1974) in the late 1970s, more attention was paid to the development of the labor income share in the value added produced in the private sector (Van der Hoek, 1999, p. 1118). The deteriorating employment situation in the early 1980s forced both the government and the social partners to give a higher priority to an employment policy. On November 24, 1982, the social partners reached an agreement in the Foundation of Labor, a private body for talks between employers‟ organizations and trade unions. This agreement is usually referred to as the Wassenaar agreement after the place where it was reached. Though the body of the agreement entitled
Central recommendations concerning aspects of an employment policy did not take up more than one page, it was of historic significance and it marked a turning-point in Dutch industrial relations. Govern-ment interference with wage formation came to an end and a trend towards decentralization in wage bar-gaining emerged.
The agreement expressed that a recuperation of economic growth, a stable price level,
strengthen-ing enterprises‟ competitive edge, and improvstrengthen-ing companies‟ profits were crucial to a structural improv
e-ment of employe-ment. In addition, the agreee-ment called on governe-ment to make it possible to social part-ners to freely negotiate collective wage agreements on the basis of the central recommendations. Essen-tially, the trade unions committed themselves to wage moderation, while the employers‟ organizations accepted shortening of working hours and redistribution of labor.
3
The government responded positively to the agreement by slimming the social security system and retrenching4 public expenditure, thereby enabling a reduction of the tax burden. Gross salaries of public sector workers were cut by 3% in 1984 and subsequently frozen for a number of years. The minimum wage for adults was cut by 3% in 1984 followed by freezes, while the minimum wages for youths were already reduced twice by about 10% each time. Social benefits were cut, while eligibility requirements were tightened. By shortening the period in which unemployment compensation was paid the incentive for unemployed to find a job was reinforced. Three consecutive cabinets pursued this policy of retrenchment and slimming the welfare state during the 1980s and early 1990s. The first two of these cabinets were cen-ter-right coalitions, whereas the third cabinet was a center-left coalition. The fact that by and large politi-cally differently composed cabinets pursued a policy that was basipoliti-cally the same stresses the consensus seeking nature of Dutch politics.
In addition to the Foundation of Labor another institution plays an important role in the Dutch so-cioeconomic system: the Social Economic Council (SEC). Whereas the Foundation of Labor is a private
body of employers‟ and employees‟ organizations, the SEC is a broader public institution established by
public law. It is composed of 33 members: 1/3 of them are representatives of employers‟ organizations,
1/3 are representatives of employees‟ organizations, and 1/3 are independent experts („crown‟ members). The SEC serves as an advisor to the government and offers an opportunity to employers‟ organizations, trade unions and government officials to meet and to consult together. Until 1995, it was mandatory to the government to ask the SEC for advice about its planned policies and measures. Even though this statutory obligation was abolished in 1995, the SEC still is the heart of the consult economy where all important parties meet, discuss compromises, and build consensus.
Three tracks
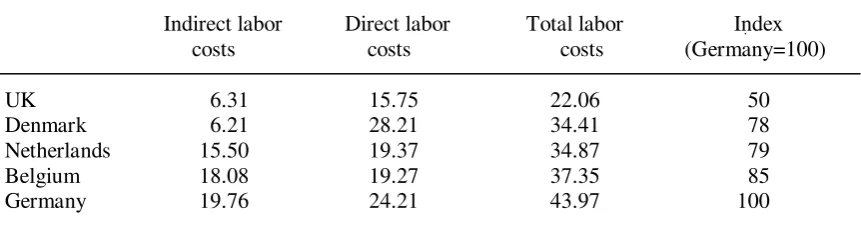
[image:5.595.60.499.511.588.2]The policy that has led from the Dutch disease to the Dutch miracle consists of three tracks: 1) wage moderation, 2) retrenching public expenditure and reducing the tax burden, 3) slimming the welfare system. With wage moderation I mean wage rises that lag behind those in neighboring countries. In the 1980s and early 1990s, the increase of labor costs per hour worked was lower in the Netherlands com-pared to most neighboring countries, as Table 2 displays. After this long period of wage moderation, the level of labor costs in the Netherlands appears to be middle of the road compared to neighboring countries (see Table 3). In 1994, it was lower than in Germany, comparable to that in Belgium and Denmark and considerably higher than in Britain.
Table 2. Proportional change of labor costs (in DM) per hour worked in manufacturing industry, 1980-1994.
Netherlands 57.5
Belgium 59.2
Denmark 68.4
United Kingdom 83.1
Germany 102.4
Source: Link, 1995, p. 7 (as cited in Ministry of Social Affairs and Employment, 1996, p. 2.3)
Not only total labor costs, but also labor productivity is relevant, since together they determine unit wage costs. In the 1980s and early 1990s, labor productivity growth in the Netherlands was more or less middle of the road, as Table 4 shows. The developments of wage costs and labor productivity r esulted in unit labor costs that were relatively low in 1994, as displayed by Table 5. Though they were comparable to unit labor costs in Belgium and Denmark, they were markedly lower than in Germany and Britain. Inter-esting is the position of the UK. Though labor costs in Britain are low relative to other European countries, labor productivity is also low and is not fully compensated for by the low labor costs. That is the reason
4
why unit labor costs are relatively high in the UK. Table 6 shows relative unit labor costs with 1995 as the base year. In Germany, unit labor costs fell after 1995, but they still exceed the 1981 level. In recent years, unit labor costs also decreased in the Netherlands and Belgium, but to a level below that of 1981. In Den-mark, they increased slightly in recent years, but in the UK they rose very rapidly and approached the 1981 level.
Table 3. Level of labor costs (in DM) per hour worked in manufacturing industry, 1994.
Indirect labor Direct labor Total labor Index costs costs costs (Germany=100)
UK 6.31 15.75 22.06 50
Denmark 6.21 28.21 34.41 78 Netherlands 15.50 19.37 34.87 79 Belgium 18.08 19.27 37.35 85 Germany 19.76 24.21 43.97 100
[image:6.595.59.356.334.438.2]Source: Schröder, 1995, p. 49 (as cited in Ministry of Social Affairs and Employment, 1996, p. 2.4).
Table 4. Labor productivity in the business sector.
1973-79 1979-89 1989-1996a
Denmark 2.3 1.5 2.9 Belgium 2.7 2.3 1.6 Netherlands 2.6 1.7 1.5
UK 1.6 2.2 1.2
Germany 3.1 1.6 0.1
a. 1994 for Germany and 1995 for the UK. Source: OECD, 1998d, p. 94.
Table 5. Unit labor costs, 1994.
Netherlands 89
Belgium 90
Denmark 93
Germany 100
United Kingdom 106
[image:6.595.59.274.650.753.2]Source: Link, 1995, p. 13 (as cited in Ministry of Social Affairs and Employment, 1996, p. 2.4).
Table 6. Relative unit labor costs (1995=100).
1981 1998
United Kingdom 143 142
Germany 68 89
Netherlands 111 95 Belgium 110 93 Denmark 75 102
The second track of the Dutch model is retrenching public expenditure and reducing the tax bur-den. With respect to the development of the total tax burden the Netherlands stands apart from neighbor-ing countries, as Table 7 displays. It is the only country of those included in the table where the total tax burden was reduced somewhat in the period 1980-1996. The burden was stable in Germany and increased in Belgium, Denmark, and the UK. In the Netherlands, the total tax burden is now lower than in Belgium and Denmark, but it still well exceeds the burden in the UK and Germany.5
Table 7. Total tax revenues as percentage of GDP.
1980 1996
United Kingdom 35 36
Germany 38 38
Netherlands 45 43
Belgium 44 46
Denmark 46 52
[image:7.595.58.383.347.475.2]Source: OECD, 1998c, pp. 78-79.
Table 8. General government total outlays and financial balances (as a percentage of GDP).
Total outlays Financial balances
1980 1998 1980 1998
United Kingdom 43 40 -3.4 -0.4 Germany 48 47 -2.9 -2.0 Netherlands 56 47 -4.3 -0.7 Belgium 58 51 -8.9 -1.3 Denmark 56 55 -3.3 +1.2
Source: OECD, 1996b, pp. A31 and A33; OECD, 1999, pp. 252 and 254.
Table 8 shows the development of general government total outlays and financial balances. Though general government total outlays in the European Union slightly increased from 45% in 1980 to 46% in 1998, they decreased in all countries included in Table 8. Most pronounced are developments with regard to financial balances. The desire to join Economic and Monetary Union has led to more financial discipline with EU member states (Van der Hoek, 1998). In the Netherlands, for example, the public defi-cit decreased to 0.7% from 4.3% of GDP. In Denmark there was even a surplus in 1998.
The third track, slimming the social security system, is closely related to the second. Table 9 dis-plays the gross outlays for social protection relative to GDP. With the exception of Germany the share of gross outlays in GDP has increased in all countries included in the table, which is in line with the devel-opment in the European Union (the EU-average increased to 28% from 24%).
5
Table 9. Gross outlays for social protection as percentage of GDP.
1980 1995
Denmark 29 34
Netherlands 30 31
Belgium 28 30
Germany 29 29a
United Kingdom 22 28
a. 1994
Source: Ministry of Social Affairs and Employment, 1998, p. 102.
Economic inactivity
The Dutch economy seems to perform well relative to neighboring countries. This is in particular true with regard to total wage costs and unit labor cost (since the growth of labor productivity is middle of the road). Developments in the field of public finance have also been favorable in recent years. Although the tax burden has been high, it was reduced in the 1990s. The same can be observed pertaining to public expenditure and the budget deficit. The reduction of the minimum wage and the subsequent freezes may have increased employment of low-productive workers (Central Planning Bureau, 1998, p. 49). However, public spending on social protection has not been reduced and the share of GDP spent on social protection is in line with levels in neighboring countries. This raises the question why unemployment in the Nether-lands is so much lower than in other EU countries. Another reason to have a closer look at the unemploy-ment rate is that those who speak about the Dutch model usually seem to focus on the unemployunemploy-ment rate. Unemployment cannot be considered apart from the social protection system at large. It is part of total economic inactivity. The inactivity/activity ratio (I/A-ratio) represents the arithmetical relationship between economically inactive persons receiving a social security benefit and economically active – i.e., working – individuals. Table 10 shows ratios for several countries both in 1980 and in 1992. The I/A-ratio appears to be relatively high in Belgium both in 1980 and 1992. The British I/A-ratio was relatively low in 1980, but has increased relative to other countries. Though the Dutch I/A-ratio was on the low scale, it did not significantly differ from that in Denmark, Germany, and the UK. As Table 11 displays, this picture is confirmed by data about non-employment rates for working-age individuals (OECD, 1998b, pp. 9-11).
Table 10. I/A-ratios.
1980 1996
Denmark 0.72 0.80 United Kingdom 0.62 0.83 Netherlands 0.67 0.79 Germany 0.72 0.81 Belgium 0.80 1.11
Sources: De Voogd, et al., 1996, p. v; Ministry of Social Affairs and Employment, 1998, p. 102.
[image:8.595.59.304.523.627.2]register as unemployed, those taking a course (and, thus, cannot accept a job within two weeks), those who are exempt from the obligation to actively apply for a job such as individuals over 57.5 years old and lone parents with children younger than 5 years old (Social and Cultural Planning Bureau, 1998a, p. 66).
Table 11. Non-employment rates for working-age individuals, 1996.
Netherlands 35
Belgium 44
Germany 36
United Kingdom 31
Source: OECD, 1998b, p. 9-11.
Definitions can be changed over time, however. In 1998, for example, the Central Bureau of Sta-tistics announced that for the first time since 1981 the number of unemployed had fallen to a level below 300,000 (Central Bureau of Statistics, 1998). However, the lowest number of registered unemployed in 1981 totaled well over 300,000. That was in April 1981 when the number of registered unemployed amounted to 334,000 (Central Bureau of Statistics, 1981, p. 27). Since then, the definition of registered unemployment has been altered twice. In particular the definition change of 1988 significantly diminished the number of (registered) unemployed: to 433,000 from 686,000 (Central Bureau of Statistics, 1988, p.
168 and 1990, p. 22). The definition‟s significance is most obvious if the number of registered une m-ployed is compared with the number of people receiving unemployment benefits. In 1995, the number of registered unemployed amounted to 464,000, whereas 784,000 individuals received unemployment com-pensation (Kartopawiro, 1997, p. 27). It seems not unjustified to state that a considerable part of unem-ployment has been defined away.
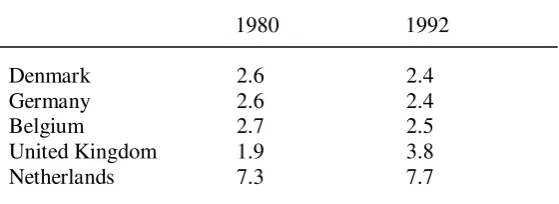
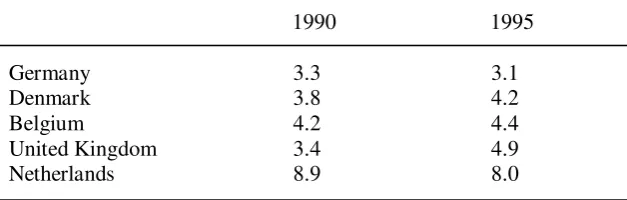
It would go too far, however, to conclude that the relatively low unemployment rate in the Nether-lands is merely the result of a particular definition. Given that the level of social expenditure in the Neth-erlands does not fundamentally differ from that in neighboring countries, it seems more plausible that in the Netherlands unemployment takes other forms and that open unemployment has been replaced with hidden unemployment. It seems that a considerable number of those listed as disabled should more proper-ly be listed as unemployed. Table 12 shows that in 1980 and in 1992 the Netherlands spent 2-3 times more on disability than neighboring countries in terms of GDP. This is confirmed by data on the incidence of disability (the number of disabled as a percentage of the labor force). In 1990 and 1995, it was over 2.5 times higher in the Netherlands relative to neighboring countries, as Table 13 displays. There is no reason, however, to assume that the Dutch are significantly less healthy than people in Belgium, Germany, Den-mark, or the UK. It seems a logical conclusion, therefore, that the disability scheme in the Netherlands contains a considerable component of hidden unemployment.
Table 12. Outlays on disability benefits as percentage of GDP.
1980 1992
Denmark 2.6 2.4 Germany 2.6 2.4 Belgium 2.7 2.5 United Kingdom 1.9 3.8 Netherlands 7.3 7.7
[image:9.595.58.338.575.677.2]Table 13. Incidence of disability (as a percentage of the labor force).
1990 1995
Germany 3.3 3.1
Denmark 3.8 4.2
Belgium 4.2 4.4
United Kingdom 3.4 4.9 Netherlands 8.9 8.0
Source: Ministry of Social Affairs and Employment, 1998, p. 103.
As early as in the late 1970s attempts were made to explain the growth of the number of disable-ment beneficiaries by linking it to the demand for labor and the relative level of unemploydisable-ment compensa-tion (Bax et al. 1979; Hilverink, 19816). Later estimates of the hidden unemployment component in the number of disabled persons vary greatly from 12 to 50% (OECD, 1991, p. 63-64). The Dutch Central Planning Bureau has referred to research by Prins (1990), who observes a difference in sociocultural
expe-rience compared to other countries: „in the Netherlands a sociocultural climate has developed in which it is
acceptable to stay away from work on account of vague physical and in particular psychological
com-plaints‟ (as cited in Central Planning Bureau, 1991, p. 22-23).
Clearly, the disability scheme has played a special role as a cushion for unemployment. Initial pol-icy responses consisted of cuts in the rate of benefits from 80 to 70% of the last earned wage followed by a freeze on nominal benefits from 1984 to 1990. Further measures were taken in the early 1990s, while simultaneously a parliamentary inquiry into the administration of the social security system was carried out (Tweede Kamer, 1993). The latter triggered a most significant redefinition of disability. Until 1993,
the degree of disability was determined on the basis of the concept of „suitable‟ work, i.e., what a person
was still capable of earning in his or her previous function or in an equivalent job. From August 1993, however, the assessment is based on the concept of „acceptable‟ work and the degree of disability now depends on the maximum income someone is still capable of earning, regardless of his or her former func-tion or educafunc-tion. Beneficiaries already in the disability scheme have been re-examined on the basis of the new definition with quite impressive results. Over 50,000 persons were re-examined in 1994 and nearly 40,000 in 1995, with a reduction or withdrawal of benefits in 52 and 35% of cases, respectively (OECD, 1998a, p. 85). Thus, the measures to reduce the number of disablement beneficiaries have not been unsuc-cessful. From 1997, however, a renewed increase7 occurred (College toezicht sociale verzekeringen, 1998), while a continued rise has been projected from 1998 through 2002 (Ministry of Social Affairs and Employment, 1998, p. 152).
In 1996, the OECD introduced the concept of „broad unemployment‟ including all unemployed
and inactive persons of working age receiving a social security benefit and persons enrolled in special job creation programs (OECD, 1996a, p. 46). While registered unemployment amounted to less than 6%
(440,000 persons) in 1996, „broad unemployment‟ was calculated at 24% (over 2 million persons). The
definition of broad unemployment is not less questionable, however, than the definition of registered un-employment. A large part of those registered as disabled are physically unable to work. And though subsi-dized jobs can be seen as an artificial way of reducing unemployment, those in subsisubsi-dized jobs do work and cannot be considered unemployed. On the other hand, the broad unemployment concept does not cov-er discouraged workcov-ers. They are mainly women who do not receive unemployment compensation and have not registered at the employment service, but do look for a job (Social and Cultural Planning Bureau, 1998b, p. 383).
6
Hilverink's paper was originally published in 1978 in Tijdschrift Sociale Geneeskunde.
7
Concluding remarks
The answer to the question „Does the Dutch model really exist?‟ seems to be affirmative, at least
in a specific sense. Although most observers point to the low unemployment rate, this is misleading. Open unemployment has partly been replaced with hidden unemployment, mainly in the form of disablement. The way the social partners operate and cooperate and consult together with the government seems crucial to the Dutch model. A key word is consensus, which seems to be related to the Dutch mentality. There-fore, the Dutch model seems not only unique, but may have more to do with sociology than with econom-ics. The way employer's organizations and trade unions deal with one another furthers consensus. The in-stitutional structure also fosters the consensus seeking character of the Dutch model. Institutions such as the Social-Economic Council and the Foundation of Labor offer platforms where representatives of
em-ployers‟ and employees‟ organizations can meet and consult together. Frequent and informal contacts b
e-tween these representatives seem quintessential to the Dutch model.
The policy that has led from the Dutch disease to the Dutch miracle consists of three tracks: 1) wage moderation, 2) retrenching public expenditure and reducing the tax burden, 3) slimming the welfare system. The wage moderation track seems to have been the most important one. Most interesting is that this track is the result of an agreement between the social partners rather than a form of government poli-cy. From this point of view the Carl Bertelsmann Foundation was quite right by awarding a prize to the social partners. Nonetheless, the government did play an important role by consulting with the social part-ners and pursuing a policy enabling them to continue the Wassenaar agreement. But it has primarily been the wage moderation that helped to cure the Dutch disease. Recently, the OECD (1998a, p. 41) also rec-ognized the crucial role of wage moderation:
„All considered, the “wage moderation for jobs” approach pioneered in the Wassenaar agreement may have been the single most important element of the “Dutch model”.‟
The recovery of the economy has also benefited the public sector since it increased tax receipts. Reducing tax rates seems to have been a profitable investment. In the 1990s, real GDP growth in the Netherlands has exceeded the average GDP growth in the EU.
It seems that the Dutch model consists of both social and economic components. The way social partners consult and negotiate seems a crucial element as voiced in The Wall Street Journal Europe of October 21, 1997:
„… the Dutch success story is built on a form of national consensus so rare that it would
be nearly impossible to replicate elsewhere.‟
In addition, there is another reason why the Dutch model cannot be replicated elsewhere. Normally, the combination of wage moderation and low inflation would have led to a revaluation of the Dutch guilder. The Dutch government, however, has pegged the guilder to the Deutsche mark from 1983. As a result, persistent surpluses on the current account of the balance of payments have occurred. From 1981 the Netherlands did not have a trade deficit in any single year. If the Netherlands were a large country this would most likely have evoked quite a lot of criticism. Other countries may have accused the Netherlands
of pursuing a „beggar-my-neighbor‟ policy, even though it did not devalue its currency.
References
Adema, W. „What Do Countries Really Spend on Social Policies? A Comparative Note‟, OECD
Eco-nomic Studies, No. 28, 1997, pp. 153-167.
Adema, W., Einerhand, M., Eklind, B., Lotz, J., and Pearson, M. Net Public Social Expenditure, Labour Market and Social Policy Occasional Papers No. 19, Paris: OECD, 1996.
Albeda, W. „Decision making in the Welfare State‟, in: Social-Economic Council, Socio-Economic
Pol-icy-making in The Netherlands and The United States of America, The Hague: SER, 1982. Andeweg, R.B., and Irwin, G.A. Dutch Government and Politics, Basingstoke: MacMillan, 1993.
Bax, E.H., De Boer, T.W., and Sterrenburg, K. „Arbeidsmarkt en arbeidsongeschiktheid: de toetsing van een hypothese‟, Economisch Statistische Berichten, Vol. 64, No. 3208, . 1979, pp. 580-586.
Central Planning Bureau. Centraal Economisch Plan 1990, The Hague: SDU Uitgeverij, 1990. _____ . Centraal Economisch Plan 1991, The Hague: SDU Uitgeverij, 1991.
_____ . Recent Trends in Dutch Labor Productivity: the Role of Changes in the Composition of Employ-ment, Working Paper No. 98, The Hague: CPB, 1998.
Central Bureau of Statistics. Sociale Maandstatistiek, Vol. 29, No. 12, 1981. _____ . Statistisch Zakboek 1988, The Hague: Staatsuitgeverij, 1988. _____ . Statistisch Zakboek 1990, The Hague: SDU-uitgeverij, 1990.
_____ . Vijfennegentig jaren statistiek in tijdreeksen 1899-1994, The Hague: SDU/Uitgeverij, 1994.
_____ . „Minder dan 300 duizend geregistreerde werklozen‟, Sociaal-Economische Maandstatistiek, Vol.
15, No. 7, 1998, p. 11.
College toezicht sociale verzekeringen. Augustusrapportage arbeidsongeschiktheidsverzekeringen 1998, Zoetermeer: Ctsv, 1998.
Den Hartog, H. and Tjan, H.S. Investeringen, lonen, prijzen en arbeidsplaatsen, Occasional Paper, No. 8, The Hague: CPB, 1974.
De Voogd, J., „t Hoen, N.B.J.G., Arents, M., and Booij, J.T. Inactivity/Activity ratios, The Hague: VUGA,
1996.
Einerhand, M., Kerklaan, M., Metz, H., Siegelaar, E., and Vliegenthart, M. Sociale zekerheid: stelsels en regelingen in enkele Europese landen, The Hague: VUGA, 1995.
Hilverink, H.G. „Arbeidsongeschikt of arbeid ongeschikt?‟, in: Van den Bosch, F.A.J. and Petersen, C.,
(eds), Arbeidsongeschiktheid. Een multidisciplinaire benadering, Deventer: Kluwer, 1991, pp. 63-75.
Kartopawiro, J.D. „Geregistreerde werkloosheid en werkloosheidsuitkeringen 1993-1995: een onderzoek
naar het verschil in ontwikkeling‟, Sociaal-Economische Maandstatistiek, Vol. 14, No. 10, 1997, pp.
22-27.
Kruyt, J.P. Verzuiling, Zaandijk: Heijnis, 1959.
Lijphart, A. The Politics of Accommodation: Pluralism and Democracy in the Netherlands, Berkeley: University of California Press, 1968.
Link, F.J. „Konjunkturschlaglicht. Produktivität und Lohnstuckkosten im internationalen vergleich‟, IW
-Trends, Quartalhefte zur empirischen wirtschaftforschung, Vol. 2, No. 22, 1995, Köln: Institut der Deutschen Wirtschaft.
Maas, P.F. Kabinetsformaties 1959-1973, The Hague: Staatsuitgeverij, 1982.
Ministry of Social Affairs and Employment. De Nederlandse Verzorgingsstaat in internationaal perspec-tief, The Hague: Ministry of Social Affairs and Employment, 1996.
_____ . Sociale Nota 1999, Tweede Kamer (Parliamentary Papers), Vergaderjaar 1998-1999, 26,202, No. 2, 1998.
OECD. OECD Economic Surveys: Netherlands, Paris: OECD, 1991.
_____ . OECD Economic Surveys 1995-1996: Netherlands, Paris: OECD, 1996a. _____ . OECD Economic Outlook 60, Paris: OECD, 1996b.
_____ . OECD Economic Surveys 1997-1998: Netherlands, Paris: OECD, 1998a. _____ . Employment Outlook, Paris: OECD, 1998b.
_____ . Revenue Statistics 1965-1997, Paris: OECD, 1998c.
_____ . Science, Technology and Industry Outlook 1998, Paris: OECD, 1998d. _____ . OECD Economic Outlook 65, Paris: OECD, 1999.
Schröder, C. „Dokumentation. Industrielle arbeitskosten im internationalen vergleich 1970-1994‟, IW -Trends, Quartalhefte zur empirischen wirtschaftforschung, Vol. 2, No. 22, 1995, Köln: Institut der Deutschen Wirtschaft.
Social and Cultural Planning Bureau. Sociale en Culturele Verkenningen 1998, Rijswijk: SCP, 1998a. _____ . Sociaal en Cultureel Rapport 1998, Rijswijk: SCP, 1998b.
Tweede Kamer. Enquête naar het functioneren van de organen belast met de uitvoering van de sociale-verzekeringswetten, Vergaderjaar 1992-1993, 22,730, No. 7, 1993.
Van Duijn, J.J. „Near the End of the Downswing - Approaching the Beginning of a New Upswing‟, in:
Muller, F. and Zwezerijnen, W.J. (eds), The Role of Economic Policy in Society, The Hague: Universi-taire Pers Rotterdam, 1989, pp. 224-241.
Van der Hoek, M.P. „Managing the Budget: The Dutch Experience,‟ Public Budgeting and Financial
Management, Vol. 3, No. 2, 1991, pp. 399-417.
_____ . „From Nation to State: A Difficult Process‟, Public Administration and Management, Vol. 3, No.
4, 1998 [http://www.hbg.psu.edu/Faculty/jxr11].
_____ . „Income Distribution Policy in the Netherlands: A Paradigm Shift,‟ International Journal of Public
Administration, Vol. 22, No. 7, 1999, pp. 1115-1136.