Harris Operator Corner Detection using Sliding
Window Method
Jyoti Malik
National Institute of Technology, Kurukshetra
Ratna Dahiya
National Institute of Technology, Kurukshetra
G. Sainarayanan
New Horizon College of Engineering, Bangalore
ABSTRACT
In this paper, Harris Corner Detector is proposed as a corner detection technique to extract palmprint features in the form of corners. Here, hamming distance similarity measurement using sliding window method is used as a feature matching method for the corners detected. The aim of using hamming distance method for corner matching is the non-dependency of the method with the number of corners detected. So, the comparison (matching) time will be constant with hamming distance feature matching method. We used the same feature matching technique in edge detection and got good results. In this paper, palmprint features are analyzed on different sigma, threshold and radius values. Experiments were developed on a database of 600 images from 100 individuals, with five image samples per individual for training and one image sample per individual for testing. The experimental results indicate that using Harris corner detector and Hamming distance using sliding window, recognition rate of 97.5% can be achieved.
Keywords
Palmprint, Feature extraction, Harris Corner Detector, Hamming distance.
1.
INTRODUCTION
Palmprint-based personal authentication has found applications in pattern recognition, image processing and computer vision. Palmprint is considered one of the most reliable biometric because of its unique features [1-4]. The unique and stable features mean that there is minimal possibility of two different individual to have same palmprint features and to get matched as genuine. The palmprint are easy to capture and do not change over time and with age.
Palmprint consists of five types of features. They are geometry features, line features, point features, texture features, statistical features and points [5-7]. In this paper, Harris Corner Detector is proposed to detect the corners. The Harris corner detector is based on the local auto-correlation function of a signal; where the local auto-correlation function measures the local changes of the signal with patches shifted by a small amount in different directions [8-14]. Hamming distance similarity measurement using sliding window method is used as feature matching method.
The following section of the paper is organized as follows: Section 2 describes the basic of palmprint authentication system. In section 3 feature extraction by Harris Corner Detector technique is proposed. Section 4 presents feature matching by Hamming distance similarity measurement method using sliding window. Section 5 represents the training and testing stage. The
experimental results are presented in Section 6, while section 7 concludes the paper.
2.
PALMPRINT
AUTHENTICATION
SYSTEM
In this paper, the palmprint authentication system is divided in following two subsystems:
(a) Pre- Authentication System (b) Authentication System
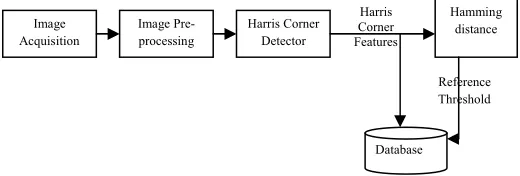
In Pre-authentication system, a database of harris corner features and reference threshold value is prepared. These values will be used in Authentication system as shown in Figure 1.
[image:1.612.323.583.400.488.2]In Authentication system, the authenticity of a person is identified with the help of Reference threshold value stored in database as shown in Figure 2.
Figure 1: Palmprint Pre-Authentication system
Figure 2: Palmprint Authentication System
Image Acquisition
Image Pre- processing
Harris Corner Detector
Hamming distance
Database
hreshold Reference Threshold Harris
Corner Features
Image Acquisition
Image Pre- processing
Harris Corner Detector
Hamming Distance
Reference Threshold Comparison
3.
FEATURE
EXTRACTION
USING
HARRIS CORNER DETECTOR
The ‘corner’ is defined as a location in the image where the local autocorrelation function has a distinct peak. Corner point detection has found its application in various computer vision tasks. Here, Harris corner detector is proposed to extract corner information for palmprint authentication.
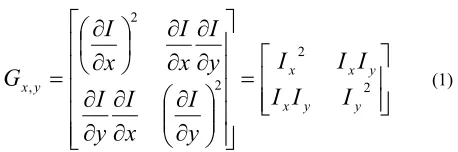
Harris Corner Detector is one of the promising tool to analyze the corner points.Harris Corner Detector is based on the autocorrelation of image intensity values or image gradient values. The gradient covariance matrix is given by:
=
∂
∂
∂
∂
∂
∂
∂
∂
∂
∂
∂
∂
=
2 2 2 2 , y y x y x x y xI
I
I
I
I
I
y
I
x
I
y
I
y
I
x
I
x
I
G
(1)where Ix and Iy denote the image gradients in the x and y
directions. Harris Corner Detector considers the minimum and maximum eigenvalues, α and β, of the image gradient covariance matrix Gx,y in developing corner detector. A ‘corner’
is said to occur when the two eigenvalues are large and similar in magnitude. Harris [11-12] devises a measure using the determinant and trace of the gradient covariance matrix as:
(
)
2(
( )
)
2det
G
k
Trace
G
k
R
=
αβ
−
α
+
β
=
−
(with[
0
.
04
,
0
.
06
]
∈
k
) (2)On the basis of R the pixels are classified as follows:
0
>
R
: Corner pixel,R
~
0
: pixel in flat region,R
<
0
: edge pixel. (3) [image:2.612.54.283.211.287.2]Palmprint Image with Corners
Figure 3: Corner detection by Harris corner detector on palmprint image, ‘+’ defines the corners detected.
The feature vector consists of palmprint features or corners detected.
FV = Palmprint features (PF) (4)
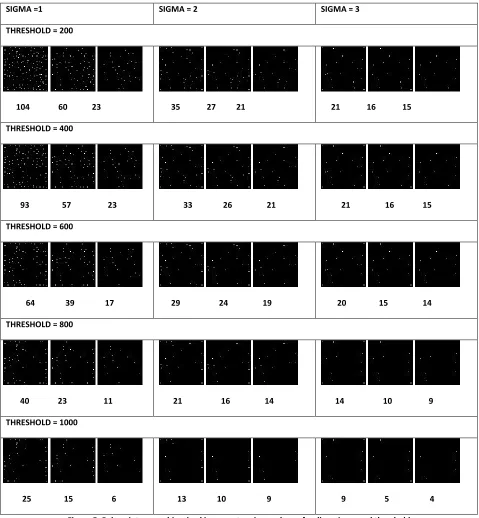
The corner features extracted by Harris corner detector method are analyzed on different values of sigma, threshold and radius. The number of corners detected varies with varying values of sigma, threshold and radius as shown in Fig. 4 and binarized corner information is shown in Fig. 5(in the end of paper).
4.
HAMMING DISTANCE SIMILARITY
MEASUREMENT USING SLIDING
WINDOW METHOD
In this paper, a new corner matching technique using hamming distance similarity measurement is proposed. We have matched palmprint line feature vectors by Hamming distance similarity measurement method and got good results in edge detection method. Here, hamming distance method is used on palmprint corner features that work on binary feature vectors. The corner information (Palmprint features) extracted is binarized by the following equation (5):
( )
( )
( )
≤
>
=
0
,
,
0
0
,
,
1
,
j
i
PF
j
i
PF
j
i
PF
(5)where,
PF
( )
i
,
j
= Palmprint features, i and j are the rows and columns of the Palmprint features.The hamming distance similarity measurement using XOR operation between two binary feature vectors can be defined as:
( )
( )
(
)
∑∑
⊕
=
64 64,
,
i j
DB
i
j
FV
j
i
FV
HD
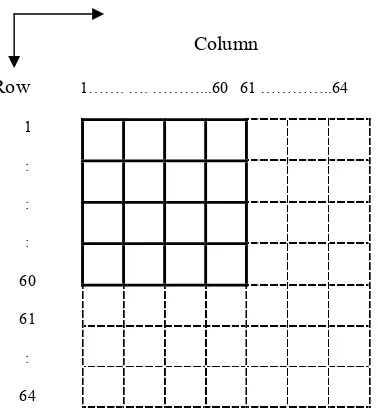
(6)Sliding window technique is used to avoid false rejection because of displaced ROI. Suppose, if the ROI is displaced by two rows, there are chances of the ROI not getting matched with the same ROI present in the database because of displacement in the rows. Here, to overcome the displacement problem, sliding window method with reduced ROI by some window size WS is used. For window size WS, ROI area of (64–WS)×(64–WS) pixels out of 64×64 pixels slides over the rows and columns using Hamming distance matching and minimum of the value is considered. Fig. 6 shows the sliding window method used to find the hamming distance.
The hamming distance value with window size WS is defined as:
( )
( )
(
)
∑ ∑
− −⊕
=
WS i WS j DBWS
FV
i
j
FV
i
j
HD
64 64
,
,
(7)where HDWS denotes the hamming distance with window size
WS, i and j is the row and column of the Palmprint feature vector, ⊕ is the exclusive OR operation, WS denotes the window size, FVDB denotes the feature vector in database. For window
size WS (4), there will be WS×WS (4×4 = 16) hamming distance values. The minimum value out of 16 values of hamming distances is chosen as hamming distance.
(
1,
2,
3,...
16)
min
HD
HD
HD
HD
HD
=
(8)where, HD denotes the hamming distance value.
Column
[image:3.612.58.247.56.261.2]Row 1……. …. ………...60 61 …………..64 1 : : : 60 61 : 64
Figure 6: Sliding Window Approach with window size 4 and palmprint size 64×64
Hamming Distance value “1” signifies both feature vectors are exactly same and a value near to “1” is identified as reference threshold. If matching score (or Hamming distance) of two feature vectors is less than reference threshold value, feature vectors are considered to be from same hands otherwise different hands. The accuracy of the biometric authentication can be defined by following equation (9):
(
)
(
100
(%)
(%)
/
2
)
(%)
FAR
FRR
Accuracy
=
−
+
(9)Where, FAR is False Acceptance Rate, FRR is False Rejection Rate. If either FAR or FRR is decreased, overall system accuracy is increased.
5.
TRAINING AND TESTING STAGE
The hand image samples are divided into two groups G1 (Training group) and G2 (Testing group).
G1 group
( )
[
1 2 1]
1
=
I
,
I
,...
I
M−P
,P
2=
[
I
1,
I
2,...
I
(M−1)]
,……..( )
[
1,
2,...
−1]
=
MN
I
I
I
P
(10)G2 group
[ ]
I
MP
1=
,P
2=
[ ]
I
M ,…….P
N=
[ ]
I
M (11)Where Pi denotes ith person in group G1, G2, Ij denotes the jth
palm image in group G1, G2.
As shown in table 1, for group G1, each hand feature vector in P1 is matched with all other (M-1) hands feature vector by
Hamming distance similarity measurement method. The matching values are stored in threshold array.
( ) ( ) ( )( )
=
− − − − − − 2 1 2 1 1 1 1 2 22 21 1 1 13 12 1.
,...
,
,..
,..
,
,
,..
,
M M M M M MHD
HD
HD
HD
HD
HD
HD
HD
HD
[image:3.612.319.564.157.337.2]TA
(12)Table.1: Matching in Group G1 among Person P1.
i j
1 2 3 M-1
1 X HD12 HD13 ……
…
HD1(M-1)
2 HD21 X HD23 ……
….
HD2(M-1)
: : : : : :
: : : : : :
M-1 HD(M-1)1 HD(M-1)2 HD(M-1)3 X
Similarly, all N hand image samples matching results are stored in Threshold array (TA).
N
A
TA
TA
TA
T
=
1+
2+
...
+
(13)The minimum and maximum of matching values are found out from the threshold array (TA1, TA2……..TAN) for each individual
as shown in equation (14).
( )
( )
Ai i N AiMAX Ai AiMINT
T
T
T
,.... 1max
min
=
=
=
(14)The accuracy of the system is identified by matching group G2
samples with group G1 samples using threshold values stored in
threshold array. Finally, a threshold value is chosen where FAR and FRR is minimum, this value is called Reference threshold.
[image:3.612.338.577.584.660.2]In palmprint authentication system, two palmprints are matched and the comparison of matching score values with reference threshold value defines the authenticity of the person. The authentication system is shown in Fig. 7.
6.
EXPERIMENTAL SETUP
A database of 600 palmprint images from 100 palms with 6 samples for each palm is taken from PolyU palmprint database [21]. The palmprint database is divided into two groups, first group (G1) consists of 100 persons with each person having 5
palm sample images to train the system, and second group (G2)
contains 100 persons with each person having one palm image different from the first group images. Second group is used as testing sample.
G1 group
[
1 2 3 4 5]
1
I
,
I
,
I
,
I
,
I
P
=
,[
1 2 3 4 5]
2
I
,
I
,
I
,
I
,
I
P
=
,…..P
100=
[
I
1,
I
2,
I
3,
I
4,
I
5]
In G1 group each hand Pi contains 5 sample image I1-5.
G2 group
[ ]
61
I
P
=
,P
2=
[ ]
I
6 ,……….P
100=
[ ]
I
6In G2 group each hand Pi contains only sample image I6.
Image is pre-processed to get the region of interest. Pre-processing includes image enhancement, image binarization, boundary extraction, cropping of palmprint/ROI. Feature extraction is done by Harris Corner Detector to get the corners from the palmprint image. The proposed feature extraction method is applied on the palmprint image to get Palmprint Corner features. Feature vector of all hand images samples is calculated and stored in database. Hamming distance similarity measurement method is used as a feature matching method.
6.1
Reference Threshold Calculation
In group G1, each hand feature vector in P1 is matched with all
[image:4.612.325.564.198.676.2]other 4 hands feature vector by Hamming distance similarity measurement method as shown in Fig. 8.
Figure 8: Matching of palmprints with each other
Similarly, all 100 hand image samples 2000 matching values are stored in Threshold array (TA).
100 2
1
TA
...
TA
TA
T
A=
+
+
+
( )
( )
1,....100max
min
=
=
=
i Ai AiMAX
Ai AiMIN
T
T
T
T
The maximum and minimum values are found out from
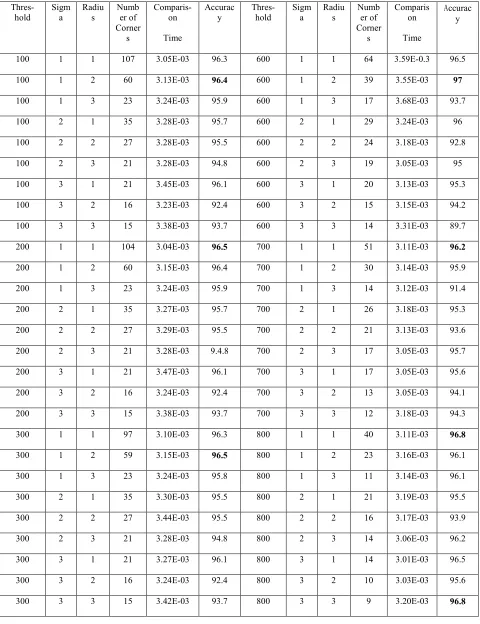
[image:4.612.319.562.218.423.2]where FAR and FRR values are minimum. The threshold, sigma, radius, number of corners, comparison time and accuracy are tabulated in table 2. From the table 2 (shown in the end of paper) it is clear that the comparison time is non-dependent on the number of corners detected. The maximum accuracy value is identified at threshold value 900, sigma value 3 and radius value 1. The respective reference threshold value, FAR and FRR are values are tabulated at maximum value of accuracy corresponding to threshold value 900, sigma value 3 and radius value 1 in table 3.
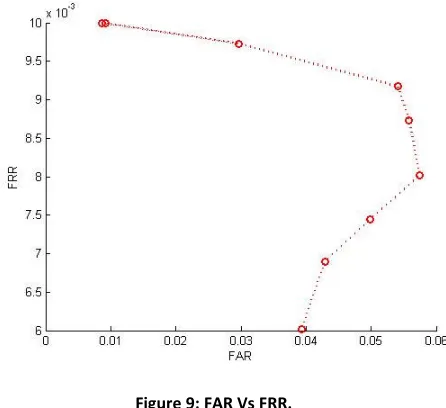
Table 3: Comparison of FAR and FRR with Accuracy at Window Size 2.
Reference Threshold FAR FRR Accuracy
9.81E-01 4.98E-02 7.45E-03 9.71E+01
9.83E-01 4.29E-02 6.90E-03 9.75E+01
9.85E-01 3.93E-02 6.02E-03 9.77E+01
9.87E-01 3.74E-02 4.66E-03 9.79E+01
9.89E-01 3.15E-02 4.08E-03 9.82E+01
9.91E-01 2.82E-02 3.04E-03 9.84E+01
9.93E-01 2.82E-02 3.04E-03 9.84E+01
9.95E-01 2.45E-02 2.44E-03 9.87E+01
9.97E-01 2.08E-02 2.23E-03 9.88E+01
[image:4.612.334.557.462.666.2]Plot of FAR and FRR values mentioned in table 3 is shown in Fig. 9.
Figure 9: FAR Vs FRR.
[image:4.612.55.289.491.550.2]Figure 10: Threshold Vs Accuracy.
6.2
Comparison
of
Hamming
distance
similarity measurement and Match by
Correlation
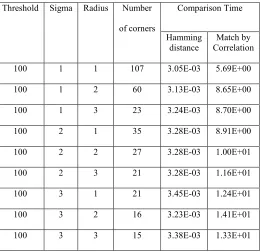
[image:5.612.342.537.171.495.2]As discussed earlier that hamming distance similarity measurement method is non-dependent on the number of corners detected, so the comparison time is constant. In case of Match by correlation method, comparison time depends on the number of corners detected. The number of corners detected is directly proportional to the time taken.
Table 4: Comparison of Matching Time with Hamming Distance and Match By Correlation Method
Threshold Sigma Radius Number of corners
Comparison Time
Hamming distance
Match by Correlation
100 1 1 107 3.05E-03 5.69E+00
100 1 2 60 3.13E-03 8.65E+00
100 1 3 23 3.24E-03 8.70E+00
100 2 1 35 3.28E-03 8.91E+00
100 2 2 27 3.28E-03 1.00E+01
100 2 3 21 3.28E-03 1.16E+01
100 3 1 21 3.45E-03 1.24E+01
100 3 2 16 3.23E-03 1.41E+01
100 3 3 15 3.38E-03 1.33E+01
Table 4 shows the comparison of matching time of hamming distance method and match by correlation method on harris corner operator for threshold value of 100 and various values of
sigma and radius is tabulated in table 4. It can be concluded from table IV that the harris corner method performs better with hamming distance method as hamming distance matching method involves EX-OR operation which is very fast operation. The values of parameters used in experimental results are shown in table 5.
Table 5: Summary of the Values Used for Experimental Results
Parameters Values Feature Extraction method Harris Corner Detector
Feature matching method Hamming distance
Min Threshold 9.75E-01
Max Threshold 9.89E-01
Reference Threshold 9.83E-01
Sliding window size 2
Sigma 3
Threshold 900
Radius 1
Comparison Time 3.12E-03
DB Preparation Time 2.87E-02
FAR 4.29E-02
FRR 6.90E-03
Accuracy 97.5
The combination of harris corner operator and hamming distance method makes the real time authentication system fast and accurate with less comparison time value and high recognition rate.
6.3
Methods Comparison
The comparison of different palmprint authentication methods is tabulated in table 6.
Table 6: Methods Comparison with Harris Corner Detector
Wang et al. [15]
Li et al. [16] Han et al. [17] Proposed Approach Size of
database
500 1380 50 100
Feature extraction
method
Fourier Transform
Directional line detector
Sobel & Morphological
[image:5.612.43.303.434.686.2] [image:5.612.321.562.610.718.2]Feature Matching
method
Distance formula
Palmprint Classification
Multi- template-matching
Hamming distance
Accuracy 95.48 96.03 91 97.5%
7.
CONCLUSION
In this paper, we have presented a promising approach of Harris corner detector for palmprint feature extraction. The corner information extracted using Harris corner detector is compared with other feature vector in the database using Hamming distance similarity measurement method using sliding window method. It is observed in the results that the sliding window method takes less time in matching the feature vectors as compared to match by correlation method. This shows that sliding window method does not depend on the number of corners detected. It can be concluded that feature matching by sliding window method has come out to be best method with high accuracy and less comparison (matching) time. Experimental results clearly show that Harris corner detector methodology has the ability to discriminate similar palmprints with recognition rate of 97.5%. The high accuracy and less comparison time make this system rapid, genuine and reliable authentication system.
8.
REFERENCES
[1] Jain A.K., Ross A., Prabhakar S.: ‘An introduction to biometric recognition’, IEEE Trans. Circuits Syst. Video Technol., 2004, 14, (1), pp. 4–20.
[2] P. Jonathon Phillips, Alvin Martin, C.L.Wilson, Mark Przybocki, “An Introduction to Evaluating Biometric Systems”, IEEE, Proceedings of Computer society, Feb. 2000.
[3] PavesˇIc´ N., Ribaric´ S., Ribaric ´ D.: ‘Personal authentication using hand-geometry and palmprint features – the state of the art’. Proc. Workshop: Biometrics – Challenges Arising from Theory to Practice, Cambridge, 2004, pp. 17–26
[4] Kumar and D. Zhang, “Combining fingerprint, palmprint and hand shape for user authentication,” In Proceedings of ICPR, vol.4, pp.549- 552.
[5] Kumar A., Zhang D.: ‘Personal authentication using multiple palmprint representation’, Pattern Recognit., 2005, 38, (10), pp. 1695–1704.
[6] Zhang D., Kong W.K., You J., and Wong M.: ‘Online palmprint identification’, IEEE Trans. Pattern Anal. Mach. Intell., 2003, 25, (9), pp. 1041–1050
[7] Wu X.Q., Wang K.Q., and Zhang D.: ‘Wavelet based palmprint recognition’. Proc. Int. Conf. Machine Learning and Cybernetics, Beijing, 2002, pp. 1253–1257
[8] Shaul R. Foguel, “A new approach to the study of Harris type Markov operators”, Rocky Mountain J. Math. Vol. 19, No. 2, 1989, pp 491-512.
[9] Weili Jiao, Yaling Fang, Guojin He, “An Integrated Feature Based Method For Sub-Pixel Image Matching”, The International Archives of the Photogrammetry, Remote Sensing and Spatial Information Sciences. Vol. XXXVII. Part B1. Beijing 2008.
[10] C. Harris and M.J. Stephens, “A combined corner and edge detector,” in 4th Alvey Vision Conference, Manchester, UK, 1988, pp. 147–151.
[11] Frank Nielsen, “Harris-Stephens' combined corner/edge detector”, September 2009.
[12] Niels Chr. Overgaard, “On a Modification to the Harris Corner Detector”, Proc of the Symposium Svenska Sällskapet för Bildanalys, 2003.
[13] Marr D., Hildreth E.C.: ‘Theory of edge detection’, Proc. R. Soc. Lond. B, 1980, 207, pp. 187–217
[14] CANNY J.F.: ‘A computational approach to edge detection’, IEEE Trans. Pattern Anal. Mach. Intell., 1986, 8, (6), pp. 112–131.
[15] W. Li, D. Zhang, and Z. Xu, “Palmprint Identification by Fourier Transform,” Int’l J. Pattern Recognition and Artificial Intelligence, vol. 16, no. 4, pp. 417-432, 2002. [16] Xiangqian Wu, David Zhang, Kuanquan Wang and Bo
Huang, “Palmprint classification using principal lines”, Pattern Recognition, vol. 37, issue 37, pp 1987-1998, 2004 [17] Chin-Chuan Han, Hsu-Liang Cheng, Chih-Lung Lin,
Kuo-Chin Fan, “Personal authentication using palm-print features”, Pattern Recognition and Machine Intelligence, vol. 36, pp.371-381, 2003.
[18] The PolyU Palmprint Database: http://www4.comp. polyu.edu.hk/biometrics/
Figure 4: Palmprint corner images at various values of radius, sigma and threshold
Sigma = 1 Sigma = 2 Sigma = 3
Radius=1 Radius=2 Radius=3 Radius=1 Radius=2 Radius=3 Radius=1 Radius=2 Radius=3
THRESHOLD = 200
104 60 23 35 27 21 21 16 15 THRESHOLD = 400
93 57 23 33 26 21 21 16 15 THRESHOLD = 600
64 39 17 29 24 19 20 15 14 THRESHOLD = 800
40 23 11 21 16 14 14 10 9 THRESHOLD = 1000
Figure 5: Palmprint corner binarized images at various values of radius, sigma and threshold
SIGMA =1 SIGMA = 2 SIGMA = 3
THRESHOLD = 200
104 60 23 35 27 21 21 16 15
THRESHOLD = 400
93 57 23 33 26 21 21 16 15
THRESHOLD = 600
64 39 17 29 24 19 20 15 14
THRESHOLD = 800
40 23 11 21 16 14 14 10 9
THRESHOLD = 1000
Table 2: Threshold, Sigma and Radius, Accuracy Values For Window Size 2
Thres-hold
Sigm a
Radiu s
Numb er of Corner
s
Comparis-on Time
Accurac y
Thres-hold
Sigm a
Radiu s
Numb er of Corner
s
Comparis on Time
Accurac y
100 1 1 107 3.05E-03 96.3 600 1 1 64 3.59E-0.3 96.5
100 1 2 60 3.13E-03 96.4 600 1 2 39 3.55E-03 97
100 1 3 23 3.24E-03 95.9 600 1 3 17 3.68E-03 93.7
100 2 1 35 3.28E-03 95.7 600 2 1 29 3.24E-03 96
100 2 2 27 3.28E-03 95.5 600 2 2 24 3.18E-03 92.8
100 2 3 21 3.28E-03 94.8 600 2 3 19 3.05E-03 95
100 3 1 21 3.45E-03 96.1 600 3 1 20 3.13E-03 95.3
100 3 2 16 3.23E-03 92.4 600 3 2 15 3.15E-03 94.2
100 3 3 15 3.38E-03 93.7 600 3 3 14 3.31E-03 89.7
200 1 1 104 3.04E-03 96.5 700 1 1 51 3.11E-03 96.2
200 1 2 60 3.15E-03 96.4 700 1 2 30 3.14E-03 95.9
200 1 3 23 3.24E-03 95.9 700 1 3 14 3.12E-03 91.4
200 2 1 35 3.27E-03 95.7 700 2 1 26 3.18E-03 95.3
200 2 2 27 3.29E-03 95.5 700 2 2 21 3.13E-03 93.6
200 2 3 21 3.28E-03 9.4.8 700 2 3 17 3.05E-03 95.7
200 3 1 21 3.47E-03 96.1 700 3 1 17 3.05E-03 95.6
200 3 2 16 3.24E-03 92.4 700 3 2 13 3.05E-03 94.1
200 3 3 15 3.38E-03 93.7 700 3 3 12 3.18E-03 94.3
300 1 1 97 3.10E-03 96.3 800 1 1 40 3.11E-03 96.8
300 1 2 59 3.15E-03 96.5 800 1 2 23 3.16E-03 96.1
300 1 3 23 3.24E-03 95.8 800 1 3 11 3.14E-03 96.1
300 2 1 35 3.30E-03 95.5 800 2 1 21 3.19E-03 95.5
300 2 2 27 3.44E-03 95.5 800 2 2 16 3.17E-03 93.9
300 2 3 21 3.28E-03 94.8 800 2 3 14 3.06E-03 96.2
300 3 1 21 3.27E-03 96.1 800 3 1 14 3.01E-03 96.5
300 3 2 16 3.24E-03 92.4 800 3 2 10 3.03E-03 95.6
400 1 1 93 3.54E-03 96 900 1 1 32 3.24E-03 96.1
400 1 2 57 3.10E-03 96.7 900 1 2 20 3.21E-03 96.1
400 1 3 23 3.21E-03 95.9 900 1 3 9 3.21E-03 96.3
400 2 1 33 3.21E-03 96.3 900 2 1 14 3.19E-03 95.5
400 2 2 26 3.23E-03 95.7 900 2 2 11 3.21E-03 94.9
400 2 3 21 3.22E-03 96.4 900 2 3 10 3.27E-03 96.1
400 3 1 21 3.23E-03 95.9 900 3 1 11 3.12E-03 97.5
400 3 2 16 3.26E-03 91.3 900 3 2 7 3.16E-03 96.7
400 3 3 15 3.05E-03 93.4 900 3 3 6 3.32E-03 96.9
500 1 1 76 3.11E-03 95.6 1000 1 1 25 3.29E-03 95.5
500 1 2 48 3.11E-03 96.5 1000 1 2 15 3.32E-03 96.4
500 1 3 21 3.18E-03 95 1000 1 3 6 3.20E-03 97.1
500 2 1 31 3.17E-03 96.1 1000 2 1 13 4.11E-03 95.8
500 2 2 25 3.14E-03 95.1 1000 2 2 10 3.25E-03 95.4
500 2 3 20 3.25E-03 95.7 1000 2 3 9 3.19E-03 95.9
500 3 1 20 3.30E-03 96.1 1000 3 1 9 3.14E-03 97.3
500 3 2 15 3.66E-03 93.3 1000 3 2 5 3.16E-03 96.7