A New Relevance Feedback based Approach for
Efficient Image Retrieval
Karthik S
Department of ISE PES Institute of Technology
Bangalore South Campus, India
Snehanshu Saha
Department of CSE PES Institute of Technology
Bangalore South Campus, India
Chaithra G
Department of CSE PES Institute of Technology
Bangalore South Campus, India
ABSTRACT
The rapid growth of digital image data summons the need for an effective and efficient content-based image searching system. Such systems should address the needs of the end user and should deliver the relevant images based on the search criteria. In order to meet this requirement, the content-based image search technique should capture the color and texture information. The performance of the algorithm can be enhanced using relevance feedback method. In this paper, a content-based image retrieval method based on image and its complement is presented. The similarity between the images is identified using an approach based on most significant highest priority (MSHP) principle or using a new distance measure which belongs to minkowski family. The retrieval rate is enhanced by relevance feedback technique based on k-means algorithm. The approach is tested on Simplicity test dataset and a comparable performance was achieved
Keywords
Content based image retrieval, relevance feedback, K-means algorithm, Image search, Most Significant Highest Priority, Simplicity dataset
1.
INTRODUCTION
We ask that authors follow some simple guidelines. In essence, we ask you to make your paper look exactly like this document. The easiest way to do this is simply to download the template, and replace the content with your own material. Image retrieval has become one of the most active research directions in the multimedia information processing because of the rapidly increasing size of image database. Retrieving images based on its content is very important in areas such as museum management, architecture design, fabric design, logo design etc. Hence, content-based image retrieval gained attention by the research community. It is a technique by which the end user will be able to retrieve images, which are relevant to the search image. Till date, image retrieval focused on low level features and very little work has been reported about image retrieval based on high level features. Commonly used low level features are color, texture and shape. Of late, a new technique called relevance feedback is widely used to improve the quality of the retrieved images. In the literature, many works is reported based on this technique. From these it is learnt that the relevance feedback technique is a very powerful tool, which involves the end user in the loop to improve the performance of the system significantly. Some of the earlier works are discussed here:
P kshirsagar et al presented a semantically enabled image annotation and retrieval engine, which relies on methodolically, structured ontologies for image annotation,
and thus allowing better image search [1]. Fabio F Faria et al proposed a ranking algorithm based on support vector machine, genetic programming and association rules. This method used 18 descriptors extracted from color, texture and shape. They concluded that the method significantly improves the performance of the search engine [2]. Giorgio Giacinto proposed a Nearest Neighbor approach to relevance feedback, which is based on low level features. Every image is ranked according to a relavamce score depending on the nearest neighbor distance. The author has reported that this method outperforms the support vector machine [3]. Wei Bian et al proposed a biased discriminant Euclidean embedding which models the intraclass geometry and interclass discrimination and hence solves the undersampled problem [4]. Kien A Hua et al proposed new image retrieval technique that allows user to control the relevant ness of the result. In the method, the color contents of the regions were captured and used for identify the similar images. Authors claim that this method is superior when compared to the methods based on color histogram techniques [5]. Juan C Caicedo et al presented architecture for image administration system for medical image database. The proposed method was a multi-tier web based architecture, which supports content-based image retrieval [6]. Mei-Ling Shyu et al proposed a unified framework called markov model mediators, which facilitates to conceptually cluster the database and hence improve the query processing performance [7]. Feng Jing et al proposed a region based image retrieval method, which learns the importance of the regions based on the relevance feedback from the user. The region importance given by the user was memorized for future queries too. The method was tested on a large database and reported a satisfactory performance [8]. The rest of the paper is organized as follows. In the next section we have discussed the proposed method and after that the results are discussed. Finally a conclusion is presented in the last section.
2.
PROPOSED METHOD
2.1
Formation of Grid
An image is partitioned into 24 (4 x 6 or 6 x 4) non-overlapping tiles as shown in figure1. These tiles will serve as local color and texture descriptors for the image. Features drawn from conditional co-occurrence histograms between image tile and the corresponding complement tiles are used for color and texture similarity. All the images from the test database are of the size 256X384 or 384X256. If any new image is to be processed then it will be resized to 256X384. These images are partitioned to 24 tiles each of size 64X64. It is noted that the choice of smaller sized tiles than 64 x 64 leads to degradation in the performance [9]. Most of the texture analysis techniques make use of 64 x 64 blocks.
2.2
Co-occurrence Histogram computation
Co-occurrence histograms are constructed, for inter-channel and intra-channel information coding using image and its complement. The complement of a color image I = (R,G, B) in the RGB space is defined by equation 1.
(255
, 255
, 255
)
I
R
G
B
………equation 1A total of nine combinations considered for the computation of co-occurrence histograms. They are (R, G), (G, B), (B, R), (R’, G’), (G’, B’), (B’, R’), (R, R’), (G, G’) & (B, B’) where R, G and B represents Red, Green and Blue channels of the image. R’, G’ and B’ represents the corresponding complement channel in the image. The translation vector is t [d, a] is computed for these pairs. In t [d, a], d represents the distance and a represents the direction. For experimentation, we have considered a distance of 1 pixel and eight angles (a=0º, 45 º, 90º, 135º, 180º, 225º, 270º, 315º). Two co-occurrence histograms for each channel pair, for each of the eight angles, are constructed using a max-min composition rule, yielding a total of 16 histograms per channel pair. Then the histograms corresponding to opponent angles are merged yielding a total of 8 histograms per channel pair i.e. 0º with 180º, 45º with 225º, 90º with 270º and 135º with 315º. The method for histogram computation for one pair (RG), for one angle (0º) is presented in equation 2 and shown in figure 2. Consider two histograms H1 and H2 for R based on the max-min composition rule stated below:
Let α= max (min (r, g1), min (g, r1)) …….. equation 2
Then, r ɛ H1 if α = min(r, g1) And r ɛ H2 if α = min (g, r1)
[image:2.595.311.573.72.206.2]It yields 16 histograms per pair, 2 for each direction.
Figure 1: Image is divided into tiles
[image:2.595.58.281.580.756.2]R B
Figure 2: 8-nearest neighbors of r and g in R and G planes respectively.
2.3
Integrated matching technique
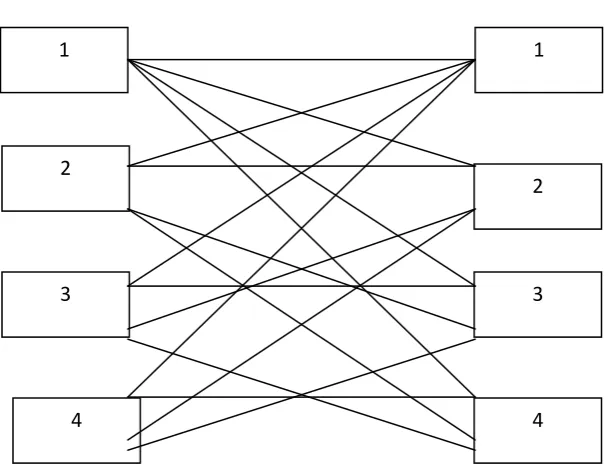
This Module implements the Most Similar Highest Priority (MSHP) algorithm for matching using the adjacency matrix of the bipartite graph. The minimum distance dij of this matrix is found between tiles i of query image and j of target image. The distance is recorded and the row corresponding to tile i and column corresponding to tile j, are blocked (replaced by some high value, say 999). This will prevent tile i of query image and tile j of target image from further participating in the matching process. The distances, between i and other tiles of target image and, the distances between j and other tiles of query image, are ignored. This process is repeated till every tile finds a matching. The integrated minimum cost match distance between images is defined by equation 3
1 1
n n
qt i j ij
D
d
….…….. equation 3
where dij is the best-match distance between tile i of query image and tile j of target image Dqt is the distance between images q and t. The process is demonstrated in figure 3 and figure 4 using an example for 4 tiles.
2.4
Relevance Feedback Technique
This module is used to increase the accuracy of image search using Relevance Feedback method. After selecting the similar images in step 3, we display top N results to the end user. The user selects all the images that are relevant to his query image. Based on this input from the end user, we classify the N images into two clusters one containing the similar images and other containing the dissimilar images. Features of two clusters are averaged. To improve the result, we retain all the relevant images selected by the user and discard the irrelevant images. These discarded images are replaced by new images from the database by comparing the feature vector of the images with the mean of the similar image cluster. This procedure can ideally be repeated until the end user retrieves all the relevant images. However, in our experimentation we have completed 6 such iterations.
2.5
The New Metric Approach
Let us introduce a metric 1 1
( , ) *
2 1
i i i
i i i
x y
d x y
x y
(13, 14) which is an extension of the metric commonly used as
r
4r
3r2
r
5r1
r
6r
7r
8g
4g
3g
2g
5g
g
11
1
( , ) *
2 1 i i
i i i
x y d x y
x y
. The color vectors in the RGB space are non-negative and multivariate in nature, a good reason why such a metric could address the issue of segmentation in
the RGB space well. The normalization factor
1 2i
gives a tighter bound for large values of i, a case appropriate for our experiment. Indeed, the results testify our assumptions.A distance function or a distance metric on asset S is
:
,
d SxS
R
where R is a set of real numbers satisfyingthe following conditions {C1-C4}:
1. ( ,
)
0
2. ( ,
)
0
3. ( ,
)
( ,
)
4. ( ,
)
( ,
)
( ,
)
d x y
d x y
x
y
d x y
d y x
d x z
d x y
d y z
The above conditions {C1-C4} need to be verified mathematically (cf, appendix 1)
3.
Results and Discussions
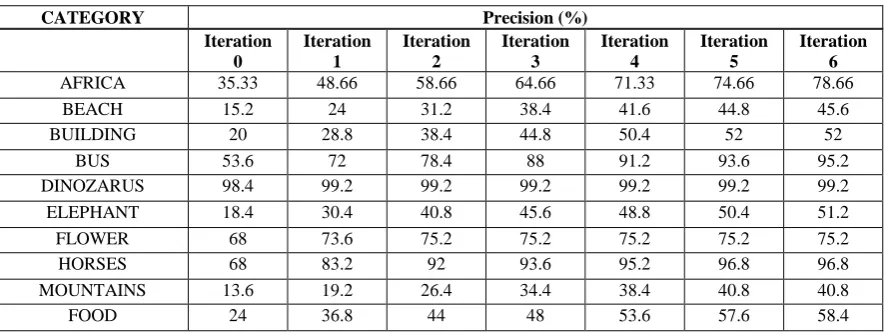
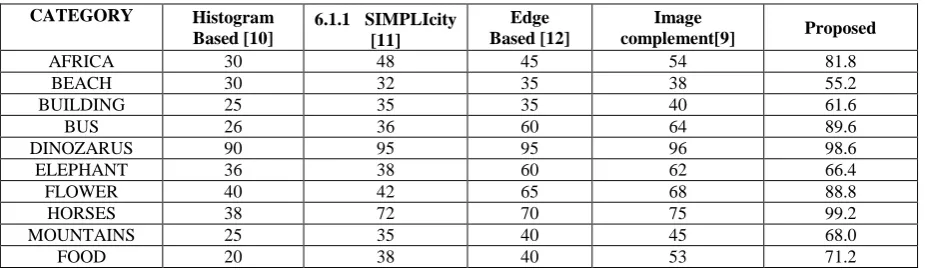
To prove the effectiveness of the proposed method, it was tested on Simplicity test database, which consists about 1000 images divided into 10 categories. To provide credible results, random images from each category were selected. The retrieved image is considered as a match if it belongs to the same category. For each of the query image the first 200 nearest match will be retrieved. The similarity between the images was measured using the Canberra distance metric and using the new metric, which we discussed, in the previous section. The performance of the system was further refined using the relevance feedback from the user. he performance of the method was measured using a metric called precision, which is defined in equation 4. The results using Canberra distance and the new metric are tabulated in Table 1 and Table 2 respectively. Table 3 indicates the percentage of improvement that we achieved by implementing this new metric. The new metric achieves higher precision in all the categories except bus and dinosaurs. The under performance of the new metric for dinosaurs category is almost negligible. However, it is observed that, the precision will increase with more number of iterations The comparison of our results with few of the benchmarked results is shown in Table 4.
_
_
_
Pr
_
_
_
_
No of
revelavent images
ecision
No of
all
retrieved
images
……… equation 4
4.
ACKNOWLEDGMENTS
The authors would like to thank Mr. Shiva Kumar S, Mr. Snehil Kumar Shukla of department of CSE, P E S Institute of Technology, Bangalore South Campus for their support in making this idea a reality.
5.
CONCLUSION
We have proposed a new method for image retrieval using color, texture features within a multi grid framework. The images are partitioned into non-overlapping tiles. Texture and color features are extracted from these tiles grid framework. Features drawn from conditional co-occurrence histograms computed by using image and its complement in RGB color space, serve as color and texture descriptors. An integrated matching scheme based on most significant highest priority (MSHP) principle and adjacency matrix of a bipartite graph constructed between image tiles, is implemented for image similarity. A new distance metric, which belongs to the minkowski family, is also implemented. The efficiency is further enhanced using relevance feedback method based on k-means principle. The experiments using the Simplicity dataset demonstrate the efficacy of the proposed method with other existing methods.
Appendix 1:
Proposition: 1
1
( , )
*
2
1
i i
i
i i i
x
y
d x y
x
y
is a metric in the appropriate metric space. {C1-C3} are readily seen!
C4 i.e.
d x y
( , )
d x z
( , )
d z y
( , )
is non-trivialDefine a metric function
( )
;
1
p
f p
p
R
p
f iscontinuous and differentiable
p
R
.Therefore,
'
2
1
( )
0
(1
)
f
p
p
R
p
implies f ismonotone increasing. Hence, by a well-known property of
monotone functions (i.e.
x
y
f x
( )
f y
( )
)We conclude
(
)
(
)
u v
u
v
f u v
f u
v
Continuing from the above inequality,
1
1
1
1
1
1
u
v
u
v
u
v
u
v
u
v
u
v
u
v
u
v
u
v
Therefore,
1
i i
i i
x
y
x
y
1
1
i i i i
i i i i
x
z
z
y
x
z
z
y
Multiplying by
1
2
i and summing over i from 1 to
yields1
1
i i
i i i
x
y
x
y
1
1
1
i i i i
i i i i i
x
z
z
y
x
z
z
y
i.e
d x y
( , )
d x z
( , )
d z y
( , )
Q.E.D
6.
REFERENCES
[1] P Kshirsagar, V Munde, S Deshpande, “ Semantic Based Search technology for Images”, International conference and workshop on emerging trends in Technology, Maharastra, Feb 26-27, 2010, pp 550-553
[2] Fabio F Faria, Adriano Veloso, Humberto Almeida, Eduardo Valle, Ricardo S Torres, Marcos A Goncalves, “ Learning to Rank for Content Based Image Retrieval”, MIR-2010, Pennsylvania, March 29-31, 2010, pp 285-294
[3] Giorgio Giacinto, “ A Nearest Neighbor Approach to Relevance Feedback in Content based image retrieval”, CIVR-2007, July 9-11, 2007, pp 456-463
[4] Wei Bian, Dacheng Tao, “ Biased Discriminant Euclidean Embedding for Content based image retrieval”, IEEE transactions on image processing, Vol 19, No 2, February 2010, pp 545-554
[5] Kien A Hua, Khanh Vu, Jung-Hwan Oh, “ SamMatch: A flexible and efficient sampling based image retrieval
technique for large image databases”, ACM transaction on Multimedia, 1999, pp 225-234
[6] Juan C Caicedo, Fabio A G, Edwin Triana, Eduardo Romero, “ Design of a Medical image database with content based retrieval capabilities”, PSIVT 2007, pp 919-931
[7] Mei-Ling Shyu, Shu-Ching Chen, Chengcui Zhang, “ A unified framework for image database clustering and content based retrieval”, MMDB-04, November 13,2004, pp 19-27
[8] Feng Jing, Bo Zhang, Fuzong Lin, Wei-Ying ma, “ A novel region based image retrieval method using relevance feedback”, International conference on Multimedia information retrieval, 2001, pp 28-31 [9] P. S. Hiremath, Jagadeesh Pujari, “Content Based Image
Retrieval based on Color, Texture and Shape features using Image and its complement”, International Journal of Computer Science and Security, Volume 1, Issue 4, 2007,pp. 25-35
[10]Y. Rubner, L.J. Guibas, and C. Tomasi, “The earth mover’s distance, multi-dimensional scaling, and color-based image retrieval”, Proceedings of DARPA Image understanding Workshop, 1997, pp. 661-668
[11]J. Li, J.Z. Wang, and G. Wiederhold, “IRM: Integrated Region Matching for Image Retrieval,” Proc. of the 8th ACM International Conference on Multimedia, 2000, pp. 147-156.
[12]M.Banerjee, M,K,Kundu and P.K.Das, “Image Retrieval with Visually Prominent Features using Fuzzy set theoretic Evaluation”, ICVGIP, 2004.
[13]Courant,R, D.Hilbert, “ Methods of Mathematical Physics”, Interscience/Wiley publication, 1989
[image:4.595.50.496.539.707.2][14]Erwin Kreyszig, “ Introductory Functional Analysis with applications”, Wiley publications, 1978
Table 1: Retrieval rate for various categories using Canberra distance
CATEGORY Precision (%)
Iteration 0
Iteration 1
Iteration 2
Iteration 3
Iteration 4
Iteration 5
Iteration 6
AFRICA 35.33 48.66 58.66 64.66 71.33 74.66 78.66
BEACH 15.2 24 31.2 38.4 41.6 44.8 45.6
BUILDING 20 28.8 38.4 44.8 50.4 52 52
BUS 53.6 72 78.4 88 91.2 93.6 95.2
DINOZARUS 98.4 99.2 99.2 99.2 99.2 99.2 99.2
ELEPHANT 18.4 30.4 40.8 45.6 48.8 50.4 51.2
FLOWER 68 73.6 75.2 75.2 75.2 75.2 75.2
HORSES 68 83.2 92 93.6 95.2 96.8 96.8
MOUNTAINS 13.6 19.2 26.4 34.4 38.4 40.8 40.8
Table 2: Retrieval rate for various categories using new distance metric
CATEGORY
Precision (%)
Iteration 0 Iteration 1 Iteration 2
Iteration 3
Iteration 4
Iteration 5
Iteration 6
AFRICA 41.6 50.4 58.4 64.8 72.0 76.0 81.8
BEACH 16.8 28.8 36.0 42.4 48.8 52.8 55.2
BUILDING 22.4 35.2 40.8 48.8 56.8 59.2 61.6
BUS 51.2 65.6 76.8 80.8 84.8 87.2 89.6
DINOZARUS 84.66 88.0 88.0 88.6 88.6 89.3 98.6
ELEPHANT 27.2 41.6 44.0 47.2 56.8 63.2 66.4
FLOWER 42.4 60.8 72.0 79.2 83.2 87.2 88.8
HORSES 71.2 87.2 92.0 95.2 97.6 98.4 99.2
MOUNTAINS 20.0 32.8 44.0 52.6 56.0 64.0 68.0
FOOD 28.8 39.2 51.2 56.8 60.8 63.2 71.2
Table 3: Comparison of the distance metrics
CATEGORY Precision using Canberra distance
Precision using the new
distance metric Percentage of improvement
AFRICA 78.66 81.8 3.99
BEACH 45.6 55.2 21.05
BUILDING 52 61.6 18.46
BUS 95.2 89.6 -5.88
DINOZARUS 99.2 98.6 -0.6
ELEPHANT 51.2 66.4 29.69
FLOWER 75.2 88.8 18.09
HORSES 96.8 99.2 2.48
MOUNTAINS 40.8 68.0 66.67
FOOD 58.4 71.2 21.92
Table 4: Comparison of proposed method with other methods
CATEGORY Histogram Based [10]
6.1.1 SIMPLIcity [11]
Edge Based [12]
Image
complement[9] Proposed
AFRICA 30 48 45 54 81.8
BEACH 30 32 35 38 55.2
BUILDING 25 35 35 40 61.6
BUS 26 36 60 64 89.6
DINOZARUS 90 95 95 96 98.6
ELEPHANT 36 38 60 62 66.4
FLOWER 40 42 65 68 88.8
HORSES 38 72 70 75 99.2
MOUNTAINS 25 35 40 45 68.0
[image:5.595.68.531.462.597.2]Tiles of Query Image
Tiles of Target Image
Fig 3: Bipartite graph showing 4 tiles of both the images
(a)
(b)
(c)
(d)
Figure 4: Image similarity computation based on MSHP principle, (a) first pair of matched tiles i=1,j=1 (b)
second pair of matched tiles i=1, j=2 (c) third pair of matched tiles i=3, j=4 (d) fourth pair of matched tiles
i=4,j=3, yielding the integrated minimum cost match distance 20.5.