Munich Personal RePEc Archive
Election Day Registration: The Second
Wave
Knack, Stephen
World Bank
1998
Online at
https://mpra.ub.uni-muenchen.de/25011/
Election-Day Registration: The Second Wave
Stephen Knack
Center for Institutional Reform and the Informal Sector (IRIS)
University of Maryland, College Park
Mailing address: IRIS, Morrill 2105, University of Maryland, College Park MD 20742; phone: 301-405-2925 (w), 301-897-3255 (h); e-mail: [email protected].
Election-Day Registration: The Second Wave
Abstract
The number of states with election-day registration (EDR) of voters doubled
in the early 1990s, providing a new opportunity to estimate the turnout impact of
EDR. Because of some important and neglected features of the "first wave" of
EDR states, adopting EDR in the early 1970s, there is good reason to expect this
"second wave" to generate larger estimates of EDR's turnout impact. Controlling
for other factors, new EDR programs are associated with a turnout increase of about
6 percentage points in the midterm elections (1990 to 1994), and 3 percentage points
in the presidential elections (1992 to 1996). Contrary to expectations, these
estimates from the "second wave" of EDR states do not exceed those generated by
studies of the “first wave” of EDR adoption.
America’s low and declining voter turnout is one of the most intensively-studied issues in
political science. Comparisons with other rich democracies inevitably lay much of the blame for
America's low turnout on our uniquely burdensome registration requirements (Lijphart, 1997;
Powell, 1986). Researchers emphasizing the impact of registration obstacles argue that "those
who are registered vote" overwhelmingly (Squire, Wolfinger & Glass, 1987: 47; also see Erickson,
1981).
Efforts to reform voter registration in the last few decades have focused on several
alternative programs. In the early 1970s, about 20 states adopted mail-in registration programs.
In part because there was no discernible impact on turnout, the spread of mail-in programs stalled
and reformers turned their attention to an alternative that seemed to be more effective.
The apparent success of election-day registration (EDR) in getting more voters to the polls
in Minnesota and Wisconsin helped convince President Carter to make it the centerpiece of his
program to increase voting participation. Despite large Democratic majorities in both houses of
Congress, he failed to get a national program of election-day registration passed in 1977.
Thereafter two independent efforts took shape, one pushing the concept later known as
"agency registration" targeted toward registering the poor through public assistance agencies, and
the other advocating "motor voter", the creation of Richard Austin, Michigan's Secretary of State,
implemented in that state in 1975 and targeted mainly at registering the young and residentially
mobile. These two efforts eventually merged, and with the election of a Democratic president,
the National Voter Registration Act was signed into law in the summer of 1993. The bulk of new
registrants under the NVRA are registering via its "motor voter" provisions, but it also mandated
registration at public assistance and other government offices, mail-in registration with no
Studies of variants of "motor voter" that were adopted by some states prior to NVRA's
passage forecast significant, if modest, turnout impacts (Knack, 1995; Rhine, 1995). Because
driver's license cycles last 3 to 5 years in most states, motor voter cannot be judged on the basis of
one election. Nevertheless, the record low turnout in 1996--the first election following
implementation of NVRA--understandably deepens the suspicions of many analysts that many
Americans simply aren’t interested in voting, however easy it becomes. Turnout in North
Dakota, which does not even have voter registration, fell to 56% of the voting-age population in
1996.
The impact of NVRA cannot be fully analyzed until motor voter programs are fully mature,
by the 2000 election. Even then, with dramatically liberalized registration procedures in all
states, disentangling the impact of the NVRA from other factors will be difficult.
Paradoxically, the NVRA has provided the best opportunity in a generation to analyze the
effects of election-day registration. States could escape NVRA mandates only if they had
universal election-day registration at the polls prior to the 1994 elections. Idaho, New
Hampshire, and Wyoming took Congress up on this offer, all implementing EDR prior to the 1994
election. These states constitute a second wave of states adopting EDR, with Maine, Minnesota,
Oregon and Wisconsin all having adopted it in the mid-1970s.i Election-day registration at the
polls eliminates registration as a separate step in voting, so it provides a upper-bound estimate of
the eventual impact of NVRA reforms--which although drastically reducing the inconvenience of
registering to vote, will not register everybody, leaving some otherwise-eligible citizens without
the option of going to the polls when they wake up on election day.ii
The impact of EDR is immediate and permanent (Fenster, 1994), unlike “motor voter,”
fact that it was implemented by all three “new” EDR states prior to the 1994 election, while NVRA
states began implementing motor voter and other provisions only in early 1995 (or later). Thus,
turnout change between the 1990 and 1994 midterm elections provides a relatively clean test of
the EDR's impact.
Because EDR was implemented in these three states between the 1992 and 1996
presidential elections, those elections provide a second new test, but one complicated somewhat by
NVRA implementation in most states between those two election years. Comparisons using the
1996 elections necessitate the use of a much smaller “control group” of states, because all but a
very few states implemented substantial reforms between the 1992 and 1996 elections. Turnout
effects will be explored here by examining changes in state turnout figures between 1990 and
1994, and between 1992 and 1996, using appropriate control groups.
Because of the time-series dimension to the analysis, numerous other factors influencing
turnout are implicitly held constant in these comparisons (Fenster, 1994). However, multivariate
tests of turnout change are also conducted, so that statistical controls as well as research design
controls are employed.
The impact of EDR on turnout is not particularly controversial: the best studies, reviewed
below, have produced fairly consistent estimates. All of these estimates, however, have been
dependent on a very small number of states adopting (or dropping) EDR over time; similar
estimates produced by additional states would contribute to resolving this generalizability issue.
Moreover, all of the previous studies have neglected important idiosyncratic features of these
states’ EDR programs and registration histories, described in the next section. The
NVRA-induced adoption of EDR by Idaho, New Hampshire, and Wyoming nearly doubles the
2. EDR: The First Wave
This section briefly reviews evidence on the first wave, and examines the four states
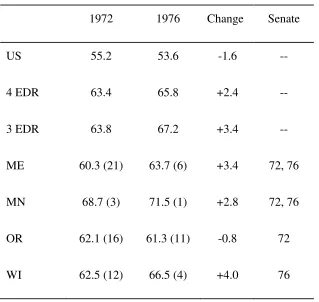
adopting EDR in the early 1970s more closely. Table 1 shows the national turnout rate for the
1972 and 1976 elections, and the rates--and state rankings, in parentheses--for the four states
adopting EDR between those two elections. All four states ranked in the top half of states even in
1972; with EDR all improved their rankings in 1976. Turnout increase in the EDR states
averaged 2.4 percentage points, in the face of a 1.6-point decline nationally, suggesting that the
adoption of EDR increased turnout by about 4 percentage points.iii
There is good reason to believe that estimates produced by this first EDR wave understate
what EDR’s impact on turnout would be in most states. In Minnesota and Wisconsin, about one
third of eligible persons lived in counties that did not even have voter registration prior to adopting
EDR (Smolka, 1977). Thus, EDR's turnout effects should be about 50% greater if adopted in
states in which all voters were previously required to register.
Of the four first wave EDR states, only Minnesota and Wisconsin adopted universal
election-day registration at the polls. In Oregon, election-day registrants had to register at another
location before going to the polls. The same was and still is true for larger urban centers in
Maine,iv although these apparently account for less than half of the state’s population. Deleting
Oregon from the EDR group yields a mean turnout increase in 1976 of 3.4 percentage points,
producing an estimated turnout impact of about 5 percentage points.
Table 2 summarizes turnout change in the first midterm election held with EDR in each of
the four states. Three of the four--all but Minnesota--rose in the turnout rankings.
8th in 1984 to 13th in 1988, but rose to 8th again in 1992. Its turnout rank in midterm elections
actually rose from 8th in 1982 to 5th in 1986, remaining there in 1990. Oregon's experience thus
suggests that EDR is largely ineffective unless voters can register at the polls.
The 5-point estimate for EDR's turnout impact suggested by Table 1 is consistent with
estimates obtained in more formal analyses. Using data from several elections prior and
subsequent to EDR implementation, rather than just the immediately prior and following elections,
Fenster (1994) concludes that EDR caused a once-and-for-all turnout rise in Maine, Minnesota and
Wisconsin of about 5 percentage points.v Multivariate analyses by Rhine (1995) using state-level
data, and by Wolfinger and Rosenstone (1980), Teixeira (1992), and Mitchell and Wlezian (1995)
using survey data, produce estimates ranging from 3 to 6 percentage points.vi
None of these studies account for the fact that EDR could not have had any effect on one
third of Minnesota and Wisconsin residents, who were not required to register at all before the
advent of EDR. Likewise, none account for the fact that a sizeable fraction of Maine voters
cannot register at the polls on election day. Most of these studies--by classifying Oregon as EDR
--do not account for the fact that no voters could register at the polls on election day in that state.
3. The Second Wave: Evidence from Midterm Elections
Because the three new EDR states required all residents to register previously and adopted
state-wide election-day registration at the polls, a natural hypothesis is that turnout may increase
by more in this second EDR wave than in the earlier wave. In fact, estimates detailed below range
from about 3 to 6 percentage points -- remarkably similar to those generated from the first wave of
EDR adoption.
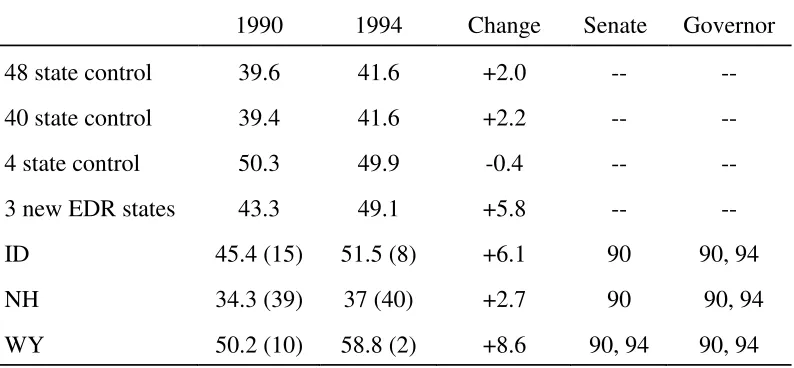
averaged 5.8 percentage points, while turnout in the remaining 48 states rose by an average of 2.0
points. This difference suggests a turnout impact of about 3.8 percentage points, although the
difference in mean turnout changes between the new EDR group and the other 48 states is not
significant at conventional levels (p=.31, two-tailed test). Two of the three states (ID and WY)
substantially improved their turnout rankings among the states.
Although implementation of NVRA-mandated programs began only in early 1995, 11
states had adopted effective "motor voter" programs prior to NVRA passage, with 8 of these new
enough to influence turnout differences between 1990 and 1994.vii Subtracting these 8 states
creates a control group of 40 states with no major registration reforms between 1990 and 1994.
As shown in Table 3, this 40-state group actually experienced a slightly larger turnout increase (2.2
percentage points) than the 48-state group (2.0 points). Based on a comparison with the 40-state
control group, new EDR programs provided a turnout edge of about 3.6 points (5.8 - 2.2). The
difference in average turnout changes between the new EDR group and the 40-state control group
is not significant (p=.37).
Even in these 40 "non-reform" states, there were minor reforms in some, such as allowing
mail-in registration, or making registration forms available on request at various government
offices. Although mail-in and "passive" versions of agency and motor voter programs appear to
have little effect on turnout (e.g., Knack, 1995), it is useful to examine a more pure four-state
control group: the three "old" EDR states and North Dakota (which has long had no registration
requirement). While there have been some reforms even in these states (most notably, motor
voter in Maine since 1990), they cannot possibly have much of an impact, as most voters in Maine,
and all voters in the other three states, can simply show up at the polls on election day to register
Turnout fell marginally (by an average 0.4 points) between 1990 and 1994 in this four-state
control group, as shown in Table 3. Based on a comparison with this group, new EDR programs
appear to have provided a turnout edge of about 6.2 percentage points (5.8 + 0.4). Unlike the
other comparisons, the difference in turnout changes between these two groups is statistically
significant, despite the very small sample sizes (p=.04).
Idaho and New Hampshire had governor’s races on the ballot in 1994 but not in 1990,
possibly accounting in part for their relative improvement. But Wyoming exhibited the largest
turnout increase among the 3 new EDR states, and it had Senate and governor’s contests in 1990 as
well as 1994.
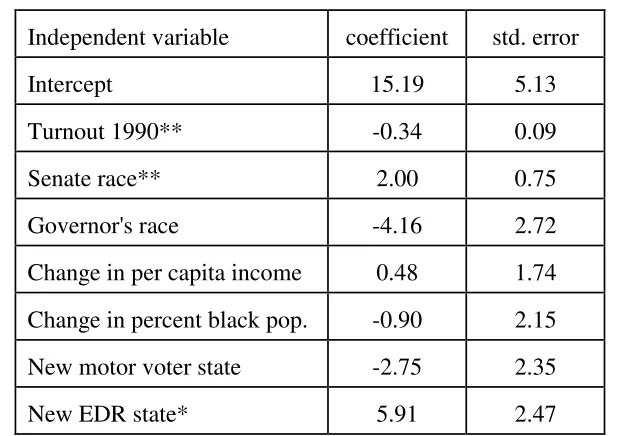
The multiple regression analysis reported in Table 4 controls for these and other possibly
confounding influences on turnout change. The dependent variable is the percentage point
change in state turnout between 1990 and 1994, with positive numbers representing increases and
negative numbers representing declines. Independent variables control for ballot effects, possible
"regression to the mean" effects, demographic changes, and other registration innovations.
Part of any election-to-election change in turnout could simply reflect a "regression to the
mean" effect in which states with unusually high or low turnout levels in the previous election
move back toward their norms. The negative and significant coefficient on 1990 turnout in Table
4 is consistent with this hypothesis: on average, each 3 percentage-point increment in the level of
turnout in 1990 is associated with a 1-point drop between the 1990 and 1994 elections.
The Senate dummy is coded +1 for states with a Senate contest in 1994 but not in 1990, and
-1 for states with a contest in 1990 but not in 1994; all other states are coded 0. The regression
coefficient thus estimates the turnout impact of adding a Senate contest to a given state's ballot.
for governor's races produces a large negative but insignificant coefficient.viii
Neither of the demographic controls -- change in per capita income in thousands of dollars,
and change in percent African American -- come close to being significant.ix
Other things equal, states with "new" motor voter programs -- those implemented for less
than 5 years prior to the 1994 election -- experienced a nearly 3 percentage-point drop in turnout,
rather than the expected increase. However, this change is not statistically significant.
Finally and most importantly, new EDR programs are associated in Table 4 with a
significant turnout increase, of just under 6 percentage points, in the midterm elections.x This
estimate, coupled with a slightly smaller one generated by the 1992-96 presidential elections (as
shown in the following section), provides evidence remarkably consistent with that produced by
analyses of the turnout impact of the first wave of EDR adoption.
4. The Second Wave: Evidence from Presidential Elections
Most states undertook major reforms associated with NVRA implementation between
1992 and 1996. Despite those reforms, turnout fell by an average of 6.7 percentage points in the
48 states without new EDR programs (see Table 5). Turnout fell by an average 5.2 points in the
new EDR states; the 1.5 point difference in these declines is not significant (p=.31). The new
EDR states -- indeed, all 50 states and DC -- suffered declining turnout, but maintained (ID) or
improved (NH and WY) their turnout rankings among the states.
Because most of the 48 states without new EDR programs implemented major new reforms
between the 1992 and 1996 elections, two smaller control groups are used to provide more
appropriate benchmarks for evaluating EDR. A 14-state control group includes first-wave EDR
implementing it by the 1996 election (VT), and states with active motor voter programs in effect
prior to 1992 (AZ, CO, DC, MI, MT, NC, NV, OR, and WA). Even many of these "old" motor
voter states implemented other NVRA-mandated reforms -- such as mail-in and agency
registration -- after 1992. Thus, a second, smaller group of five non-reforming states is comprised
of the three "old" EDR states, North Dakota, and Vermont.
Turnout decline in the 14-state group averaged 8.1 points, compared to the new-EDR
group's 5.2 point drop. This difference suggests a turnout impact for EDR adoption of about 2.9
percentage points, and is statistically significant (p=.08, or .04 for one-tailed test).
Turnout decline in the 5-state control group averaged 9.6 percentage points. The
4.4-point difference between that decline and the new EDR group's 5.2-point drop is statistically
significant (p=.03).
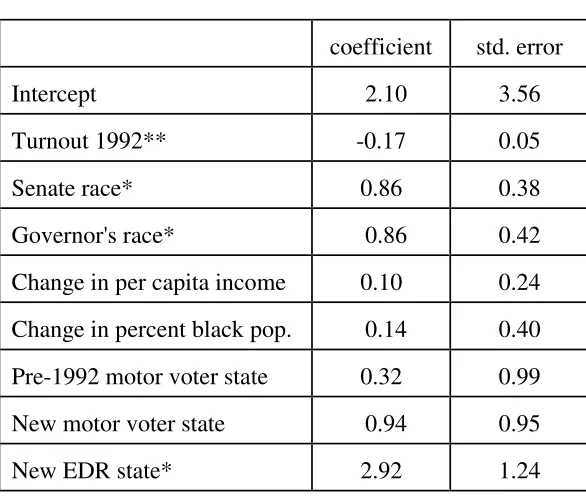
The multiple regression analysis of Table 6 produces a smaller, but statistically significant,
estimate of 3 percentage points for EDR's turnout-enhancing impact. This regression is closely
analogous to that of Table 4, but with turnout change from 1992 to 1996 as the dependent variable,
instead of 1990-94 turnout change.
Other than the smaller EDR coefficient, results in Table 6 differ from those of Table 4 in
several ways. Both Senate and gubernatorial races significantly increase presidential-year
turnout, but by very little, with point estimates of less than a single percentage point. The
"regression-to-the-mean" effect is only about half as strong as for the midterm elections.
Dummies are included for two groups of states with alternative reforms to EDR: (1) states
implementing motor voter in 1991 or earlier, for which NVRA mandates are likely to have little
impact on 1992-96 turnout change, and (2) states implementing NVRA in 1992 or later, whether
group of states, although most of them did not complete a driver's license renewal cycle before the
1996 election. The omitted category of states, coded 0 for these two dummies and for the new
EDR dummy, is comprised of the 5 non-reform states (ME, MN, ND, VT, WI). As hypothesized,
turnout declines the least for the new EDR states, then for the new motor voter states, then for the
old motor voter states, and declines most for the omitted category of non-reformers, controlling for
other variables. The only statistically significant difference between non-reformers and
reformers is for the new EDR states, however, as neither motor voter coefficient is significant.
5. Conclusion
This study investigates the effects of EDR on overall turnout, and on turnout rates for
different groups, by comparing turnout changes for the 3 new EDR states and control groups of
no-reform states. Previous estimates of EDR's impact on turnout have been based on only a few
states, and typically have ignored idiosyncracies of registration law in these states. Many
Minnesota and Wisconsin residents were not required to register even before the advent of EDR.
Voters in Oregon and in parts of Maine could register on election day, but not at the polls. All
four states were historically high turnout states, subjecting any cross-sectional estimates to omitted
variable bias. Despite these characteristics of first-wave states, estimates of EDR’s turnout
impact generated by the second wave of EDR implementation are remarkably similar to those
produced by studies of the earlier wave, varying from about 3 to 6 percentage points.
While perhaps reassuring from an empirical researcher’s point of view, these findings
must be disappointing to reform advocates who hoped for much larger increases in turnout from
the NVRA. Because most but not all eligible persons will eventually be registered by motor voter
estimate of NVRA's turnout impact. Turnout in the 1996 election certainly provides no reason to
suspect that 3-6 percentage points is too modest a prediction. While not a full test of brand-new
motor voter programs, the experience of 1996 suggests that most new registrants will not vote.
A final cautionary note is that all of the EDR states, from both waves, tended to have
above-average turnout rates even prior to their adoption of EDR. Reforms in lower-turnout states
may eventually prove to have larger percentage-point impacts, simply because they are starting
Endnotes
i. Oregon repealed EDR by initiative in 1985, in response to a religious cult’s takeover of the town
of Antelope (renamed “Rajneesh”) and threatened takeover of the Wasco County government.
The Rajneeshees recruited hundreds of street people from around the country to vote in the local
elections held on November 6, 1984. (See “Guru Recruits Drifters; Takeover by Outsiders
Feared,” Washington Post, Sept. 24, 1984, page A1.) Ohio adopted EDR in early 1977, only to
overturn it via a constitutional amendment ratified by voters in November 1977, without ever
trying it in a national election year.
ii. On the other hand, the names of motor voter registrants (but not election-day registrants) appear
on lists that can be obtained by parties and used in get-out-the-vote efforts. Voter registration lists
identify the party affiliations of registrants in about half of the states, including ME, NH and OR
but not ID, MN, WI or WY among the EDR states.
iii. The timing of Senate contests is a possible explanation for the relative showings of Oregon and
Wisconsin. Oregon had a Senate race in 1972 but not in 1976, which might have contributed to
the turnout decline in that state. Wisconsin, which had the largest turnout increase from 1972 to
1976, had no Senate contest on the ballot in 1972 but had one in 1976. In any event, the turnout
effects of Senate races appears to be modest (Knack, 1995; Rhine, 1995; Cox & Munger, 1989;
Boyd, 1981). Senate and gubernatorial races are controlled for explicitly in multivariate tests
iv. Maine, unlike other current EDR states, is ineligible for a waiver from NVRA mandates
because it does not have universal election-day registration at the polls.
v. Ideally, the turnout effects of the second wave of EDR eventually could be tested in a similar
manner. At a minimum, replication of Fenster’s method for the second EDR wave would require
waiting until several more elections have occurred. Even then, disentangling EDR’s effects from
that of the NVRA would be highly problematic.
vi. Fenster did not include Oregon as an EDR state. Rhine (1995) and Brians (1997) classify
Oregon as having EDR from 1976 through 1986. Statutes indicate that the state legislature
instituted a day-before-election-day deadline in 1985, in effect in the 1986 election, during which
voters approved an initiative restoring the pre-1976 20-day deadline (Crocker, 1996; also see
Oregon Revised Statutes, 247.025). Fenster uses a simple EDR/non-EDR dichotomy. All of the
other studies cited estimate EDR’s effects using the variable “closing date” which varies from 0
(for EDR states) up to 30 or more days. Brians (1997) confirms the intuitive expectation that the
impact of closing date is highly non-linear: closing the registration rolls 30 days prior to election
day is estimated to reduce turnout by little more than a 30-day closing date. The effects of
vii. These were DC, HI, MT, NC, NV, OR, TX, and WA. Programs in AZ, CO, and MI had been
in effect for a full driver's license cycle by the 1990 election. "Passive" programs that require
applicants for drivers' licenses to ask for registration forms are not classified here as motor voter,
nor are nominally "active" programs in NJ, OH and WV which apparently were not fully
implemented.
viii. Evidence on gubernatorial contests on a state’s ballot varies widely. They are associated
with a turnout increase of just under 2 percentage points in Rhine (1995) and Knack (1995), who
use state-level data from the 1970s through 1992 and control for fixed state effects. When
presidential years are separated from midterm years, this positive effect surprisingly is found to
hold only for the presidential years (Knack, 1995). Cox and Munger (1989) find small (about 1
percentage point) and only marginally significant effects (p values of about .10 for two-tailed tests)
for Senate and gubernatorial races, using congressional-district level data for the 1982 election.
Boyd (1981), perhaps the best-known study of election-calendar effects, finds that concurrent
gubernatorial elections raise a state’s turnout by nearly 6 percentage points while Senate contests
have no effect. However, he uses survey data (from the 1980 National Election Studies)
representing only one election and only about 30 states.
ix. State-level data on other demographic variables, such as educational attainment, age and
x. This estimate is not sensitive to outliers, as found by using alternative estimation procedures that
weight outliers less heavily than OLS. Robust regression and median regression, respectively,
generate EDR coefficients of 6.0 and 7.6 (with standard errors of 2.5 and 2.0).
References
Boyd, R. W. (1981). Decline of U.S. Voter Turnout: Structural Explanations. American Politics Quarterly,
9(2), 133-159.
Brians, C. L. (1997). Voter Turnout and Election Day Registration. Paper presented at the annual meeting
of the American Political Science Association, Washington, DC.
Erickson, R. S. (1981). Why Do People Vote? Because They Are Registered. American Politics Quarterly,
9, 259-276.
Fenster, M. J. (1994). The Impact of Allowing Day of Registration Voting on Turnout in U.S. Elections
from 1960 to 1992. American Politics Quarterly, 22(1), 74-87.
Knack, S. (1995). Does Motor Voter Work? Journal of Politics, 57(3), 796-811.
Science Review, 91(1), 1-14.
Mitchell, G. E., & Wlezian, C. (1995). The Impact of Legal Constraints on Voter Registration, Turnout,
and the Composition of the American Electorate. Political Behavior, 17(2), 179-202.
Powell, G. B., Jr. (1986). American Voter Turnout in Comparative Perspective. American Political
Science Review, 80(1), 17-43.
Rhine, S. (1995). Registration Reform and Turnout Change in the American States. American Politics
Quarterly, 23(4), 409-26.
Smolka, R. (1977). Election-Day Registration: The Minnesota and Wisconsin Experience of
1976. Washington, DC: American Enterprise Institute.
Squire, P., Wolfinger, R. E. & Glass, D. P. (1987). Residential Mobility and Voter Turnout. American
Political Science Review, 81(1), 45-65.
Teixeira, R. A. (1992). The Disappearing American Voter. Washington, DC: The Brookings Institution.
White, H. (1980). A Heteroskedasticity-consistent Covariance Matrix Estimator and a Direct Test for
Wolfinger, R. E. & Rosenstone, S. J. (1980). Who Votes? New Haven: Yale University Press.
Table 1
Turnout Change, 1972 to 1976
1972 1976 Change Senate
US 55.2 53.6 -1.6 --
4 EDR 63.4 65.8 +2.4 --
3 EDR 63.8 67.2 +3.4 --
ME 60.3 (21) 63.7 (6) +3.4 72, 76
MN 68.7 (3) 71.5 (1) +2.8 72, 76
OR 62.1 (16) 61.3 (11) -0.8 72
WI 62.5 (12) 66.5 (4) +4.0 76
Turnout Change in Early EDR States
Before After Change National change
Senate Governor
ME 1970-74 54.1 (13) 50.3 (8) -3.8 -8.4 70 70, 74
MN 1970-74 60.7 (5) 47.8 (12) -12.9 -8.4 70 70, 74
WI 1974-78 39.2 (33) 46.0 (11) +6.8 -1.0 74 74
OR 1974-78 48.7 (10) 50.4 (4) +1.7 -1.0 74, 78 74, 78
OR 1984-88 61.8 (8) 57.3 (13) -4.5 -3.0 84
[image:21.612.91.526.116.289.2]OR 1982-86 53.2 (8) 52.4 (5) -0.8 -3.4 86 82, 86
Table 3
Turnout Change and EDR, 1990 to 1994
1990 1994 Change Senate Governor
48 state control 39.6 41.6 +2.0 -- --
40 state control 39.4 41.6 +2.2 -- --
4 state control 50.3 49.9 -0.4 -- --
3 new EDR states 43.3 49.1 +5.8 -- --
ID 45.4 (15) 51.5 (8) +6.1 90 90, 94
NH 34.3 (39) 37 (40) +2.7 90 90, 94
WY 50.2 (10) 58.8 (2) +8.6 90, 94 90, 94
Table 4
Multiple Regression Analysis:
[image:21.612.110.507.359.543.2]
Independent variable coefficient std. error
Intercept 15.19 5.13
Turnout 1990** -0.34 0.09
Senate race** 2.00 0.75
Governor's race -4.16 2.72
Change in per capita income 0.48 1.74
Change in percent black pop. -0.90 2.15
New motor voter state -2.75 2.35
New EDR state* 5.91 2.47
NOTE: R2 = .34 and adjusted R2 = .23. Sample size is 51. Mean of dependent variable is 2.17.
[image:22.612.151.466.95.313.2]Standard errors are corrected for heteroskedasticity using White's (1980) method. *Significant at .05, 2-tailed test; **Significant at .01, 2-tailed test.
Table 5
Turnout Change and EDR, 1992 to 1996
1992 1996 Change Senate Governor
48 state control 57.5 50.8 -6.7 -- --
14 state control 61.9 53.8 -8.1
5 state control 69.5 59.9 -9.6 -- --
3 new EDR states 63.1 57.9 -5.2 -- --
ID 64.3 (11) 57.1 (11) -7.2 92, 96
NH 64.2 (12) 57.3 (9) -6.9 92, 96 92, 96
Table 6
Multiple Regression Analysis:
Change in Turnout Rates, 1992 to 1996
coefficient std. error
Intercept 2.10 3.56
Turnout 1992** -0.17 0.05
Senate race* 0.86 0.38
Governor's race* 0.86 0.42
Change in per capita income 0.10 0.24
Change in percent black pop. 0.14 0.40
Pre-1992 motor voter state 0.32 0.99
New motor voter state 0.94 0.95
New EDR state* 2.92 1.24
NOTE: R2 = .42 and adjusted R2 = .31. Sample size is 51. Mean of dependent variable is -6.63.
Standard errors are corrected for heteroskedasticity using White's (1980) method. *Significant at .05, 2-tailed test; **Significant at .01, 2-tailed test.
Biographical paragraph:
Stephen Knack’s previous work on the impact of voter registration procedures has been published in the Journal of Politics, PS, American Politics Quarterly and other journals.