Predicting Student Performance:
A Statistical and Data Mining Approach
V.Ramesh
Assistant Professor Department of CSA SCSVMV University KanchipuramIndia
P.Parkavi
Assistant Professor PG Dept. of Computer ApplicationsThirumalai Engineering College Kanchipuram
K.Ramar
PrincipalEinstein College of Engineering Tirunelveli
Tamil Nadu, India
ABSTRACT
Predicting the performance of a student is a great concern to the higher education managements. The scope of this paper is to identify the factors influencing the performance of students in final examinations and find out a suitable data mining algorithm to predict the grade of students so as to a give timely and an appropriate warning to students those who are at risk. In the present investigation, a survey cum experimental methodology was adopted to generate a database and it was constructed from a primary and a secondary source. The obtained results from hypothesis testing reveals that type of school is not influence student performance and parents’ occupation plays a major role in predicting grades. This work will help the educational institutions to identify the students who are at risk and to and provide better additional training for the weak students.
Keywords: Educational Data Mining, Decision Tree,
Multilayer Perception, Student performance.
1.
INTRODUCTION
Measuring of academic performance of students is challenging since students academic performance hinges on diverse factors like personal, socio-economic, psychological and other environmental variables. The scope of this paper is to predict the student marks and what are the factors that influence the performance of the students.
In Tamilnadu, the higher secondary education consists of two years of schooling, preceding ten years of basic education and followed by higher education. The higher secondary education is important in a student’s life because it is one of the factors that are going to decide the future of the student. Based on their mark in higher secondary examination, they are going to get college education.
Data mining provides many tasks that could be used to study the student’s performance. In this paper, the classification task is used to evaluate performance of a student and as there are many approaches that are used for data classification, the decision tree and Naïve Bayes, MultiLayerPerception methods was used here. For this study, recent real world data were collected from different higher secondary schools in Kancheepuram district. Two different sources, marks list and questionnaires were used. Information’s like tenth grade, study time, care at home etc., were collected from students through questionnaire. The mark lists were collected from the higher secondary schools to predict their marks at the end of
the year.
This study is more useful for identifying weak students and the identified students can be individually assisted by the educators so that their performance is better in future. This study investigates the accuracy of some classification techniques for predicting performance of a student.
The main objectives of this study are
Identification of highly influencing predictive variables on the academic performance of higher secondary students.
Find the best classification algorithm on student data. Predict the grade at higher secondary examination.
2. REVIEW OF LITERATURE
A number of reviews pertaining to not only the diverse factors like personal, socio-economic, psychological and other environmental variables that influence the performance of students but also the models that have been used for the performance prediction are available in the literature and a few specific studies are listed below for reference.
M.Ramaswami and R.Bhaskaran [1] have used CHAID prediction model to analyze the interrelation between variables that are used to predict the outcome of the performance at higher secondary school education. The features like medium of instruction, marks obtained in secondary education, location of school, living area and type of secondary education were the strongest indicators for the student performance in higher secondary education. The CHAID prediction model of student performance was constructed with seven class predictor variable.
Nguyen Thai-Nghe, Andre Busche, and Lars Schmidt-Thieme [2] have applied machine learning techniques to improve the prediction results of academic performances for two the real case studies. Three methods have been used to deal with the class imbalance problem and all of them show satisfactory results. They first re balanced the datasets and then used both cost-insensitive and sensitive learning with SVM for the small datasets and with Decision Tree for the larger datasets. The models are initially deployed on the local web.
differ in their programming skills. The huge proportions of urban students are good in programming skill compared to rural students. It divulges that academicians provide extra training to urban students in the programming subject.
Cortez and Silva [4] attempted to predict failure in the two core classes (Mathematics and Portuguese) of two secondary school students from the Alentejo region of Portugal by utilizing 29 predictive variables. Four data mining algorithms such as Decision Tree (DT), Random Forest (RF), Neural Network (NN) and Support Vector Machine (SVM) were applied on a data set of 788 students, who appeared in 2006 examination. It was reported that DT and NN algorithms had the predictive accuracy of 93% and 91% for two-class dataset (pass/fail) respectively. It was also reported that both DT and NN algorithms had the predictive accuracy of 72% for a four-class dataset.
3.
METHODOLOGY
Through extensive search of the literature and discussion with experts on student performance, a number of factors that are considered to have influence on the performance of a student were identified. These influencing factors were categorized as input variables. The output variables on the other hand represent some possible grades. The primary data were collected from the higher secondary school students and the secondary data were collected from the schools and from internet.
For this study, recent real world data were collected from higher secondary students. Nine schools were randomly selected from Kancheepuram district. A sample of 900 students was taken from a group of schools. Students were grouped in a classroom where they were briefed clearly about the questionnaire and it took on average half an hour to fill the questionnaire. Selection of students was at random.
The primary data was collected using a questionnaire which includes questions related to several personal, socio-economic, psychological and school related variables that were expected to affect student performance. The questionnaire was reviewed by the professionals and tested on a small set of 45 students in order to get a feedback. The final version contained 50 questions and it was answered by more than 900 students. Latter a sample of 500 were selected from the whole. All 500 questionnaires were filled with the response rate of 100% out of which 316 were females and 184 were males.
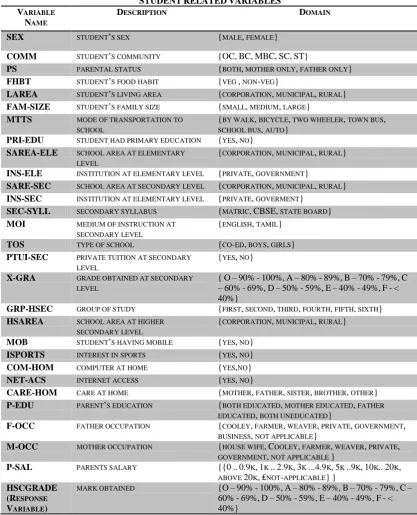
The secondary data such as mark details were collected from the schools. All the predictor and response variables which were derived from the questionnaire are given in Table 1 for reference. The domain values for some of the nativity variables were defined for the present investigation as follows:
PS: Parental status. It determines the parental status of the student. The possible values are mother only, father only and both.
MTTS: Mode of transportation to school. It determines student. The possible values are by walk, bicycle, two wheeler, and town bus.
COMM: Community- Even though India has defined itself as a secular state, religion and caste are deeply entrenched in the identity of Indians across ages. These factors play a direct or indirect role in the daily lives including the education of young people. In terms of social status, the population is grouped into five categories: Scheduled Castes (SC), Scheduled Tribes (ST), Most Backward Classes (MBC), Backward Classes (BC) and Others (OC). Possible values are OC, BC, MBC, SC and ST.
PTUI-SEC
Private tuition at secondary level. Most of the parents send their wards for private tutoring after school hours. The number of subjects taught at secondary level is five. Therefore the number private tutoring subjects can vary from zero to five.
X-GRA: Marks obtained at secondary level. Students who are in state board stream appear for five subjects each carry 100 marks, transform the marks in percentage into grades by mapping O – 90% to 100%, A – 80% - 89%, B – 70% - 79%, C – 60% - 69%, D – 50% - 59%, E – 40% - 49%, and F - < 40%}.
GRP-HSC:
Six types of group of study, based on core subjects, is offered at higher secondary level comprising first group (Maths, Physics, Chemistry, Biology), second group (Maths, Chemistry, Physics, Computer Science) third group (Physics, Chemistry, Botany, Zoology), fourth group (History, Economics, Commerce, Accountancy) fifth group (Computer Science, Economics, Commerce, Accountancy) and sixth group (Commerce, Accountancy, Practical-type writing, Office management).
TOS: Type of school. This determines the type of school that the student studied in higher secondary level. It includes the possible values, co-education, boys, and girls.
PTUI-HSEC:
Private tuition at higher secondary level. The number of subjects taught at higher secondary level is six. Therefore, the number private tutoring subjects can vary from zero to six.
HSCGRADE:
TABLE 1
STUDENTRELATEDVARIABLES
VARIABLE
NAME
DESCRIPTION DOMAIN
SEX STUDENT’S SEX {MALE, FEMALE}
COMM STUDENT’S COMMUNITY {OC,BC,MBC,SC,ST}
PS PARENTAL STATUS {BOTH, MOTHER ONLY, FATHER ONLY}
FHBT STUDENT’S FOOD HABIT {VEG , NON-VEG}
LAREA STUDENT’S LIVING AREA {CORPORATION, MUNICIPAL, RURAL} FAM-SIZE STUDENT’S FAMILY SIZE {SMALL, MEDIUM, LARGE}
MTTS MODE OF TRANSPORTATION TO
SCHOOL
{BY WALK, BICYCLE, TWO WHEELER, TOWN BUS,
SCHOOL BUS, AUTO} PRI-EDU STUDENT HAD PRIMARY EDUCATION {YES, NO}
SAREA-ELE SCHOOL AREA AT ELEMENTARY LEVEL
{CORPORATION, MUNICIPAL, RURAL}
INS-ELE INSTITUTION AT ELEMENTARY LEVEL {PRIVATE, GOVERNMENT}
SARE-SEC SCHOOL AREA AT SECONDARY LEVEL {CORPORATION, MUNICIPAL, RURAL} INS-SEC INSTITUTION AT ELEMENTARY LEVEL {PRIVATE, GOVERMENT}
SEC-SYLL SECONDARY SYLLABUS {MATRIC,CBSE, STATE BOARD}
MOI MEDIUM OF INSTRUCTION AT
SECONDARY LEVEL
{ENGLISH, TAMIL}
TOS TYPE OF SCHOOL {CO-ED, BOYS, GIRLS}
PTUI-SEC PRIVATE TUITION AT SECONDARY LEVEL
{YES, NO}
X-GRA GRADE OBTAINED AT SECONDARY LEVEL
{O–90%-100%,A–80%-89%,B–70%-79%,C –60%-69%,D–50%-59%,E–40%-49%,F-< 40%}
GRP-HSEC GROUP OF STUDY {FIRST, SECOND, THIRD, FOURTH, FIFTH, SIXTH} HSAREA SCHOOL AREA AT HIGHER
SECONDARY LEVEL
{CORPORATION, MUNICIPAL, RURAL}
MOB STUDENT’S HAVING MOBILE {YES, NO}
ISPORTS INTEREST IN SPORTS {YES, NO}
COM-HOM COMPUTER AT HOME {YES,NO}
NET-ACS INTERNET ACCESS {YES, NO}
CARE-HOM CARE AT HOME {MOTHER, FATHER, SISTER, BROTHER, OTHER} P-EDU PARENT’S EDUCATION {BOTH EDUCATED, MOTHER EDUCATED, FATHER
EDUCATED, BOTH UNEDUCATED}
F-OCC FATHER OCCUPATION {COOLEY, FARMER, WEAVER, PRIVATE, GOVERNMENT,
BUSINESS, NOT APPLICABLE}
M-OCC MOTHER OCCUPATION {HOUSE WIFE,COOLEY, FARMER, WEAVER, PRIVATE,
GOVERNMENT, NOT APPLICABLE }
P-SAL PARENTS SALARY {{0..0.9K,1K ..2.9K,3K ...4.9K,5K ..9K,10K..20K,
ABOVE 20K,₤NOT-APPLICABLE}} HSCGRADE
(RESPONSE
VARIABLE)
MARK OBTAINED {O–90%-100%,A–80%-89%,B–70%-79%,C–
60%-69%,D–50%-59%,E–40%-49%,F-< 40%}
4. TOOLS
AND
TECHNIQUES
Classification trees are widely used in different fields such as medicine, computer science, botany and psychology. These trees readily lend themselves to be displayed graphically, helping to make them easier to interpret than they would be if only a strict numerical interpretation were possible. For this study WEKA’s implementation of Naive Bayes, Multi Layer Perception, SMO, J48, REPTree algorithms were used.
4.1. Data pre-processing
As it is common in data mining, before running tests on data instances, it is necessary to clean and prepare the data for use
[image:3.595.88.506.98.614.2]information which might potentially be useful for learning.
Then ‘select attributes’ were used to rank the attributes. Attribute selection involves searching through all possible combinations of attributes in the data to find which subset of attributes works best for prediction. To do this, two objects must be set up: an attribute evaluator and a search method. The evaluator determines what method is used to assign a worth to each subset of attributes. The search method determines what style of search is performed. In this study, ‘Ranker’ method was used. Then top 10 attributes were selected from those 27 attributes for this study.
A total of 500 records were taken for the analysis. In this study, attribute selection were used to find out the best attributes in the data. In attribute evaluator ChiSquared attribute evaluator, InfoGain attribute evaluator, OneR attribute evaluator, SymmetricalUncert attribute evaluator, ReleiefF attribute evaluator were used and in search method Ranker search method is used. The ranks generated by each method for every attribute were ranked manually. The ranks of each attribute were added and the corresponding average was calculated. Ranked attributes are given Table 2.
TABLE2
HIGHPOTENTIALVARIABLES
NAME OF THE VARIABLE RANK VALUES
X-GRA 1
M-OCC 4.86
SAREA-SEC 5.86
F-OCC 6.57
HSAREA 6.86
PTUI-HSC 6.86
GRP-HSEC 7.86
COMM 7.86
SAREA-ELE 8
P-EDU 10.57
5.
RESULTS
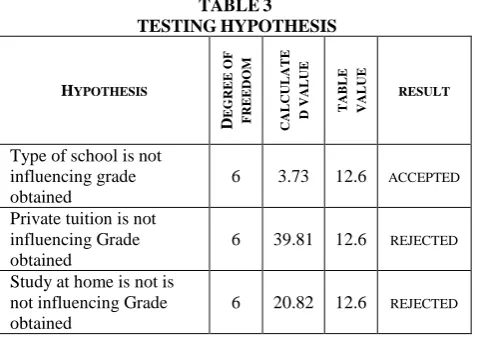
The following are the attributes and the corresponding hypothesis to verify the relationship between the attributes. Chi-square test (2) is one of the simplest and most widely used parametric as well as non parametric tests in statistical work. The Chi-square value is used to judge the significance of population variance. We used Chi-square test to find the significance between the different attributes and grade obtained by student. The results of hypothesis testing is given in Table 3.
TABLE3 TESTINGHYPOTHESIS
HYPOTHESIS
D
EGREE
OF
FREEDOM
CALCULATE D
VALUE TABLE VALUE RESULT
Type of school is not influencing grade obtained
6 3.73 12.6 ACCEPTED
Private tuition is not influencing Grade obtained
6 39.81 12.6 REJECTED
Study at home is not is not influencing Grade obtained
6 20.82 12.6 REJECTED
Parent education is not is not influencing Grade obtained
6 18.73 12.6 REJECTED
Higher secondary school area is not is not influencing Grade obtained
3 41.79 7.81 REJECTED
Private tuition at secondary level is not is not influencing Grade obtained
4 18.56 9.49 REJECTED
School area at secondary level is not is not influencing Grade obtained
2 12.67 5.99 REJECTED
For this study, the data set was tested with five different classification algorithms: NaiveBayes, Multilayer Perception, SMO, J48, REPTree . In this study, the correctly classified instances with different algorithms were compared. The overall accuracy of classifiers’ performance on our dataset are shown in the Table 4.
TABLE4 COMPARISONSOFALGORITHMS
Regarding the individual classifiers, Multi Layer Perception has the best accuracy with 72.38%. The accuracy levels for each grade predicted by the different classifiers are given in the Table 5.
TABLE 5
PREDICTIONPERFORMANCEOFCLASSIFICATION
ALGORITHMS
From the results, it was proven that Multi Layer Perception (MLP) classifier is most appropriate for predicting student performance. MLP gives 72.38% prediction which is relatively higher than other algorithms.
6.
CONCLUSION
AND
FUTURE
WORK
Data mining techniques allow a high level extraction of knowledge from raw data, offering interesting possibilities for the education domain. In this study a model was developed based on some selected input variables collected through questionnaire method. After testing some hypothesis, some of most influencing factors were identified and taken to predict Algorithms/
Grades
Naïve
Bayes MLP SMO J48
REP TRE
E
O 00.0 100 00.0 00.0 00.0
A 25.0 40.5 37.5 25.0 25.0
B 22.2 50.0 16.7 11.1 05.5
C 27.6 20.7 31.0 10.3 17.2
D 52.8 47.2 72.2 83.3 72.2
E 50.0 60.0 20.0 50.0 50.0
F 33.0 83.3 29.0 30.0 18.0
NAIVE
BAYES MLP SMO J48 REPTREE
[image:4.595.49.287.342.481.2] [image:4.595.49.289.596.765.2]the grades. Data mining techniques are applied to predict the performance of the students and found that Multi Layer Perception algorithm is best suited to predict the grades. We designed a tool using .NET framework to predict the grade of the student if we give the various parameters as input. Out tool achieved an accuracy of 72% which shows the potential efficiency of Multi Layer Perception algorithm.
The obtained results from hypothesis testing reveals that type of school is not influence student performance and on the other hand, parents’ occupation plays a major role in predicting grades. As a result, having the information generated through our experiment, institution would be able to identify students at risk early, and provide better additional training for the weak students. Therefore, it seems to us that data mining has a lot of potential for education. Furthermore, we intent to enlarge the experiments to collect additional features like psychological factors which disturb the students, motivational efforts taken by the teachers and e-learning materials available to the students.
7. REFERENCES
[1] M.Ramaswami and R.Bhaskaran, “A CHAID Based Performance Prediction Model in Educational Data Mining”, International Journal of Computer Science Issues Vol. 7, Issue 1, No. 1, January 2010.
[2] Nguyen Thai-Nghe, Andre Busche, and Lars Schmidt-Thieme, “Improving Academic Performance Prediction by Dealing with Class Imbalance”, 2009 Ninth International Conference on Intelligent Systems Design and Applications.
[3] L.Arockiam, S.Charles, I.Carol, P.Bastin Thiyagaraj, S. Yosuva, V. Arulkumar, “Deriving Association between Urban and Rural Students Programming Skills”, International Journal on Computer Science and Engineering Vol. 02, No. 03, 2010, 687-690
[4] P. Cortez, and A. Silva, “Using Data Mining To Predict Secondary School Student Performance”, In EUROSIS, A. Brito and J. Teixeira (Eds.), 2008, pp.5-12.
[5] S. B. Kotsiantis, C. J. Pierrakeas, and P. E. Pintelas, “Preventing student dropout in distance learning using machine learning tachniques”, In proceedings of 7th International Conference on Knowledge-Based Intelligent Information and Engineering Systems (KES 2003), pp. 267- 274, 2003. ISBN 3-540-40803-7.
[6] Kalles D., Pierrakeas C., Analyzing student performance in distance learning with genetic algorithms and decision trees, Hellenic Open University, Patras, Greece,2004.
[7] Woodman, R. (2001). Investigation of factors that influence student retention and success rate on Open University courses in the East Anglia region. M.Sc. Dissertation, Sheffield Hallam University, UK.
[8] Vandamme, J.-P., Meskens, N., & Superby, J.-F. (2007). Predicting academic performance by data mining methods. Education Economics, 15(4), 405-419.
[9] B. Minaei-Bidgoli, G. Kortemeyer, and W. F. Punch, “Enhancing Online Learning Performance: An Application of Data Mining Method”, In proceedings of The 7th IASTED International Conference on Computers and Advanced Technology in Education (CATE 2004), Kauai, Hawaii, USA, pp. 173-8, August 2004.
[10]Larose, D. T., “Discovering Knowledge in Data: An Introduction to Data Mining”, ISBN 0-471-66657-2, John Wiley & Sons, Inc, 2005.
[11]Chapman, P., Clinton, J., Kerber, R., Khabaza, T.,Reinartz, T., Shearer, C. and Wirth, R.. “CRISP-DM 1.0 : Step-by-step data mining guide, NCR Systems Engineering Copenhagen (USA and Denmark), DaimlerChrysler AG (Germany), SPSS Inc. (USA) and OHRA Verzekeringenen Bank Group B.V (The Netherlands), 2000”.
[12]Z. N. Khan, “Scholastic Achievement of Higher Secondary Students in Science Stream”, Journal of Social Sciences, Vol. 1, No. 2, 2005, pp. 84-87.