Boosting Data Exchange Efficiency using Developed
Multi-Layer Simulation Models
John S. N.
Covenant University Department of Electrical &
Information Engineering,Ota,Nigeria
Anoprienko A. A.
Donetsk National TechnicalUniversity, 58, Artyem Street, Donetsk,
83000, Ukraine
Ndujiuba C. U.
Covenant University Department of Electrical & Information Engineering, Ota, Nigeria
ABSTRACT
Rapid developments in communication and information technologies and the ever growing network user’s demands have made network traffic efficiency a prominent problem in today’s internet. As users come and go, so do the packets they send: Internet performance is therefore largely governed by these inevitable natural fluctuations, it is therefore of great importance to develop more advanced as well as robust methodologies and models to deliver manageable, stable and reliable services in order to fulfill the ever-growing demands for the QoS requirements in the networks. The basic task of research and simulation of network infrastructure is to work out the recommendations for the most rational use of computer network resources. The necessity herein arises upon both at development of new network application and deployments, and also, during administration or development of the existing networks. This paper, therefore, presents a new method of boosting data exchange efficiency using developed multi-layer simulation models to suite any network traffic with samples.
General Terms
Boosting Data Exchange Efficiency
Keywords:
Data exchange, Multi-layer Simulation, Network Traffic, Protocol of TCP/IP.
1. INTRODUCTION
In the present information era, the most effective variants in the development and research of computer networks include mode of data exchange, and more specifically for this situation we considered using simulation in designing the systems[1, 2]. Boosting of data traffic has emerged as a critical property that protocol analysis can no longer ignore. In order to attain the required boosting or scaling phenomena in data exchange observed in aggregated TCP/IP traffic, we developed a multi-layer simulation model that captures the protocol of TCP/IP. Also, a well-developed methodology was proposed and used to effect the efficiency of data exchange. The essence of the offered method consists in sharing the dependences obtained from analytical and simulated method, in the determination of the most efficient mode of data exchange [3, 14].
Described method of increasing the efficiency of network data exchange based on using the developed models and dependence results are shown. Also shown, is the jointly developed corresponding methods of different means in designing and analyzing thenetwork infrastructure with the purpose of providing an increase in the efficiency of data exchange based on the ТСР/IР protocols stack.
2. ANALYSIS OF EXISTINGSOFTWARE
PROGRAMMING
There are few numbers of software programming for analyzing and modeling of a network which substantially differ in their capabilities and costs. As a rule, all modern programs of this type are equipped with facilities of visual planning which allows building of flow diagrams of the networks with the help of embedded special libraries infrastructure network elements. A necessity herein arises upon both at development of new network application and deployments, and also, during administration or development of the existing networks. During the analysis of efficiency in the networks performance in general, it is very necessary to look at the following tasks: Determine the network performance at the given topology and workload.
Analyse the change in bandwidth to the change in the workload on the networks; Analyse the change of bandwidth of the network during change in topology; and selection of parameters of data exchange to provide maximum bandwidth capacity of the network for a given topology and workload.
The basic elements generally, from which the networks simulation system consist are:
Library of models; run-time environment; Sub-system of workload task; system of task topology network; Sub-system analysis of simulation results. Thus, the library of models is the aggregate structural elements models and can be compared on the following criteria: Possibility of designing with default network devices; Possibility of creating device models to suite the users; Class numbers in the designing objects; Scaled of modeling time; Accuracy and accordance of models for real time objects.
The criteria for comparison as an example; the programming product may be looked into as the presence of subsystem for the independent making of recommendations on the rational use of the resources just as in case of NetMaker XA (Make Systems) and NetCracker Professional Systems [6].
systems, effective unification of difficult logical control systems and investigation of the Simulink-models. By Stateflow it is possible quickly to develop the graphic models of the systems guided by events, using an automata theory with the eventual number of the states, and also – formalism of diagrams of the state and notation of stream diagrams. The Stateflow, Simulink and MATLAB [6, 8] combination creates the unique integrated environment in designing, which is possible to design, imitate and analyze the difficult dynamic systems, one of this varieties of which there are modern network structures. The form of S-function can work both with continuous and with the discrete and hybrid systems. As a result almost all models of SIMULINK can be described as S-functions. Thus the vector of the states of model can contain the continuous states, discrete states or combination of both.
The systems considered above, allows an effective solving of complex problems related to development and research of networks and network application. In particular, none of the transferred programmatic facilities allows in full to control efficiency of data exchange in a network and produce concrete recommendations for the increase of the network productivity.
3. ANALYZING THE BASIC METHODS
OF INCREASING THE EFFECTIVENESS
OF DATA EXCHANGE
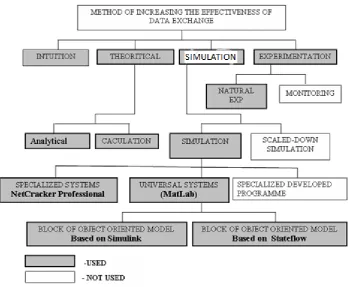
The Figure 1 shows the classification of basic methods in increasing the effectiveness of data exchange based on the protocol of TCP/IP stack. The bolded part of the classification methods are the ones that were used in the research while the un-bolded methods were not used.
Increasing the efficiency of data exchange in computer networks based on the ТСР/IР protocol suite requires difficult decision associated with different problems in which we have: choice and optimization of the network topology structure, optimization of the bandwidth capacity of communication channels, choice of routers, choice of methods in management control of data streams and determination of the management parameters, analysis of the buffer memory in commutation and router with choice of strategy in performance.
[image:2.595.123.473.350.637.2]In the process of this research, in investigating the functional performance of computer networks depending on the modes of data exchange in them at different levels, the use of different services for designing and simulating the networks were made – simulation system of Matlab/Simulink® (universal), NetCracker Professional® (specialized), and also the analytical method.
Figure 1. The classification methods of increasing the effectiveness of data exchange.
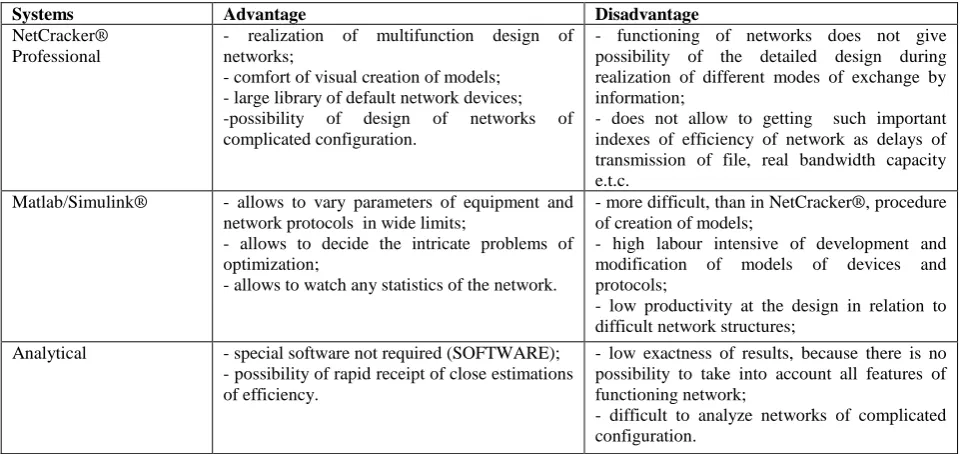
The advantage and disadvantage of the methods were looked into in order to choose the most rational among the chosen methods of increasing the effectiveness of data exchange, as
Table 1.Advantages and disadvantages of different methods in designing and analyzing computer network environment of the imitation design Matlab/Simulink® and NetCracker® in research of functioning of distributed computer networks.
Systems Advantage Disadvantage
NetCracker® Professional
- realization of multifunction design of networks;
- comfort of visual creation of models; - large library of default network devices; -possibility of design of networks of complicated configuration.
- functioning of networks does not give possibility of the detailed design during realization of different modes of exchange by information;
- does not allow to getting such important indexes of efficiency of network as delays of transmission of file, real bandwidth capacity e.t.c.
Matlab/Simulink® - allows to vary parameters of equipment and network protocols in wide limits;
- allows to decide the intricate problems of optimization;
- allows to watch any statistics of the network.
- more difficult, than in NetCracker®, procedure of creation of models;
- high labour intensive of development and modification of models of devices and protocols;
- low productivity at the design in relation to difficult network structures;
Analytical - special software not required (SOFTWARE); - possibility of rapid receipt of close estimations of efficiency.
- low exactness of results, because there is no possibility to take into account all features of functioning network;
- difficult to analyze networks of complicated configuration.
The analysis in Table1 shows the advantages and disadvantages of the means of simulating and analyzing networks with an indication of their effective usage. So, in particular, it is necessary to use in the initial stage; the analytical method from the research results. For subsequent stages the results obtained from the analytical method can then be verified through simulation method. Thus, in the case of using standard network technologies at the low detailed analysis, NetCracker® [6] environment is recommended, and during research of computer networks based on non-standard protocols and devices and (or) it is necessary for detailed analysis to use Matlab/Simulink®[6, 8]. However, in order to attain most effective usage of the recommended methods, it is necessary within the framework of the offered methods in this research work “model-analytical method” to maximally taking advantages of each approach. Figure 2 shows the structural model providing the offered method indicating the used simulation systems. The specialized system of NetCracker® Professional allows, in particular, to realize the simulation models of all levels of the network, however much more detailed researches in most difficult layer of Open System Interoperability (OSI) (channel and transport layer) require using more flexible systems - Matlab/Simulink® and Matlab/Stateflow®.
Figure 2.Structural Model of the offered method.
At development of the distributed computing and designing environments based on the modern infrastructure of the Internet acquires important value is increase the efficiency of network interaction at all levels of the TCP/IP stack: beginning from a physical level and concluding by the fast-acting of applications at
Physical level. However, it is from the above listed levels that we have the most significant difficult character dependence of bandwidth capacity on the chosen modes of data exchange, in connection with this; multilevel simulation was designed to tackle these levels cases. The developed model of link layer allows in defining basic descriptions and exposing the most critical areas of networks in different working mode. For creating this model was the developing and realizing as in the form of Simulink blocks model of objects in two types: «nodes» (Host) and «Channel» (Bus).
The developed structural model of data link layer allows defining the basic descriptions and exposing the most critical areas in network with different modes of operations. On the side of transport and network interrelations layers, a model were developed and realized in a SIMULINK® blocks model of three objects types: Host,Bus and Gateway – model of data channel between Local Area Networks with possibility exit to the global network.
In connection with this, the basic method in researching the network efficiency was using a simulation means both with the use of the specialized tools, and the universal systems MATLAB® to investigate the effectiveness of data transmission and maximizing their productivity.
[image:3.595.66.278.588.741.2]In order to realize this method, the following execution sequences were offered:
1. Preliminary determine the characteristic of different modes of data exchange in the explored network environment through developed models of physical and transport layers or the achieved dependences obtained from the research work [5, 7, 14].
2. Determine possible variants of network structure/topology or network application.
3. Investigating the different variants in realizing the critical productivity distributed computer networks using the simulation technique system of NetCracker® Professional.
4. Clarification where necessary a separate characteristic of the modes of data exchange in a critical throughput fragments of an explored network environment with the help of the developed models of physical and transport layers or result obtained from their dependences.
5. Making recommendations on the most rational organized mode of data exchange in a computing network within the framework of the explored network application.
In the principle, the following characteristic were examined: Network structure, having the following characteristic:
nу – number of nodes in the network, QN – nominal bandwidth in the channel, Mbps (Ethernet, Fast Ethernet, e.t.c.). Workload in the network (determine by the features of the distributed computing system):
I – common information content subjected to transmission along the period of time, Mbytes, Т – the generating period of information, sec.
4. ESTABLISHING POSSIBLE
VARIANTSOF THE NETWORK
STRUCTURE
Important characteristic of the distributed computer network are their structures (topology). The method of researching in computer network based on the ТСР/IР protocol requires determine the most effective topology structure, within the framework of which maximum burst performance can be achieved from managing the modes of data exchange. The decision touches topology of the network of which lies the network characteristic [2, 4, 12]. The following variants of local Area Network structure are possible from the proposed methods:
Bus or star network type for small or medium Local Area Networks;
Difficult network for medium and large or complex Corporate Networks.
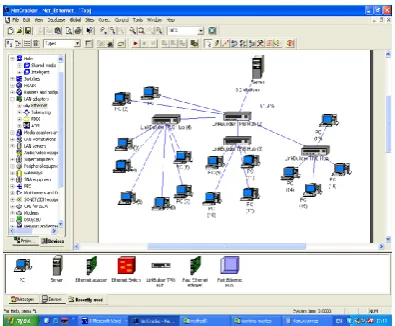
Different multilayer models of both types (see examples on the Figure 3 and Figure 4) are realized in this work, which allows in detail to take into account the features effect of topology on efficiency functioning of network in different modes of data exchange.
5. RESEARCH ON COMPUTER
NETWORKS USING SIMULATION
TECHNIQUE
For the exposure of critical regions of network or “bottlenecks” it is necessary to simulate the functionality of the network at a given workload and changing the values of file sizes and the frequency of data exchange (data stream rate):
c T
n Q L
;рац рац
L
L
L
min
max; рац рац max min
.where, L – file size, QT – desirer bandwidth, τ – data stream rate, nc – number of node.
[image:4.595.322.542.226.379.2]The mode of operations in distributed computer networks affected by the critical level of workload which is corresponds to the “bottleneck” of the network, results into degradation of bandwidth capacity of the network [11, 12, 13]. The variants of chosen network structure on the second stage of the network execution sequence in the methodology are explored by using simulation technique of NetCracker® Professional package. In this case, the “bottlenecks” areas of the network with the large level (nearly 100%) of utilization are exposed. The most optimum network are the network structures with less “bottlenecks” or completely absence in the conditions of obtaining high and stable network efficiency.
[image:4.595.324.522.409.572.2]Figure 3.Example Design Structure of Local Area Network.
Figure 4 Example design structure of average and large corporate networks.
6. SELECTING RECOMMENDATIONS ON
BURSTING DATA
EXCHANGEEFFICIENCY
It is suggested that rational organization of data exchange is achievable by file sizes of the type [ min, max]
рац рац
L
L and data stream
rate
[
,
max]
minрац рац
overloading the network using this index: QT< 0,55QN as shown
[image:5.595.72.291.97.179.2]in Figure 5, obtained in the research work [4].
Figure 5.Establishing the depending border of optimum performance of the network.
In realizing this, a specialized system on simulation NetCracker professional was deployed. Thus for this, a research on workload of an external channel was carried out on the corporate intranet using the following parameters: size of the send files, number of connections, and time domain between the transmissions of the files.
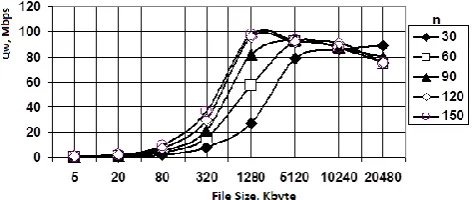
[image:5.595.307.542.112.266.2]Developed in the process of simulation, a model containing 4 levels and consists of models of 11 campuses/buildings networks in complication consist of 1100 networks/nodes [3,4, 14]. Figure 6 shows the obtained result from which it is seen in data efficiency research work, how with increase of send file size (at a fixed parameter of data flow), workload on a channel and effectiveness bandwidth capacity increase toward maximum level (ranging from 1280 to 10240 Kbytes for different networks), henceforth affects the effectiveness bandwidth capacity and shows a fall in the bandwidth from 5120 Kbytes. The achieved dependences allow defining, how concretely an increase in send file sizes affects the effectiveness of bandwidth capacity on a network.
Figure 6. Dependence graph of bandwidth capacity of external channel on a corporate network based on an average
file size and different number of network connections
The dependence bandwidth capacity of external channel on a corporate network using an average file sizes from different number of network connections and constant to every dependence workload on a channel is shown in Figure7.
Table 2. Shows the dependant bandwidth capacity of external network using an average file sizes from different number of network connections.
File Size, Kbyte
Number of Connection (Users)
30 60 90 120 150
Workload Bandwidth Capacity (Mbps)
5 100 100 100 100 100
20 100 100 100 100 100
80 100 100 100 100 100
320 99.4 100 100 100 100
1280 96.3 97.3 97.7 97.9 97.5 5120 79.7 95 95.9 92.2 92.3 10240 72.6 80.3 86.5 90.5 81.8
20480 52.2 58.8 60 57 53.4
The result of the research work shown on Table 2 is graphically represented in Figure 7.From the graph it is seen that a change of send file size from 1280 – 5120 Kbytes have no substantial influence on the bandwidth capacity of the external channel both at the incomplete workload of the channel (15 connections, QwT
= 0.64), and at the workload (30 -150 connections, the value of QwT = 0.15).
Figure7.Dependence bandwidth capacity of external channel on a corporate network based on an average file size, different number of network connections and workload capacity.
On further increase of workload to the channel the bandwidth capacity of channel begins to fall (in this case at an average send files size more than 5120 Kbytes). Thus, for a corporate network at a given condition of the maximum send file size exceeding of which results in the substantial decline in the efficiency of data exchange.
With the purpose of approbation of the offered method and method of their realization, we considered the whole examples of their practical application for the research work results. The most typical practical examples are the results shown below:
0,55QN Q
Overloading Normal
[image:5.595.56.293.436.536.2]Example 1
We consider the computer network of the type represented in Figure 4 with the dedicated computing server and client workstations realizing in the local computing.
Given are the following values:
ny= 5; average volume of the generated blocks of information I = 50 Kbytes; average period of data stream Т= 0,1seconds, maximum possible tolerance delay of the information Тmax= 10 seconds.
“We are to determine the parameters of the mode of data exchange, by providing maximum efficiency functioning of the network at the given condition”
1.1. We determine the value of the required bandwidth capacity:
T
I
Q
T
= 500 Кbps = 4 Мbps.Concluded from the obtained result, we realized that during Ethernet technology network, it is possible to design it using QN
= 10Мbps. In this case QT/QN = 0,4 << 0.55, that provides
possibility exploiting the network in the mode of maximum performance efficiency in observing certain requirements on organization of the mode of data exchange[11, 13].
1.2. In accordance with the dependences obtained in research work, the recommended minimum sent data frames/blocks would be as follow: Lminрац
0.0507QT-0.7833
= 0.0507 х 500 –0.7833 = 24.6 (Kbytes).
In accordance with the dependences obtained in the research work, the recommended maximum allowed file sizes at
у
c
n
n
= 5 would be рацL
max = 512
10
Q
QN= 512 х 10/10 = 51 (Kbytes).
In accordance with the dependences obtained in the research work, the recommended minimum period of data exchange would be as follow:
T c рац рац Q n L min min
= 24.6 х 5/500 = 0.25(seconds).
In accordance with the dependences obtained in the research work, the recommended maximum period of data exchange would be as follow:
T c рац рац
Q
n
L
max max
= 512 х 5/500 = 5.12 (seconds), that does not exceed Тmax= 10 seconds.This example enables us to determine the range characteristic modes of data exchange, of which the maximum efficiency functioning of network can be obtained [5, 14] (also see Figure 5 and 8).
Thus, in this example with the desired bandwidth capacity of 500 Кbps, the practical maximum efficiency functioning/performance of the network acceptable would be of the sent file sizes through each of the 5 nodes ranging from 24.6 to 512 Kbytes with an interval time from 0.25 to 5.12 seconds. On exceeding the range of the recommended sent data block sizes, there would be the substantial decline on the efficiency functioning of the network and/or network application because of an increase in the coefficient loss of bandwidth resulting from header information to the data blocks and/or collision and delays connecting to the replication.
Example 2
Given: QT = 1 Мbps = 128 Кbps; L = 0,008 Mbytes = 1 Kbytes;
“It is required to determine at what file sizes and how far can it be to increase the efficiency functioning of network at QN = 10 Mbps and on condition that the average delay of transferring data blocks must not exceed 0.05 seconds”.
From the research work [5], we obtained that, in spite of the relatively low value of QTN because of frequent transmission of
data blocks with small sizes the correlation Т2/Т would approach
one, which means that the network performance mode approaches/near overload.
The current value of the domain time interval between the sent data blocks at the given condition would becomeL/QT = 1/128 = 0.01 (second), that substantially less that the given limitation delay of data blocks transmission. Consequently, there is possibility that due to an increase in the interval of transmission and corresponding consolidation of the sent data blocks, possible increase to network performance.
To determine the most effective sent data block sizes at a given QT we took an advantage of the dependence given from the
equation 1 in the research paper, which ensues, that the recommended value of Lmin = 6 Kbytes. In this case the correlation Т2/Т = 0.2, meaning that the network performance
already in the second mode, i.e. mode of the burst performance [5].
The current value of domain time between the transmission of data blocks at the given conditions would make L/QT = 6/128 = 0.05 (seconds). The further increase of L practically would not have any effect on the correlation value of Т2/Т, but the interval of data blocks transmission would start to exceed the acceptable average delay time which on the condition must not exceed 0.05 (seconds).
Example 3
Given: nc = 15, QN = 10 Mbps, QT = 6 Mbps = 768 Kbps, L1 =
2048 Kbytes.
“It is required to determine at what file sizes and for how far can we increase the efficiency functioning of network, and whether a condition can be well-to-do, that the average delay blocks transmission must not exceed one second.
The current value of time domain between the data blocks transmission for the given condition would be L1/ QT = 2048/768
= 2.7 (second), that knowingly exceeds the indicated delay in one second.
From the research result [4], we obtained, that in this case QW1 =
3.71 Mbps, and from another research result [5], we obtain, that QWT1 =0.60. In determine the most effective sent data blocks
size, based on the given QT we used the result obtained in the
research work [4], which ensues, that QWT2 = 0.95 at L2 = 512
Kbytes. In this case QW2 = 5.98 Mbps i.e. in practical equal to
the value of QT, indicated that the actual network functioning is
in mode of the burst performance.
The current value of time domain between transmission of data blocks at the given conditions would make L2/QT = 512/768 =
0.67 (seconds), which fully satisfies the requirement about the delay not exceeding one second.
Taking into account that QWT2/QWT1 = 0.95/0.60 = 1.58, we can
ascertain that in this case the efficiency of data transmission in a computer network was increased by almost 60%.
Thus, the considered examples shows that the offered analytical method of increase the efficiency of data exchange allows quickly enough and exactly to determine the parameters required for data exchange efficiency, and also – to work out a concrete suggestions on the modes of data exchange with the purpose of increase the efficiency functioning of the network.
Example 4
Given: nc = 15, QN = 10 Mbps, QT = 6 Mbps = 768 Kbps, L1 =
2048 Kbytes.
The current value of time domain between the data blocks transmission for the given condition would be L1/ QT = 2048/768
= 2.7 (second), that knowingly exceed the indicated delay in one second.
From the research result [4], we obtained, that in this case QW1 =
3.71 Mbps, and from another research result [4], we obtain, that QWT1 =0.60. In determine the most effective sent data blocks
size, based on the given QT we used the result obtained in the
research work [7], which ensues, that QWT2 = 0.95 at L2 = 512
Kbytes. In this case QW2 = 5.98 Mbps i.e. in practical equal to
the value of QT, indicated that the actual network functioning is
in mode of the burst performance.
The current value of time domain between transmission of data blocks at the given conditions would make L2/QT = 512/768 =
0.67 (seconds), which fully satisfies the requirement about the delay not exceeding one second. Taking into account that QWT2/QWT1 = 0.95/0.60 = 1.58, we can ascertain that in this case
the efficiency of data transmission in a computer network was increased by almost 60%.
The considered examples shows that the offered method of increasing the efficiency of data exchange in a computer network, allows quick enough and exact parameters in determine the efficiency of data exchange, and also produces concrete suggestions on correction of the modes of data exchange with the aim of increase of the efficiency performance of the network. The data processing allowed, for example, in obtaining the dependence of minimum rational file size corresponds to the network performance from the network workload as shown in the equation below and in Figure 8.
КbyteLрацmin 0.0507QT-0.7833 ,
The Figure8 shows the dependence of minimum coefficient value
T
T2 on workload of the networks. Obviously, for example, at the
workload more than 5.5 Мbps, the distributed computing network works in the mode of limitation of productivity of the bandwidth capacity of the network (i.e.
T
T2> 1). It is necessary as
[image:7.595.78.273.513.652.2]an exception of this mode, that workload be made not more than 55% from data stream rate in theLocal AreaNetwork. The obtained results from the research allowexecuting concrete estimation of the inherited losses from the experiment.
Figure 8. Dependence of minimum value T
T2 on workload of
a network in the distributed computing network (at QN = 10
Мbps).
7. CONCLUSION
The work presented in this paper has offered a new method of boosting data exchange efficiency using developed multi-layer simulation models to ensure rational and efficient use of computer network resources.
Thus, the considered examples show that the offered analytical method of increasing the efficiency of data exchange allows quickly enough and exactly to determine the parameters required for data exchange efficiency, and also to work out a concrete suggestions on the modes of data exchange with the purpose of increasing the efficiency functioning of the network.
As an extension to this work, it is important to determine the impact onnetwork performance for various network topologies and workload. This is recommended for future work.
8. REFERENCES
[1] Goredetki A.A., Zaborevski V.S.: Informatics. Fractalprocesses in computernetworks. Saint Petersburg,SPBGTU,102 pages 2000.
[2] John Heidemann, Katia Obraczka, and Joe Touch. Modeling the performance of HTTPover several transport protocols. ACM/IEEE Transactions on Networking, 5(5): pages 616– 630, October 1997.
[3] John S.N., Anoprienko A. A., Okonigene R.E.: Developed Algorithm for Increasing the Efficiency of Data Exchange in a Computer Network: International Journal of Computer Applications (0975 – 8887), Volume 6– No.9, pp. 16-19, September 2010.
[4] John S.N. “Increasing the efficiency of data exchange in a computer networks based on the protocol of TCP/IP suite” PhD Dissertation, Donetsk National Technical University, Donetsk, Ukraine, October, 2005. Thesis in search for PhD. degree on specialty 05.13.13. – Computer, Computing Systems and Networks. Donetsk National Technical University, Donetsk, 2005. 181pages, Bibliography: L. 141-150. www.lib.ua-ru.net/diss/cont/258169.html.
[5] John S.N., Atayero A. A.: “Simulation of the Effect of Data Exchange Mode Analysis on Network Throughput», European Journal of Scientific Research ISSN 1450-216X, Vol.No.2 (2008), pp.244-252, © EuroJournals Publishing, Inc. 2008
[6] Ponomarenko L.A., Shelkunov V.I., Sklarov A.A. Instrumental means of projectionimitation simulation and analysis of computer networks. – Kiev: Science publication, 2002. – 508 pages.
[7] John S.N., Ibikunle F.A., AdewaleA.A“Performance Improvement of Wireless Network Based on Effective Data Transmission”, The International Conference on Wireless, Mobile and Multimedia Networks organized by IET, 11-12 January 2008, IEEE Xplore Digital Library JournalISSN 0537-9989, pp.134-137, @ IEEE Xplore Digital Library, 2008, USA.
[8] Simulink. Design and simulate continuous- and
discrete-time systems
<http://www.mathworks.com/products/simulink2012.
[9] Zaishenko Y.P., Gonta Y.V.: optimization of Computer networks, Kiev, «Technika», – 168 pages, 1986.
[10] Zaishenko Y.P.,,Zaishenko Е.Y., Pospelov I.V.: Complex programs analysis and synthesis structure of regional and global computer networks // Control Systems and machines, № 5/6, 71-87pages, 2000.
Dynamic Systems (SCAD-2007). Volume 123. Donetsk, 2007, pp.331 – 339, Ukraine
[12] Mahmoodi, T.; Friderikos, V.; Holland, O.; Hamid Aghvami, A.; , "Cross-Layer Design to Improve Wireless TCP Performance with Link-Layer Adaptation," Vehicular Technology Conference, 2007. VTC-2007 Fall. 2007 IEEE 66th , vol., no., pp.1504-1508, Sept. 30 2007-Oct. 3 2007 doi: 10.1109/VETECF.2007.320
[13] D. X. Wei, C. Jin, S. H. Low, and S. Hegde. Fast TCP: motivation, architecture, algorithms, performance. IEEE/ACM Trans. Netw., 14(6):1246–1259, 2006.
[14] Anoprienko A.Y., John S. N., Nuri A.: “Multilevel Simulation of Networks based on the protocols of TCP/IP stack in Matlab/Simulink Environment”. Information,
cybernetics and Computing Engineering: Donetsk (DonNTU, Vol. 39, pp. 271-279, 2002), Ukraine.
[15] Daniel A. Menasce, Virgilio A. F. Almeida, “Capacity Planning for Web Services Metrics, Models and Methods, published by Pearson Education, Inc. publishing as Prentice Hall PTR Upper Saddle, 2003