An Efficient Decision Tree Model for Classification of
Attacks with Feature Selection
Akhilesh Kumar Shrivas
Research Scholar, CVRU,Bilaspur (C.G.), India
S. K. Singhai
Govt. Engineering CollegeBilaspur (C.G.), India
H. S. Hota
Guru Ghasidas University Bilaspur (C.G.), India
ABSTRACT
Application of Internet is increasing rapidly in almost all the domains including online transaction and data communication, due to which cases of attacks are increasing rapidly. Also security of information in victim computer is an important need, which requires a security wall for identification and prevention of attacks in form of intrusion detection system (IDS). Basically Intrusion detection system (IDS) is a classifier that can classify the network data as normal or attack. Our main motive in this piece of research work is to develop a robust binary classifier as an IDS using various decision tree based techniques applied on NSL-KDD data set.
Due to high dimensionality of data set, ranking based feature selection technique is used to select critical features and to reduce unimportant features to be applied to deduct random forest model, which is obtained as one of the best model. Empirical result shows that random forest model produces highest accuracy of 99.84% (Almost 100%) with only 19 features. Performance of the model with reduced feature subsets are also evaluated using other performance measures like true positive rate (TPR), false positive rate (FPR), precision, F-measure and receiver operating characteristic (ROC) area and the results are found to be satisfactory.
Keywords
Gain ratio feature selection, Binary class, Multi class, Intrusion detection system (IDS), NSL-KDD, Random forest.
1.
INTRODUCTION
Nowadays, with rapid development of internet and intranet in everyday life, computer security has become one of the most important issue to secure data and information from intruders.IDS is responsible for monitoring the network traffic for any suspicious events and raises alarm to take proper action against intrusion. An intrusion detection system may be of three types: network based intrusion detection system (NIDS), host based intrusion detection system (HIDS) and hybrid intrusion detection system. Intrusion detection system (IDS) is one of the most important research area for network and computer security due to efficient utilization of computer network and increasing wired and wireless infrastructure. There are various authors who have applied different data mining based classification techniques that can classify data as normal or attack. IDS may be either multi class or binary class. Multi class classifier classifies the network data as different attacks and normal data. There are some authors who have worked on multi class classification problem. V., Balon Canedo et al. [1] have proposed a new method known as KDD winner consisting of discretizations, filters used on various classifiers like Naive Bayes (NB), C4.5.They have achieved highest accuracy of 99.45%. Saurabh Mukharjee et al. [7] have discussed new feature reduction method known as
feature validity based reduction method (FVBRM) applied on one of the efficient classifier Naive Bayes on reduced data set with 24 features for intrusion detection. Result obtained in this case is better as compare to case based feature selection (CFS), gain ratio (GR), info gain ratio (IGR) to design efficient and effective network intrusion detection system. Y., Li et al.[5] have applied various feature reduction methods on KDD99 data set. They have obtained 98.62% accuracy using gradually feature reduction technique with 19 features through support vector machine and 10-fold cross validation. Koc, L. et al. [4] have introduced Hidden Naive Bayes (HNB) model with promotional k-interval discretization and INTERACT feature selection method. They have compared their proposed model with traditional Naive Bayes method. A recent literature by Ibrahim, Laheeb M. et al [3] focuses on self organization map (SOM) model which compare detection rate in between two data sets: KDD99 and NSL-KDD. Detection rate of SOM with KDD99 is 92.37% while it is 75.49% for NSL-KDD data. Some other authors have worked on binary classification problem which can classify data into two class like normal and attack. Mrutyunjaya Panda et al. [8] have suggested hybrid technique with combination of random forest, dichotomies, and ensembles of balanced nested dichotomies (END) for binary class problem, which gives detection rate 99.50% and low false alarm rate of 0.1%. They have evaluated the performance of model with other measures like F-value, precision and recall. There are various authors who have worked on various techniques and applied feature selection techniques as one of the important component. Literature review revealed that feature selection is one of the most essential parts of development of IDS.
In this paper we have explored decision tree based data mining techniques to classify the data as normal or attack as two class classification problem. There are many decision tree based classification techniques, like C4.5, CART, random forest and others have been applied to develop IDS. In order to verify the models, data set is partitioned in six different partitions, since machine learning techniques highly depend upon training and testing size. After simulation, a suitable model is chosen based on error measures to be used with reduce feature subset data. Random forest is the model which produces highest accuracy for binary class data. Features arereduced gradually based on its rank and it has been observedthat the accuracy produced by the model is 99.84% (almost 100%) with only 19 features.
2.
DATA SET
networks such as U2R and R2L attacks. In addition the existence of these repeated records in the test set will cause the evaluation results to be biased by the methods which have better detection rates on the frequent records.
In this experiment we have used 25192 records of NSL-KDD data set. This data set contains one type of normal and four
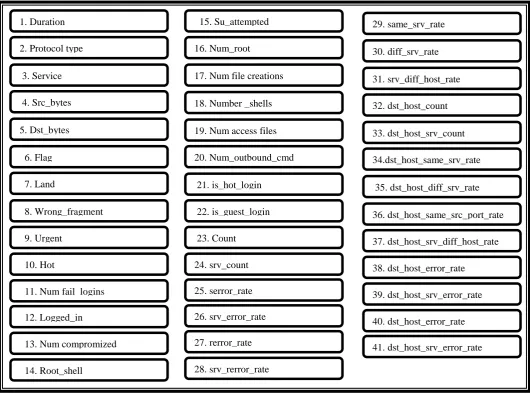
[image:2.595.48.579.161.555.2]types of attack data like DoS, R2L, U2R and Probe. Experimental work is performed with two class data set: normal and attack for development of IDS as binary classifier. The features of NSL-KDD data set are similar to that of KDD99 data set with 41 features as shown in figure 1.
Fig 1: Feature of NSL-KDD Data Set
3.
DECISION TREE TECHNIQUES
We have used various decision tree based classification techniques that can be used to classify data as normal or attack .Techniques are explained in more detail as below:
3.1
C4.5
C4.5 [10] is an extension of ID3 that accounts for unavailable values, continuous attribute value ranges, pruning of decision trees and rule derivation.C4.5 is classification algorithm that can classify records that have unknown attribute values by estimating the probability of various possible results unlike CART, which generates a binary decision tree.
3.2
Random Forest
Random forest (or RF) [9] is an ensemble classifier that consists of many decision trees and outputs the class that is the mode of the classes output by individual trees. Random
forests are often used when we have very large training datasets and a very large number of input variables.
3.3
Iterative Dichotomizer 3 (ID 3)
Iterative dichotomizer 3[10] for constructing the decision tree from data. In ID3,each node corresponds to a splitting attribute and each arc is a possible value of that attribute. At each node the splitting attribute is selected to the most informative among the attributes not it considered in the path from the root. Entropy is used to measure how informative is a node. This algorithm uses the criterion of information gain to determine the goodness of a split. The attribute with the greatest information gain is taken as the splitting attribute, and the data set is split for all distinct values of the attribute.
3.4
Classification and Regression Tree
CART (Classification and Regression Tree) [10] is one of the popular methods of building decision tree in the machine
1. Duration
2. Protocol type
3. Service
4. Src_bytes
5. Dst_bytes
6. Flag
7. Land
8. Wrong_fragment
9. Urgent
10. Hot
11. Num fail logins
12. Logged_in
13. Num compromized
14. Root_shell
15. Su_attempted
16. Num_root
17. Num file creations
18. Number _shells
19. Num access files
20. Num_outbound_cmd
21. is_hot_login
22. is_guest_login
23. Count
24. srv_count
25. serror_rate
26. srv_error_rate
27. rerror_rate
28. srv_rerror_rate
29. same_srv_rate
30. diff_srv_rate
31. srv_diff_host_rate
32. dst_host_count
33. dst_host_srv_count
34.dst_host_same_srv_rate
35. dst_host_diff_srv_rate
36. dst_host_same_src_port_rate
37. dst_host_srv_diff_host_rate
38. dst_host_error_rate
39. dst_host_srv_error_rate
40. dst_host_error_rate
learning community. CART builds a binary decision tree by splitting the record at each node, according to a function of a single attribute. CART uses the gini index for determining the best split. The initial split produces the nodes, each of which we now attempt to split in the same manner as the root node. Once again, we examine the entire input field to find the candidate splitters. If no split can be found then significantly decreases the diversity of a given node, we label it as a leaf node. Eventually, only leaf nodes remain and we have grown the full decision tree. The full tree may generally not be the tree that does the best job of classifying a new set of records, because of overfitting.
3.5
REP Tree
REP tree [14] builds a decision or regression tree using information gain/variance reduction and prunes it using reduced-error pruning. Optimized for speed, it only sorts values for numeric attributes once. It deals with missing values by splitting instances into pieces, as C4.5 does. We can set the minimum number of instances per leaf, maximum tree depth (useful when boosting trees), minimum proportion of training set variance for a split (numeric classes only) and number of folds for pruning.
4.
K-FOLD VALIDATION AND
FEATURE SELECTION
In k-fold cross-validation [2], the initial data are randomly partitioned into kmutually exclusive subsets or “folds,” D1,
D2,…, Dk, each of approximately equal size. Training and
testing is performed k times. In iteration i, partition Di is reserved as the test set, and the remaining partitions are collectively used to train the model. That is, in the first iteration, subsets D2,…. , Dkcollectively serve as the training
set in order to obtain a first model, which is tested on D1; the second iteration is trained on subsets D1, D3,… , Dk and
tested on D2, and soon. For classification, the accuracy
estimate is the overall number of correct classifications from the k iterations, divided by the total number of tuples in the initial data.
Feature selection [13] is an optimization process in which one tries to find the best feature subset from the fixed set of the original features, according to a given processing goal and feature selection criteria. In this piece of work we have applied Gain ratio feature selection technique based on rank. The extension to information gain known as gain ratio [2] based on ranking, which attempts to overcome bias. It applies a kind of normalization to information gain using a “split information” value defined analogously with Info(D) as
SplitInfoA(D)=- (1) This value represents the potential information generated by
splitting the training data set, D, into v partitions, corresponding to the v outcomes of a test on attribute A.
5.
MODEL EVALUATION AND
CRITERIA
Performance of each classifier can be evaluated by using some very well-known statistical measures: classification accuracy, true positive rate (TPR), false positive rate (FPR), and precision and f-measure. These measures are defined by true positive (TP), true negative (TN), false positive (FP) and false negative (FN).
Confusion matrix [2] for two classes is shown in table 1 where TP refers number of positive samples which is correctly classified by classifier, TN is number of negative samples classified correctly by the classifier, similarly FP are number of negative samples that is incorrectly classified where as FN are the number of positive sampler that is incorrectly classified.
Table 1: Confusion matrix for positive and negative samples
If the total number of cases are N then based on the above table following statistical performance measures can be evaluated. The following performance measures can be used to evaluate the robustness of classifiers:
Classification accuracy = (TP+TN)/N (2) True positive rate (TPR)=TP/(TP+FN) (3)
False positive rate (FPR) = 1-Specificity (4) Where
Specificity=TN/(TN+FP)Precision=TP/(TP+FP) (5) F–measure (6)
Receiver Operating System (ROC) Curve: ROC curves [2] are a useful visual tool for comparing two classification models. The name ROC stands for receiver operating characteristic. An ROC curve shows the trade-off between the true positive rate or sensitivity (proportion of positive tuples that are correctly identified) and the false-positive rate
(proportion of negative tuples that are incorrectly identified as positive) for a given model. Any increase in the true positive rate occurs at the costof an increase in the false-positive rate. The area under the ROC curve is a measure of the accuracy of the model.
6.
EXPERIMENTAL RESULT AND
DISCUSSION
Experimental work is carried out using WEKA [12] open source data mining software under JAVA environment and Tanagra data mining tool [11] using i5 machine. In order to check efficiency of the model data set is divided into five different partitions as 60-40% ,75-25%,80-20% ,85-25% and 90-10% as training and testing part .Various decision tree based data mining models have developed using 5different partitions as well as10-fold cross validation. Binary classifier model for IDS is more generic model. Different data partitions are applied one by one on different models and classification accuracy is calculated using equation 2 and presented in table 2, the same is depicted in form of bar graph in figure 2.
Actual Vs. predicted Positive Negative
Positive True Positive (TP) False Negative (FN)
Negative False Positive (FP) (FP)
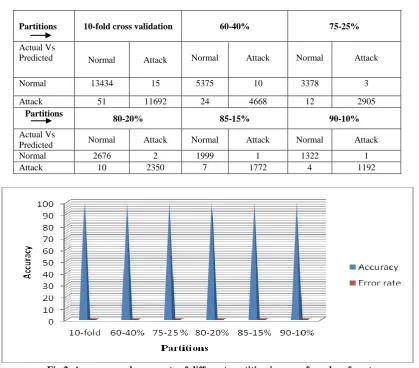
Classified samples in terms of TP, TN, FP and FN are shown in form of confusion matrix in table 3.Data shown in each cell of confusion matrix represents number of samples classified under that category ,say for example ,out of 13449 samples of normal categorydata,13434 samples are classified correctly while 15 samples are misclassified. As explained partition size
play important role in terms of performance of model, in our case also, model is producing better accuracy with 90:10% ratio of training and testing samples, produces 99.80% accuracy in case of random forest model.
Table 2: Accuracy of models with different partitions (with all features)
Table 3: Confusion matrix of random forest model for various partitions
Fig 2: Accuracy and error rate of different partition in case of random forest
6.1
Feature Selection
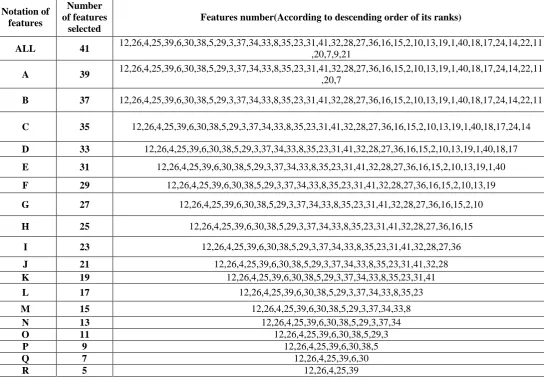
One of the important objectives of this research work is to reduce features from the NSL-KDD data set due to its high dimensionality. The main aim of feature selection technique is to select relevant features and to remove irrelevant features from data set to achieve high accuracy and to reduce computational cost of IDS. We have used gain ratio feature selection technique, which is a ranking based feature selection technique that can be
used to select features based on their rank. The calculated rank of the features shown in table 4 in first row in descending order, in which feature number 12 (logged_in) is having highest rank while feature number 21 (is _hot_ login) is least relevant. From the experiment it is clear that applying feature selection technique to reduce number of features from the data set is beneficial in terms of efficiency of IDS. The rank based feature selection technique is reducing features from 41 to 19. After Model 10-fold cross
validation
60-40% partition
75-25% partition
80-20% partition
85-15% partition
90-10% partition
C4.5 99.55 99.44 99.57 99.66 99.60 99.64
Random forest 99.73 99.66 99.76 99.76 99.78 99.80
ID3 98.75 97.71 98.55 98.69 98.94 98.69
CART 99.52 99.34 99.39 99.42 99.65 99.76
REP Tree 99.54 99.26 99.49 99.68 99.73 99.72
Partitions 10-fold cross validation 60-40% 75-25%
Actual Vs
Predicted Normal Attack Normal Attack Normal Attack
Normal 13434 15 5375 10 3378 3
Attack 51 11692 24 4668 12 2905
Partitions
80-20% 85-15% 90-10%
Actual Vs
Predicted Normal Attack Normal Attack Normal Attack
Normal 2676 2 1999 1 1322 1
[image:4.595.74.524.162.270.2] [image:4.595.90.510.289.657.2]reducing 22 features, accuracy of model is improving from 99.80% to
99.84% (almost 100%).However, with 17 features, model is producing same accuracy as 41 features. Table 5 show the subsets of feature selected after applying above feature selection technique. Feature selection technique has been applied on random forest model which is designated as one of the best model with highest accuracy (99.80%) with all features. A subset
of feature are then obtained as
A,B,C,D,E,F,G,H,I,J,K,L,M,N,O,P,Q,R with 39,37,35,,33,31,29,27, 25,23,21,19,17,15,13,11,9,7,5 features
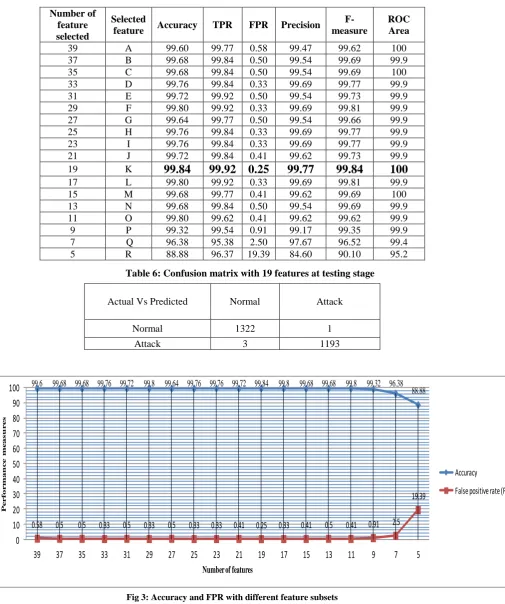
[image:5.595.25.570.217.599.2]respectively. Various performance measures for all these feature subsets are calculated using equation 2 to equation 6 as shown in table 5.Table 6 shows confusion matrix of the best model with 19 features in which 1322 samples are classified correctly while one sample is misclassified for normal data, similarly 1193 samples are classified correctly and 3 samples are misclassified for attack category of data. Accuracy and FPR with different subsets of feature are also shown in form of line graph in figure 3,where x-axis represent number of features and y-x-axis represent accuracy and FPR in percentage.
Table 4: Gain ratio feature selection technique on random forest
Notation of features
Number of features
selected
Features number(According to descending order of its ranks)
ALL 41 12,26,4,25,39,6,30,38,5,29,3,37,34,33,8,35,23,31,41,32,28,27,36,16,15,2,10,13,19,1,40,18,17,24,14,22,11
,20,7,9,21
A 39 12,26,4,25,39,6,30,38,5,29,3,37,34,33,8,35,23,31,41,32,28,27,36,16,15,2,10,13,19,1,40,18,17,24,14,22,11
,20,7
B 37 12,26,4,25,39,6,30,38,5,29,3,37,34,33,8,35,23,31,41,32,28,27,36,16,15,2,10,13,19,1,40,18,17,24,14,22,11
C 35 12,26,4,25,39,6,30,38,5,29,3,37,34,33,8,35,23,31,41,32,28,27,36,16,15,2,10,13,19,1,40,18,17,24,14
D 33 12,26,4,25,39,6,30,38,5,29,3,37,34,33,8,35,23,31,41,32,28,27,36,16,15,2,10,13,19,1,40,18,17
E 31 12,26,4,25,39,6,30,38,5,29,3,37,34,33,8,35,23,31,41,32,28,27,36,16,15,2,10,13,19,1,40
F 29 12,26,4,25,39,6,30,38,5,29,3,37,34,33,8,35,23,31,41,32,28,27,36,16,15,2,10,13,19
G 27 12,26,4,25,39,6,30,38,5,29,3,37,34,33,8,35,23,31,41,32,28,27,36,16,15,2,10
H 25 12,26,4,25,39,6,30,38,5,29,3,37,34,33,8,35,23,31,41,32,28,27,36,16,15
I 23 12,26,4,25,39,6,30,38,5,29,3,37,34,33,8,35,23,31,41,32,28,27,36
J 21 12,26,4,25,39,6,30,38,5,29,3,37,34,33,8,35,23,31,41,32,28
K 19 12,26,4,25,39,6,30,38,5,29,3,37,34,33,8,35,23,31,41
L 17 12,26,4,25,39,6,30,38,5,29,3,37,34,33,8,35,23
M 15 12,26,4,25,39,6,30,38,5,29,3,37,34,33,8
N 13 12,26,4,25,39,6,30,38,5,29,3,37,34
O 11 12,26,4,25,39,6,30,38,5,29,3
P 9 12,26,4,25,39,6,30,38,5
Q 7 12,26,4,25,39,6,30
Table 5: Various performance measures for different feature subsets
Table 6: Confusion matrix with 19 features at testing stage
99.6 99.68 99.68 99.76 99.72 99.8 99.64 99.76 99.76 99.72 99.84 99.8 99.68 99.68 99.8 99.32 96.38 88.88
0.58 0.5 0.5 0.33 0.5 0.33 0.5 0.33 0.33 0.41 0.25 0.33 0.41 0.5 0.41 0.91 2.5 19.39
0
10
20
30
40
50
60
70
80
90
100
39
37
35
33
31
29
27
25
23
21
19
17
15
13
11
9
7
5
P
e
r
fo
r
m
an
c
e
m
e
as
u
r
e
s
Number of features
Accuracy
[image:6.595.65.571.83.688.2]False positive rate (FPR)
Fig 3: Accuracy and FPR with different feature subsets
Number of feature selected
Selected
feature Accuracy TPR FPR Precision
F-measure
ROC Area
39 A 99.60 99.77 0.58 99.47 99.62 100 37 B 99.68 99.84 0.50 99.54 99.69 99.9 35 C 99.68 99.84 0.50 99.54 99.69 100 33 D 99.76 99.84 0.33 99.69 99.77 99.9 31 E 99.72 99.92 0.50 99.54 99.73 99.9 29 F 99.80 99.92 0.33 99.69 99.81 99.9 27 G 99.64 99.77 0.50 99.54 99.66 99.9 25 H 99.76 99.84 0.33 99.69 99.77 99.9 23 I 99.76 99.84 0.33 99.69 99.77 99.9 21 J 99.72 99.84 0.41 99.62 99.73 99.9 19 K
99.84
99.92 0.25
99.77
99.84
100
17 L 99.80 99.92 0.33 99.69 99.81 99.9 15 M 99.68 99.77 0.41 99.62 99.69 100 13 N 99.68 99.84 0.50 99.54 99.69 99.9 11 O 99.80 99.62 0.41 99.62 99.62 99.9 9 P 99.32 99.54 0.91 99.17 99.35 99.9 7 Q 96.38 95.38 2.50 97.67 96.52 99.4 5 R 88.88 96.37 19.39 84.60 90.10 95.2
Actual Vs Predicted Normal Attack
7.
CONCLUSION
Providing security to computer or computer network from unauthorized user to access data and information is expensive. We need to prevent our network against the intrusion in safe and efficient way using a tool like IDS. Developing a robust IDS with low false alarm rate is very challenging task, which can able to detect attacks more accurately and prevent data and information from intruder. Basically IDS is a classifier that can classify unwanted information and allow desirable information towards local network or host.
This paper presents to design an IDS based on decision tree techniques with special reference to feature selection. Various data mining based decision tree techniques are initially applied on NSL-KDD data set using k-fold validation and 5 different partitions. Random forest model with data portion 90:10 as training and testing samples is selected for further improvement of IDS model as the accuracy in this case is highest (99.80%).After applying feature selection technique, accuracy of model is increased up to 99.84% in case of 19 features, which is higher than the accuracy obtained by Mrutyunjaya, Panda et al. (2012) for binary class problem. Values of other measures like TPR (99.92%), FPR (0.25%), precision (99.77%) and F-measure (99.84%) proves that, IDS developed in this research work is promising for detection of attack. System can be accepted since false positive rate (FPR) is minimized while true positive rate (TPR) is maximized. In the future we can concentrate on comparative study of various feature selection techniques with the combination of genetic algorithm on hybrid multiclass classifier.
8.
CONCLUSION
[1] V., Bolon Canedo et al. 2011. Feature selection and classification in multiple class datasets: an application to KDDCup 99 dataset, Expert systems with Applications,vol 38, pp. 5947-5957.
[2] Jiawei Han and Micheline Kamber 2006. Data Mining Concepts and Techniques, 2nd edition, Morgan Kaufmann, San Francisco.
[3] Ibrahim, Laheeb M., et al. 2013. A comparison study for intrusion (KDD99, NSL-KDD) based on self
organization map (SOM) artificial database neural network, Journal of Engineering Science and Technology, vol.8, No. 1, pp. 107 – 119.
[4] L., Koc et al. 2012. A network intrusion detection system based on Hidden Naive Bayes multiclass classifier’, Journal of Expert system with applications, vol 39, pp. 13492-13500.
[5] Y., Li et al. 2012. An efficient intrusion detection system based on support vector machines and gradually feature removal method, Expert systems with Applications, vol 39, pp. 424-430.
[6] NSL-KDD Data set for network based intrusion detection system, last accessed: Oct 2012.available at http://www.iscx.info/NSL-KDD/ .
[7] Saurbh Mukherjee et al. 2012. Intrusion detection using Bayes classifier with feature reduction’, Procedia technology, vol 4, pp. 119-128.
[8] Mrutyunjaya, Panda et al. 2012. A hybrid intelligent approach for network intrusion detection, Proceedia Engineering, vol 30, pp. 1-9.
[9] R., Parimala et al. 2011. A study of spam E-mail classification using feature selection package, Global General of computer science and technology, vol. 11, ISSN 0975-4172.
[10]A. K. Pujari 2001. Data mining techniques, 4th edition, Universities Press (India) private limited.
[11]Tanagra – A Free Data Mining Software for Teaching and Research last accessed: Sep. 2012. available at: http://eric.univ-lyon2.fr/~ricco/tanagra/en/tanagra.html [12]Web sources: http: //www.cs.waikato,ac.nz/~ml/weka/ [13]Krzysztopf J. Cios,Witold Pedrycz and Roman W.
Swiniarski 1998. Data mining methods for knowledge discovery, 3rd editions, Kluwer academic publishers. [14]Ian H. Witten et al. 2005. Data Mining practical machine
learning tools and techniques’, 2nd