Volume 85 – No 5, January 2014
GMM based Language Identification using MFCC and
SDC Features
Kshirod Sarmah
Department of Computer Science and Engineering, Rajiv Gandhi University, Rono Hills,
Doimukh, Arunachal Pradesh, India, Pin-791112
Utpal Bhattacharjee
Department of Computer Science and Engineering, Rajiv Gandhi University, Rono Hills,
Doimukh, Arunachal Pradesh, India, Pin-791112
ABSTRACT -
Language Identification (LID) is one of the most popular areas of research in speech signal processing. Now a day’s lots of approaches have been used to improve performance of LID system which includes Parallel Phone Recognition Language Modeling (PPRLM), Support Vector Machine (SVM) and general Gaussian Mixture Model (GMM) etc. The state-of-art LID system has been utilised lots of feature vectors like LPCC, MFCC, SDC and prosodic. Although fusion of prosodic features with MFCC features shows some improvement in the performance of the LID system. But still it is not sufficient. In this paper, a baseline system for the LID system in multilingual environments has been developed using GMM as a classifier and MFCC combined with Shifted-Delta-Cepstral (SDC) as front end processing feature vectors. In this works, we used the Arunachali Language Speech Database (ALS-DB), a multilingual and multichannel speech corpus which was recently collected from the four local languages namely Adi, Apatani, Galo and Nyishi in Arunachal Pradesh including Hindi and English as secondary languages.The performance of the LID system has been improved by combing MFCC and SDC features than its individual performances. The minimum ERR rates for the features MFCC and SDC individually are 19.70% and 11.83% respectively while minimum ERR rate for the combined features both MFCC and SDC is 6.40%.Approximately 15.00% and 6.00% of performance of the LID system has been improved while using the combining features of MFCC with SDC over the baseline systems that using MFCC and SDC features in individual respectively.Keywords
- Language Identification, GMM, MFCC, SDC.1.
INTRODUCTION
Automatic Language Identification (LID) is the task of identifying the language from the short utterance spoken by the unknown speaker. There is lots of important application for automatic language identification. Due to global economic community expansions, it needs of automatic language identification services. In a multi-lingual country like India, automatic LID system has special significance. Today, the need for multi-language communication applications, which can serve people from different nations in their native languages, has gained an increasing importance. Automatic Language Identification has a significant role in the pre-process phase of multi-language systems.
The main purpose of a language identification application includes the ability of automatically adapting a speech-based tool, such as online banking or information retrieval, to the native language of the user. With the growth of the Internet, we now live in a worldwide society communicating and doing business with people who use a wide variety of languages which makes language identification more important each day. Multilingual environments may have political, military, scientific, commercial or tourist context [1].
Some other applications of language identification are checking into a hotel, arranging a meeting or making travel arrangement comfortable for non-native speakers. Telephone companies will be better equipped to handle foreign language calls if an automatic language identification system can be applied to route the call to an operator fluent in that language [2]. An automatic language identification system could also serve as a front-end for a Multilanguage translation system in which the input speech can be in one of several languages. In multilingual environment as it is in text-independent language identification, phonemes and other sub-words units alone are not sufficient cues also needs to check the sentence as a whole to determine the “acoustic signature” of the language, the unique characteristics that make one language sound distinct from another. To decode the acoustic signature of a language, it needs the information namely acoustic phonetics, prosodic, phonotactics, vocabulary etc. Language identification (LID) system typically tries to extract high-end phonetic information from the spoken utterance and use to discriminate among closed set languages [3].
Design of an LID system depends on the concrete LID task, modeling methods, and the availability of a sufficient amount of training data. Ideally, the LID system should be highly accurate in identifying a language while also being computationally efficient, being robust against speaker, channel, environment, and vocabulary variability, requiring a minimum of language-specific information for the development of the system, allowing a new language to be included without much effort.
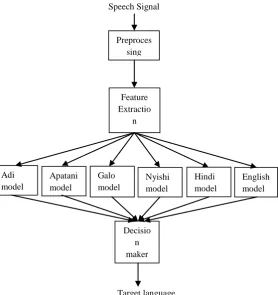
It has been observed that when prosodic features are combined with MFCC features, performance of the LID system improved by nearly 11% over the baseline performance using the ALS-DB database [4][5]. In this works, we have used the combined MFCC and SDC features for identifying the languages of the same corpus ALS-DB. In this case, it has been observed that the performance of the LID system has been improved than that of using single MFCC and SDC features separately. Also the performance of the GMM based LID system has shown far better than that of combined features using MFCC and Prosodic. The propose LID system has been given in the figure 1.
Volume 85 – No 5, January 2014
Speech Signal
[image:2.595.15.294.61.357.2]Target language
Fig. 1: Language Identification System.
2. LITERACY
REVIEWS
OF
PREVIOUS
RESEARCH
The core modeling principle of most LID systems based on acoustic-phonetic information. Although lots of approaches have been used to improve performance of LID system which includes Parallel Phone Recognition Language Modeling (PPRLM), Support Vector Machine (SVM), Anchor Models (AM), Autoassociative Neural Network Models (AANN) and general Gaussian Mixture Model (GMM) etc. The most preferred choice in many state-of-the-art acoustic LID systems is Gaussian Mixture Models (GMM). Under the GMM assumption, the probability is modeled as a weighted sum of multi-variate normal density (Gaussian) functions with parameters estimated on the training data. The earliest GMM based LID system based on MFCC features and a maximum-likelihood decision rule was proposed by Zissman and is described in [6]. GMM is computationally inexpensive, does not require phonetically labeled training speech, and is well suited for text-independent tasks, where there is no strong prior knowledge of the spoken text.
HMM-based language identification was first proposed by House and Neuburg [7] who used symbol sequences derived from known phonetic transcriptions of text for training and testing. To capture language-discriminative information that resides in the dynamic patterns of spectral features, other LID systems have used Hidden Markov Models (HMM).
An attempt to incorporate temporal information from speech data was made by Torres-Carrasquillo et al. [8] who proposed using the so-called Shifted Delta Cepstra (SDC) as spectral features for GMM systems. SDC features are created by stacking delta cepstra, computed across multiple speech frames (the computation of SDC features is given in Section 4, and have become an essential part of the acoustic LID systems.
Furthermore, Torres-Carrasquillo and colleagues successfully combined SDC features with high-order GMM [9] (2048 densities versus the 512 used earlier). Increasing the number of mixtures and the dimension of the feature vectors improves the performance of GMM based LID systems. In the same time, it is time consuming for both training and testing. These costs can be however reduced by applying an adaptation technique from a large, common for all languages, GMM called the Universal Background Model (UBM).
The UBM was proposed by Reynolds [10] for speaker verification and first applied by Wong for LID [11]. Under this approach, a single background GMM is trained from the entire training data and language-dependent models are adapted from the resulting UBM using the language-specific portions of the data.
In parallel to the improvements of the estimation of GMM parameters, additional methods were proposed for increasing the quality of frontend processing. Since LID performance can be highly affected by speaker and channel variability, several attempts were made in order to reduce this source of influence:
The RASTA (RelAtive SpecTrAl) filtering of cepstral trajectories, proposed for LID by Zissman [12], is used to remove slowly varying, linear channel effects from raw feature vectors.
Vocal-Tract Length Normalization (VTLN) performs simple speaker adaptation as it is used in speech recognition [13]. Nowadays, after Matejka et al. [14], VTLN is a commonly used normalization technique for the LID task.
Factor analysis techniques Latent Factor Analysis (LFA) and Nuisance Attribute Projection (NAP), proposed by Vair et al. in [15] are used to remove undesired variation coming from a low-dimensional source.
Eigen-channel adaptation (in the feature domain) is used to compensate features in channel mismatch. The technique was introduced by Kenny [16] for speaker recognition and then adopted by Burget et al. [17].
Another successful LID approach uses Support Vector Machines (SVM). The essence of SVM lies in representing the class-separating boundaries in a high-dimensional space in terms of few crucial points obtained from the training sample, termed support vectors. Currently, most SVM-based LID systems adopt their ideas from GMM-based systems. They can use MFCC and SDC features, channel and speaker-variability compensation techniques.
Along with acoustic and phonotactic LID systems, the prosodic information can be used to discriminate languages. Most prosody-based LID systems capture the duration, the pitch pattern, and the stress pattern in a language.
In this works we attempted to develop a LID system using MFCC and SDC as front end feature vectors and GMM as classifier. Here we observed that the combined feature vectors of MFCC and SDC had vast improved the performance of our baseline system.
3.
SPEECH
DATABASE
DESCRIPTION
In this section we used the recently collected Arunachali Language Speech Database (ALS-DB) which is a multilingual speech database [4]. Arunachal Pradesh of North East India is one of the linguistically richest and most diverse regions in all of Preproces
sing
Feature Extractio
n
Adi model
Decisio n maker Apatani
model
English model Galo
model
Galo
model
Nyishi model
Volume 85 – No 5, January 2014
Asia, being home to at least thirty and possibly as many as fifty distinct languages in addition to innumerable dialects and subdialects thereof [18]. The vast majority of languages indigenous to modern-day Arunachal Pradesh belong to the Tibeto-Burman language family. The majority of these in turn belong to a single branch of Tibeto-Burman, namely Tani. Almost all Tani languages are indigenous to central Arunachal Pradesh while a handful of Tani languages are also spoken in Tibet. Tani languages are noticeably characterized by an overall relative uniformity, suggesting relatively recent origin and dispersal within their present-day area of concentration. Most Tani languages are mutually intelligible with at least one other Tani language, meaning that the area constitutes a dialect chain. In addition to these non-European languages, the Indo-European languages Assamese, Bengali, English, Nepali and especially Hindi are making strong inroads into Arunachal Pradesh primarily as a result of the primary education system in which classes are generally taught by immigrant teachers from Hindi-speaking parts of northern India. Because of the linguistic diversity of the region, English is the only official language recognized in the state.
To make identification of languages, ALS-DB is collected in multilingual environment. Each speaker is recorded for three different languages – English, Hindi and a local language, which belongs to any one of the four major Arunachali languages - Adi, Nyishi, Galo and Apatani. Each recording is of 4-5 minutes duration. Speech data were recorded in parallel across four recording devices, which are listed in table -1[4].
Table.1 Device type and recording specifications
Device Sl. No
Device Type Sampling Rate
File Format
1 Table mounted
microphone
16 kHz wav
2 Headset
microphone
16 kHz wav
3 Laptop
microphone
16 kHz wav
4 Portable Voice
Recorder
44.1 kHz mp3
The speakers are recorded for reading style of conversation. The speech data collection was done in laboratory environment with air conditioner, server and other equipments switched on. The speech data was contributed by 100 male and 100 female informants chosen from the age group 20-50 years. During recording, the subject was asked to read a story from the school book of duration 4-5 minutes in each language for twice and the second reading was considered for recording. Each informant participates in four recording sessions and there is a gap of at
least one week between two sessions.
4.
FEATURE
EXTRACTION
In order to extract the language specific features from each speech utterance of different speakers of different languages, we have used two important feature vectors namely MFCCs and SDCs that has been given below.
4.1
Mel-Frequency Cepstral Coefficients
(MFCC) Feature
Mel-Frequency Cepstral Coefficients (MFCC) is one of the most popular approaches of feature extraction technique in both speaker recognition and LID system. MFCCs are based on the known variation of the human ears critical bandwidths with frequency, filters spaced linearly at low frequencies and logarithmically at high frequencies that have been used to capture the phonetically important characteristics of speech
[19]. The characteristics are expressed on the mel-frequency scale, which is linear frequency spacing below 1000 Hz and a logarithmic spacing above 1000 Hz. Therefore we can use the following approximate formula to compute the mels for a given linear frequency f in Hz.
Mel (f) = 2595 X (1)
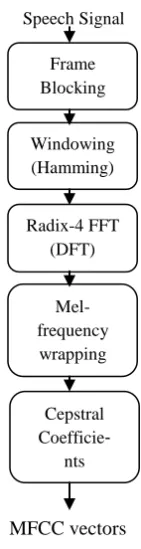
The basic concept of a Mel–frequency cepstral coefficient processor can be described as follows.
Speech Signal
MFCC vectors
Fig 2: Block diagram of MFCC processor.
4.2
Shifted Delta Cepstra (SDC) Feature
The GMM LID system improved its performance combining high order (512-1024-2048) mixture models with shifted delta cepstra (SDC) feature vectors are an extension of delta-cepstra coefficients. In language identification, SDC feature [20] is widely used.SDC feature vectors are created by stacking delta cepstra computed across multiple speech frames.
SDC coefficients are based on four parameters namely written as N-d-P-k. For each frame of data, first MFCCs are computed based on N; (i.e c0 ,c1 ,c2 ,c3… cN-1 ). The parameter d determine
the spread over which deltas are computed, and the parameter P determines the gaps between successive delta computations. k defines the number of blocks and the parameter determines the gaps between successive delta computations.
For a given time t, we obtain
(2)
For i=0,1,2,……k-1.
The SDC coefficients are then a stacked version of (1)
(3)
Frame Blocking
Windowing (Hamming)
Radix-4 FFT (DFT)
Mel-frequency wrapping
Cepstral Coefficie
[image:3.595.413.484.177.453.2]Volume 85 – No 5, January 2014
5.
GMM
AS
A
CLASSIFIER
GMMs are commonly used as a parametric model of the probability distribution of a continuous measurement of features in a biometric system [21].
Recent research indicates that the most successful acoustic LID systems are based on Gaussian Mixture Models (GMM) that classify languages using the spectral content of the speech signal. A GMM is a probabilistic model for density estimation using a mixture distribution and is defined as a weighted sum of multi-variate Gaussian densities.
A GMM is a weighted sum of M component densities is given by the form
(4) Where x is a dimensional random vector, (x),
i=1,2……M is the component densities and i=1,2,….,M is the mixture weights.
The Gaussian Function can be defined of the form
(5)
With mean vector and covariance matrix . The mixture weight satisfy the constraint that
(6)
The complete Gaussian mixture model is parameterized by the mean vectors, covariance matrices and mixture weight from all component densities.
These parameters can collectively represented by the notation:
for i=1,2,……….,M
(7)
In speaker verification system, each speaker can be represented by such a GMM and is referred to by the above model .
The language-specific GMM parameters are estimated by the Expectation-Maximization (EM) algorithm using training data spoken by the corresponding speaker. The basic idea of the EM algorithm is, beginning with an initial language model , to estimate a new model such that ≥ .The new model then becomes the initial model for the next iteration and the process is repeated until some convergence threshold is reached [21].
Each iteration of the EM algorithm consists of two processes:
1. In the expectation, or E-step, the expected value of the log-likelihood function is calculated given the observed data and current estimate of the model parameters.
2. The M-step computes the parameters which maximize
the expected log-likelihood found on the E-step. These parameters are then used to determine the distribution of the latent variables in the next E-step until the algorithm has converged.
Convergence is assured since the algorithm is guaranteed to increase the likelihood at each iteration where the following re-estimation formulas are used:
Mixture Weights :
(8)
Means :
(9)
Variance (diagonal covariance):
(10)
The a posteriori probability for component i is given by
(11)
The critical factors in training a GMM are selecting the order M
of the mixture and initializing the model parameters prior to the EM algorithm. Using mixture models with high number of components results in increasing of the system performance of the LID system from one side and in increasing its complexity from the other side.
6.
EXPERIMENTAL
SETUP
OF
THE
LID
SYSTEM
A language identification (LID) system has been developed using Gaussian Mixture Model based modeling approach. Speech sampled at 16 KHz with 16 bits/sample resolution and frame rate 100 Hz. A pre-emphasis factor of 0.97 has been applied. A 12 mel-frequency cepstral coefficient (MFCC) is extracted. Here 0th coefficient is also included.
The frame-wise cepstra are concatenated into a 39-dimensional feature vector composed of 12 static coefficients and stacked with the set of shifted delta cepstral (SDC) features produced by applying a 12-1-3-3 SDC scheme [2]. Shift-Delta-Cepstral (SDC) coefficients have been extracted from MFCC coefficients.
The filter bank used in deriving the cepstral coefficients consisted of 20 triangular filters. Cepstral Mean Subtraction (CMS) and Cepstral Variance Normalization (CVN) has been applied on all features to reduce the effect of channel as well language mismatch.
Volume 85 – No 5, January 2014
6.1
Detection Cost Function (DCF)
According to the NIST Detection Cost Function (DCF) can be defined as
CDET = (CMiss * PMiss|Target * PTarget ) + (CFalseAlarm *
PFalseAlarm|NonTarget * PNonTarget )
Where PMiss|Target and PFalseAlarm|NonTarget are the miss (false
rejection) probability and the false alarm (false acceptance) probability respectively.
And Parameter Values are
Cost of miss CMiss = 10
Cost of a false alarm CFalseAlarm = 1
Probability of a target PTarget = 0.01
Probability of a non-target PNonTarget = 1 - PTarget = 0.99
The detection error trade-off (DTE) curve has been plotted using log likelihood ratio and the equal error rate (EER) and Minimum DCF values were obtained from the DTE curve has been used as a measure for the performance of the LID system. Details of experimental result were given below. Table 1 gives the ERR and DCF values of the LID system.
7.
RESULTS
Experiments:In the experiment the baseline system for language identification was designed using Gaussian Mixture Model (GMM) with MFCC features with its first and second derivative each of 13 numbers of cepstral coefficients including the 0th cepstral
[image:5.595.346.539.63.239.2]coefficient and total 39 dimensional feature vectors. Also stacked with the set of shifted delta cepstral (SDC) features produced by applying a 12-1-3-3 SDC scheme. The performance of the baseline system for the LID system of six languages namely Adi, Apatani, Galo, Nyishi, Hindi and English have been given below in the Fig. 3, Fig. 4, Fig. 5, Fig. 6, Fig. 7 and Fig. 8 respectively.
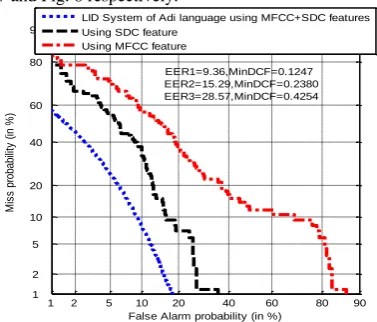
[image:5.595.347.535.271.453.2]Fig 3: DET curve for the LID system of Adi language using MFCC, SDC and MFCC+SDC features.
[image:5.595.81.270.439.600.2]Fig 4: DET curve for the LID system of Apatani language using MFCC, SDC and MFCC+SDC features.
Fig 5: DET curve for the LID system of Galo language using MFCC, SDC and MFCC+SDC features.
Fig 6: DET curve for the LID system of Nyishi language using MFCC, SDC and MFCC+SDC features. 1 2 5 10 20 40 60 80 90
1 2 5 10 20 40 60 80 90
False Alarm probability (in %)
M
is
s
pr
ob
ab
ili
ty
(
in
%
)
EER1=9.36,MinDCF=0.1247 EER2=15.29,MinDCF=0.2380 EER3=28.57,MinDCF=0.4254 LID System of Adi language using MFCC+SDC features Using SDC feature
Using MFCC feature
1 2 5 10 20 40 60 80 90
1 2 5 10 20 40 60 80 90
False Alarm probability (in %)
M
is
s
p
ro
b
a
b
ili
ty
(
in
%
)
EER1=9.86,MinDCF=0.1285 EER2=14.79,MinDCF=0.2242 EER3=26.0.MinDCF=0.4144 LID System of Apatani language using MFCC+SDC features Using SDC feature
Using MFCC feature
1 2 5 10 20 40 60 80 90
1 2 5 10 20 40 60 80 90
False Alarm probability (in %)
M
is
s
p
ro
b
a
b
ili
ty
(
in
%
)
EER1 = 10.20,MinDCF=0.1345 EER2 = 15.64,MinDCF=0.2677 EER3 = 29.20,MinDCF=0.4382 LID System of Galo language using MFCC+SDC features Using SDC feature
Using MFCC feature
1 2 5 10 20 40 60 80 90
1 2 5 10 20 40 60 80 90
False Alarm probability (in %)
M
is
s
p
ro
b
a
b
ili
ty
(
in
%
)
EER1=8.33,MinDCF=0.1150 EER2 =12.13,MinDCF=0.2161 EER3=23.55,MinDCF=0.4006 LID System of Nyishi language using MFCC+SDC features Using SDC feature
[image:5.595.336.531.491.674.2]Volume 85 – No 5, January 2014
[image:6.595.81.278.283.459.2]Fig 7: DET curve for the LID system of Hindi language using MFCC, SDC and MFCC+SDC features.
Fig 8: DET curve for the LID system of English language using MFCC, SDC and MFCC+SDC features.
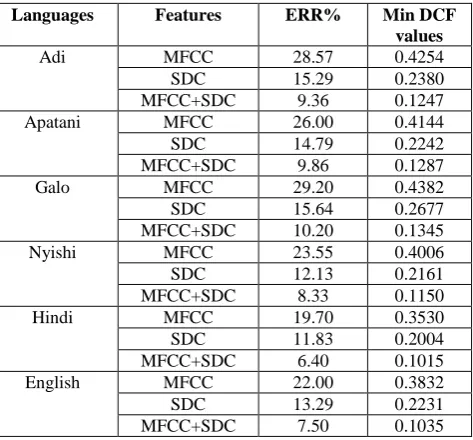
Table.2 ERR and Min DCF values of LID system of different languages
Languages Features ERR% Min DCF
values
Adi MFCC 28.57 0.4254
SDC 15.29 0.2380
MFCC+SDC 9.36 0.1247
Apatani MFCC 26.00 0.4144
SDC 14.79 0.2242
MFCC+SDC 9.86 0.1287
Galo MFCC 29.20 0.4382
SDC 15.64 0.2677
MFCC+SDC 10.20 0.1345
Nyishi MFCC 23.55 0.4006
SDC 12.13 0.2161
MFCC+SDC 8.33 0.1150
Hindi MFCC 19.70 0.3530
SDC 11.83 0.2004
MFCC+SDC 6.40 0.1015
English MFCC 22.00 0.3832
SDC 13.29 0.2231
MFCC+SDC 7.50 0.1035
8.
CONCLUSION
From the experimental point of view it has been observed that the performance of the LID system has been vast improved while combining the MFCC and SDC features. The minimum ERR rates for the features MFCC and SDC individually are 19.70% and 11.83% respectively while minimum ERR rate for the combined features both MFCC and SDC is 6.40%. Approximately 15.00% and 6.00% of performance of the LID system has been improved while using the combining features of MFCC with SDC over the baseline systems that using MFCC and SDC features in individual respectively.
9.
ACKNOWLEGEMENT
This work has been supported by the ongoing project grant No. 12(12)/2009-ESD sponsored by the Department of Information Technology, Government of India.
10.
REFERENCES
[1] Adda-Decker, M. and Lamel, L. “ The use of lexica in automatic speech recognition”. In Lexicon Development for Speech and Language Processing, Ed. F. Van Eynde and D. Gibbon. Kluwer, 2000.
[2] Muthusamy, Y.K., Barnard, and Cole, R.A., Automatic Language Identification: A Review/Tutorials. Signal Processing Magazine, IEEE, Vol 11, Issue.4.pages.33-41, 1994.
[3] Elan Noor and Hagal Aronowitz, 2006. Efficient Language Identification using Anchor models and Support Vector Machines, Speaker and Language Identification Workshop. Proc. IEEE Odyssey.
[4] Utpal Bhattacharjee and Kshirod Sarmah, 2012. A Multilingual Speech Database for Speaker Recognition, Proc. IEEE ISPCC 2012.
[5] Utpal Bhattacharjee and Kshirod Sarmah, 2013. Language Identification system using MFCC and Prosodic features, Proc. IEEE IISP 2013.
[6] Zissman, M. A. 1993. Automatic language identification using gaussian mixture and hidden markov models. In Proc. IEEE Int. Conf. on Acoustics, Speech, and Signal Processing (ICASSP), pages 399–402, Minneapolis, Minnesota (April 1993).
[7] House, A. S. and Neuburg, E. P. 1977. Toward automatic identification of the language of an utterance. i. preliminary methodological considerations. In Proc. of the Journal of Acoustic Society of America, volume 62(3), pages 708–713, (September 1977).
[8] Torres-Carrasquillo, P. E. Singer, M.A. Kohler, R. Green, D.A. Reynolds, and J.R. Deller Jr. 2002. Approaches to language identification using gaussian mixture models and shifted delta cepstral features. In Proc. IEEE Int. Conf. on Spoken Languag Processing (ICSLP), pages 719–722, Denver, Colorado.
[9] [9] Singer, E. P. Torres-Carrasquillo, T. Gleason, W. Campbell, and D.A. Reynolds 2003. Acoustic, phonetic and discriminative approaches to automatic language identification. In Proc. European Conference on Speech Communication and Technology (Eurospeech), pages 1345–1348, Geneva, Switzerland, (September 2003).
[10]Reynolds, D. A. 1997. Comparison of background
normalization methods for textindependent speaker verification. In Proc. European Conference on Speech Communication and Technology (Eurospeech), pages 963– 966, Rhodes, Greece, (September 1997).
1 2 5 10 20 40 60 80 90
1 2 5 10 20 40 60 80 90
False Alarm probability (in %)
M
is
s
p
ro
b
a
b
ili
ty
(
in
%
)
EER1 = 6.40,MinDCF=0.1015 EER2 = 11.83,MinDCF=0.2004 EER3=19.70,MinDCF=0.3530 LID System of Hindi language using MFCC+SDC features Using SDC feature
Using MFCC feature
1 2 5 10 20 40 60 80 90
1 2 5 10 20 40 60 80 90
False Alarm probability (in %)
M
is
s
p
ro
b
a
b
ili
ty
(
in
%
)
EER1=7.50,MinDCF=0.1035 EER2 = 13.29,MinDCF=0.2231 EER3=22.00,MinDCF=0.3832 LID System of English language using MFCC+SDC features Using SDC feature
[image:6.595.55.292.533.753.2]Volume 85 – No 5, January 2014
[11]E. Wong and S. Sridharan,2002. Methods to improve gaussian mixture model based language identification system. In Proc. IEEE Int. Conf. on Spoken Language Processing (ICSLP), page Fusion of output scores on language identification system, Denver, Colorado.
[12]M. A. Zissman. Comparison of four approaches to automatic language identification of telephone speech. In IEEE Transactions on Speech and Audio Processing, volume 4, pages 31–44, January 1996.
[13]Cohen, J. Kamm, T. and Andreou, A. G. 1995. Vocal tract normalization in speech recognition: Compensating for systematic speaker variability. In Proc. of the Journal of the Acoustical Society of America, number 97, pages 31– 44.
[14]P. Matejka, L. Burget, P. Schwarz, and J. Cernoky. BRNO university of technology system for NIST 2005 language recognition evaluation. In Proc. IEEE Speaker and Language Recognition Workshop (Odyssey), San Juan.
[15]Vair,C. Colibro,D. . Castaldo, F. Dalmasso, E. and Laface, P. Channel factors compensation in model and feature domain for speaker recognition. In Proc. IEEE Speaker and
Language Recognition Workshop (Odyssey), pages 1–6, San Juan.
[16]Kenny, P. and Dumouchel, P. 2004. Disentangling speaker and channel effects in speaker verification. In Proc. IEEE Int. Conf. on Acoustics, Speech, and Signal Processing (ICASSP), pages 37–40, Montreal, Canada.
[17]L. Burget, P. Matejka, P. Schwarz, O. Glembek, and J. Cernoky. “Analysis of feature extraction and channel compensation in gmm speaker recognition system” In IEEE Transactions on Audio, Speech and Language Processing, volume 15, pages 1979– 1986, 2007.
[18]Arunachal Pradesh,
http://en.wikipedia.org/wiki/Arunachal_Pradesh.
[19]Young, S. et al. “ The HTK Book”, Version 3.0 July 2001.
[20][20] Torres-Carrasquillo, P.A. 2002 Language
identification using Gaussian mixture models, PhD, thesis, Michigan State University.