Aid and Development
Tarp, Finn
2006
Aid and development
Finn Tarp
*Summary
Foreign aid looms large in the public discourse; and international development assistance remains squarely on most policy agendas con-cerned with growth, poverty and inequality in Africa and elsewhere in the developing world. The present review takes a retrospective look at how foreign aid has evolved since World War II in response to a dramatically changing global political and economic context. I review the aid process and associated trends in the volume and distribution of aid and categorize some of the key goals, principles and institutions of the aid system. The evidence on whether aid has been effective in furthering economic growth and development is discussed in some detail. I add perspective and identify some critical unresolved issues. I finally turn to the current development debate and discuss some key concerns, I believe should be kept in mind in formulating any agenda for aid in the future.
JEL classification: F35, O10.
Key words: Foreign aid, aid impact.
Aid and development
Finn Tarp
*Foreign aid and its effectiveness in promoting growth and develop-ment in developing countries has been an area of intense controversy ever since Rosenstein-Rodan (1943) advocated aid to Eastern and South-Eastern Europe. Early optimism and confidence in the impact of foreign aid have been tempered with time. Browsing through suc-cessive editions of a leading text book in development economics provides an illustration. In the first edition of his Leading Issues in Eco-nomic Development, Meier (1964) dedicated some 18 pages to the issue of foreign aid. He started out by asking: “How much aid?” By the time of the 6th edition (Meier, 1995), the treatment of foreign aid had
been cut in half, and the questions raised were: “Why official assis-tance?”, and “Does aid work?”. In the 2000 edition (Meier and Rauch, 2000), “foreign aid” is not even listed in the index.
Meanwhile the debate about the usefulness and design of foreign aid has continued unabated. Some insist that aid is a waste of re-sources and even harmful to aid receiving countries, Dichter (2005). In particular, they point to Africa and scores of failed projects and swiftly conclude that aid has been an outright disaster. Others are dis-appointed and sceptical, a prominent example being Easterly (2001, 2003, 2005, 2006), who highlights aid’s inability to buy growth. Bird-sall, Rodrik and Subramanian (2005) view the potential impact of aid as seriously circumscribed, but remain largely supportive. A comple-mentary approach in the middle ground is that aid has worked in the
past in furthering growth and development, see Tarp (2000). Aid is not equally effective everywhere, and much remains to be learnt about how aid impacts in theory and practice. The focus should therefore be both on ways and means to improve the effectiveness of foreign aid disbursements and on increasing the total flow of resources. A final approach is to emphasize that a doubling of worldwide aid flows is our generation’s challenge, a moral obligation of rich countries that will send “forth mighty currents of hope” and lead to “the end of poverty”, see Sachs (2005).
The analysis of aid’s impact on growth became dominated by macro-econometric frameworks during the second half of the 1990’s. Much of this debate has focused on whether the effectiveness of aid is conditional on policy or whether aid can be expected to have a separate and positive impact, independent of policy. This has in-volved a mixture of concerns, which range from technically demand-ing econometric modelldemand-ing issues to fundamentally different ap-proaches to the design and implementation of development strategy and policy. Overall, the view that aid works in promoting growth and development has gained ground in the academic literature in recent years; but disagreement remains characteristic in assessments of the necessary and sufficient conditions for aid to have a positive contribu-tion on the development process. The same goes in relacontribu-tion to (i) dif-ferent views on what constitutes “good” economic policy and how economic policy and deeper structural characteristics interact with the efficiency of foreign aid, and (ii) the institutional framework through which aid is channelled. Aid has, for example, been subjected to cri-tique for being donor driven, and this has led to repeated demands for new forms of partnership, see Helleiner (2000). One response has been to shift the attention to recipient country “ownership”, but what this means in theory and practice remains subject to differing inter-pretations.
both praise and critique, with Sachs and Easterly appearing to occupy opposing ends of the spectrum. Viewing their assessments from the perspective of historical developments in foreign aid, on the one hand, and the analytical literature on aid effectiveness, on the other, is a general aim of this paper.
The remainder of this study is structured in six parts.1 In Section 1,
I define what is meant by foreign aid and provide selected data on amounts and trends involved. Section 2 contains a general historical background, while Sections 3 and 4 turn to the allocation and impact of foreign aid. In Section 5, I discuss the current debate, while Section 6 concludes.
1. What is foreign aid?
What is foreign aid? Loosely speaking, it covers governmental trans-fers to poor countries that are destined for developmental purposes. For a more precise definition, it is useful to turn to the Development Assistance Committee (DAC) of the OECD. DAC is the principal body through which the OECD deals with issues related to co-operation with developing countries. According to DAC, the term “foreign aid” or “development assistance” refers to financial flows that qualify as Official Development Assistance (ODA). ODA is de-fined as the sum of grants and loans to aid recipients that are: (a) un-dertaken by the official sector of the donor country; (b) with promo-tion of economic development and welfare in recipient countries as the main objective; (c) at concessional financial terms, where the grant element is equal to at least 25 per cent.2
1 In preparing this review, I rely both on field experience and a variety of academic
outputs. They include (i) a Routledge book volume on “Foreign Aid and Development: Lessons learnt and Directions for the Future” (see Tarp, 2000); (ii) several articles pub-lished over the past five years, in particular including work with Dalgaard, Hansen and Roland-Holst listed in the references; and (iii) the notes from my inaugural lecture held at University of Copenhagen on 29 November 2002 under the heading “Reflections on the Effectiveness of Foreign Aid”. Please see Arndt, Jones and Tarp (2006) for a companion paper to the present article, focusing on what can be said about aid and development in a specific country context—that of Mozambique.
2 Conventionally, the market rate of interest used to assess a loan is taken as 10 per
In addition to financial flows, technical co-operation costs are in-cluded in ODA; but grants, loans and credits for military purposes are excluded, and transfer payments to private individuals are in general not counted. The same goes for private charity, commercial loans and foreign direct investment (FDI).
While the OECD operates with a consolidated list of recipient countries to capture all aid-like flows, this list was divided into two parts until 2005. Only aid to “traditional” developing countries counted as ODA. For these (Part I) countries, there is a long-standing United Nations (UN) target from 1970 that they should receive 0.7 per cent of donors” Gross National Income (GNI) as aid. Assistance to the “more advanced” Eastern European and “more advanced” de-veloping (Part II) countries was recorded separately as “official aid” (OA), not included as part of ODA. It can finally be noted that DAC countries account for almost 95 per cent of all aid flows.3
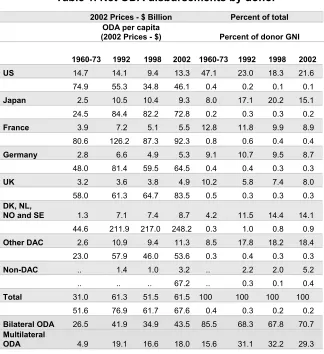
In 2002, the total amount of foreign aid disbursed by donors to developing countries and multilateral organisations reached 61.5 bil-lion USD (Table 1). Table 1 also shows that the average citizen in the OECD-DAC countries contributed less than USD 68 as ODA in 2002. This can be compared to a figure of around USD 52 in 1960-73 and almost USD 77 in 1992.4 It is equally clear from the table that the
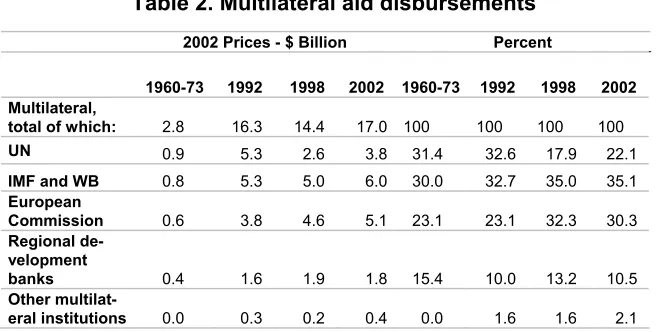
UN target of 0.7 per cent of GNI is, with few exceptions, very far from being reached. In this perspective, it is hardly surprising that some, such as Sach (2005) and many others, find the present levels of aid unacceptably low. It can also be noted that multilateral organisa-tions are now disbursing around 30 per cent of total foreign aid, with the IMF and World Bank being the major channels, followed by the EU, the UN and the regional development banks (Table 2).
3 The OECD decided in 2005 to revert to a single list of ODA recipients,
abolish-ing what is referred to as Part II in what follows. The new DAC list of ODA recipi-ents is with a few exceptions consistent with World Bank practice, see http://www.oecd.org/document/56/0,2340,en_2649_34447_35832055_1_1_1_1,0 0.html for full details on the rather complicated set of changes that have taken place over the years.
4 Note that constant 2002 prices are relied on in Table 1. Only sixteen of the now
Table 1. Net ODA disbursements by donor
2002 Prices - $ Billion Percent of total ODA per capita
(2002 Prices - $) Percent of donor GNI
1960-73 1992 1998 2002 1960-73 1992 1998 2002
US 14.7 14.1 9.4 13.3 47.1 23.0 18.3 21.6
74.9 55.3 34.8 46.1 0.4 0.2 0.1 0.1
Japan 2.5 10.5 10.4 9.3 8.0 17.1 20.2 15.1
24.5 84.4 82.2 72.8 0.2 0.3 0.3 0.2
France 3.9 7.2 5.1 5.5 12.8 11.8 9.9 8.9
80.6 126.2 87.3 92.3 0.8 0.6 0.4 0.4
Germany 2.8 6.6 4.9 5.3 9.1 10.7 9.5 8.7
48.0 81.4 59.5 64.5 0.4 0.4 0.3 0.3
UK 3.2 3.6 3.8 4.9 10.2 5.8 7.4 8.0
58.0 61.3 64.7 83.5 0.5 0.3 0.3 0.3
DK, NL,
NO and SE 1.3 7.1 7.4 8.7 4.2 11.5 14.4 14.1
44.6 211.9 217.0 248.2 0.3 1.0 0.8 0.9
Other DAC 2.6 10.9 9.4 11.3 8.5 17.8 18.2 18.4
23.0 57.9 46.0 53.6 0.3 0.4 0.3 0.3
Non-DAC .. 1.4 1.0 3.2 .. 2.2 2.0 5.2
.. .. .. 67.2 .. 0.3 0.1 0.4
Total 31.0 61.3 51.5 61.5 100 100 100 100
51.6 76.9 61.7 67.6 0.4 0.3 0.2 0.2
Bilateral ODA 26.5 41.9 34.9 43.5 85.5 68.3 67.8 70.7
Multilateral
ODA 4.9 19.1 16.6 18.0 15.6 31.1 32.2 29.3
Notes: Denmark (DK) since 1978, Netherlands (NL) since 1975, Norway (NO) since 1976, and Sweden (SE) since 1975 have all had ODA in percent of GNI above 0.7. Luxembourg has been above the UN ODA target of 0.7 per cent since 2000.
Table 2. Multilateral aid disbursements
2002 Prices - $ Billion Percent
1960-73 1992 1998 2002 1960-73 1992 1998 2002 Multilateral,
total of which: 2.8 16.3 14.4 17.0 100 100 100 100
UN 0.9 5.3 2.6 3.8 31.4 32.6 17.9 22.1
IMF and WB 0.8 5.3 5.0 6.0 30.0 32.7 35.0 35.1
European
Commission 0.6 3.8 4.6 5.1 23.1 23.1 32.3 30.3
Regional de-velopment
banks 0.4 1.6 1.9 1.8 15.4 10.0 13.2 10.5
Other
multilat-eral institutions 0.0 0.3 0.2 0.4 0.0 1.6 1.6 2.1
Source: OECD (2004).
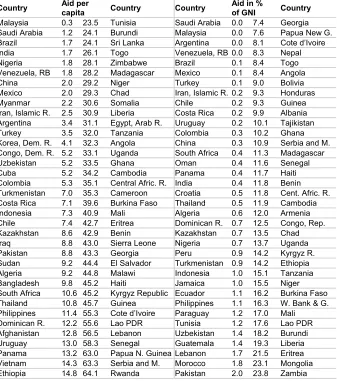
Table 3 gives an overview of aid per capita and aid in per cent of GNI in aid receiving Part I countries with a population of more than 2 million. It is a widespread perception in, for example, the US that foreign aid amounts to a very significant resource, in both absolute and relative terms, and aid is indeed not an insignificant flow meas-ured relative to developing country production and income. At the same time, aid does not appear that sizeable when measured in rela-tion to GNI or government budgets in the donor countries or in comparison with the population size of aid receiving countries.
Table 3. Average annual (1993-2002) aid shares for countries with populations larger than 2 million
Country Aid per
capita Country Country
Aid in %
of GNI Country
Malaysia 0.3 23.5 Tunisia Saudi Arabia 0.0 7.4 Georgia Saudi Arabia 1.2 24.1 Burundi Malaysia 0.0 7.6 Papua New G. Brazil 1.7 24.1 Sri Lanka Argentina 0.0 8.1 Cote d’Ivoire
India 1.7 26.1 Togo Venezuela, RB 0.0 8.3 Nepal
Nigeria 1.8 28.1 Zimbabwe Brazil 0.1 8.4 Togo
Venezuela, RB 1.8 28.2 Madagascar Mexico 0.1 8.4 Angola
China 2.0 29.2 Niger Turkey 0.1 9.0 Bolivia
Mexico 2.0 29.3 Chad Iran, Islamic R. 0.2 9.3 Honduras
Myanmar 2.2 30.6 Somalia Chile 0.2 9.3 Guinea
Iran, Islamic R. 2.5 30.9 Liberia Costa Rica 0.2 9.9 Albania Argentina 3.4 31.1 Egypt, Arab R. Uruguay 0.2 10.1 Tajikistan
Turkey 3.5 32.0 Tanzania Colombia 0.3 10.2 Ghana
Korea, Dem. R. 4.1 32.3 Angola China 0.3 10.9 Serbia and M. Congo, Dem. R. 5.2 33.1 Uganda South Africa 0.4 11.3 Madagascar
Uzbekistan 5.2 33.5 Ghana Oman 0.4 11.6 Senegal
Cuba 5.2 34.2 Cambodia Panama 0.4 11.7 Haiti
Colombia 5.3 35.1 Central Afric. R. India 0.4 11.8 Benin Turkmenistan 7.0 35.3 Cameroon Croatia 0.5 11.8 Cent. Afric. R. Costa Rica 7.1 39.6 Burkina Faso Thailand 0.5 11.9 Cambodia
Indonesia 7.3 40.9 Mali Algeria 0.6 12.0 Armenia
Chile 7.4 42.7 Eritrea Dominican R. 0.7 12.5 Congo, Rep.
Kazakhstan 8.6 42.9 Benin Kazakhstan 0.7 13.5 Chad
Iraq 8.8 43.0 Sierra Leone Nigeria 0.7 13.7 Uganda
Pakistan 8.8 43.3 Georgia Peru 0.9 14.2 Kyrgyz R.
Sudan 9.2 44.4 El Salvador Turkmenistan 0.9 14.2 Ethiopia
Algeria 9.2 44.8 Malawi Indonesia 1.0 15.1 Tanzania
Bangladesh 9.8 45.2 Haiti Jamaica 1.0 15.5 Niger
South Africa 10.6 45.2 Kyrgyz Republic Ecuador 1.1 16.2 Burkina Faso Thailand 10.8 45.7 Guinea Philippines 1.1 16.3 W. Bank & G. Philippines 11.4 55.3 Cote d’Ivoire Paraguay 1.2 17.0 Mali
Dominican R. 12.2 55.6 Lao PDR Tunisia 1.2 17.6 Lao PDR Afghanistan 12.8 56.5 Lebanon Uzbekistan 1.4 18.2 Burundi Uruguay 13.0 58.3 Senegal Guatemala 1.4 19.3 Liberia Panama 13.2 63.0 Papua N. Guinea Lebanon 1.7 21.5 Eritrea Vietnam 14.3 63.3 Serbia and M. Morocco 1.8 23.1 Mongolia
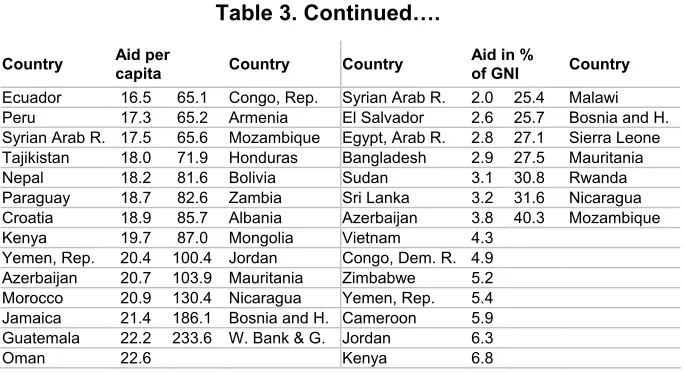
Table 3. Continued….
Country Aid per
capita Country Country
Aid in %
of GNI Country
Ecuador 16.5 65.1 Congo, Rep. Syrian Arab R. 2.0 25.4 Malawi Peru 17.3 65.2 Armenia El Salvador 2.6 25.7 Bosnia and H. Syrian Arab R. 17.5 65.6 Mozambique Egypt, Arab R. 2.8 27.1 Sierra Leone Tajikistan 18.0 71.9 Honduras Bangladesh 2.9 27.5 Mauritania
Nepal 18.2 81.6 Bolivia Sudan 3.1 30.8 Rwanda
Paraguay 18.7 82.6 Zambia Sri Lanka 3.2 31.6 Nicaragua Croatia 18.9 85.7 Albania Azerbaijan 3.8 40.3 Mozambique
Kenya 19.7 87.0 Mongolia Vietnam 4.3
Yemen, Rep. 20.4 100.4 Jordan Congo, Dem. R. 4.9 Azerbaijan 20.7 103.9 Mauritania Zimbabwe 5.2 Morocco 20.9 130.4 Nicaragua Yemen, Rep. 5.4 Jamaica 21.4 186.1 Bosnia and H. Cameroon 5.9 Guatemala 22.2 233.6 W. Bank & G. Jordan 6.3
Oman 22.6 Kenya 6.8
Figure 2 shows that the allocation of aid from 1993 to 2002 as measured by the aid to GNI ratio in aid receiving countries is highly skewed. Most Part I countries received aid in the order of 3.1 per cent of their GNI per year with a median of 6.8 per cent. This corresponds to a distribution of aid per capita with a mode of 18.5 USD per year and a median of 34.6 USD. Illustrative country examples have been added to Figure 2. They demonstrate that the relative size of the aid inflow varies significantly among countries such as Vietnam, Bolivia, Tanzania and Mozambique.
The 15.1 per cent size of the aid to GNI ratio in, for example, Tanzania may seem high. It should be kept in mind, however, that this share does not only reflect the size of the aid flow, but also the very low level of income. Income per capita in Tanzania has just re-cently grown to around USD 300 per capita. Tanzania only received about USD 32 per capita per year in foreign aid from 1993 to 2002.
Figure 1. ODA per capita and as a percent of GNI in the recipient country
.5 1 1.5 2 2.5
1970 1980 1990 2000
Year
Aid per capita Aid in % of GNI
Note: ODA and GNI in constant 1995 USD, and shares normalized to 1 in 1970.
Source: World Bank (2004).
Figure 2. Density of average annual (1993-2002) ODA shares
Mozambique (40.3%) Tanzania (15.1%) Bolivia (9.0%) Vietnam (4.3%)
Bolivia (65.6$) Mozambique (65.6$)
Tanzania (32.0$) Vietnam (14.3$)
0 .01 .02 .03 .04 .05
0 20 40 60 80 100
Aid in % of GNI Mode: 3.1% Median: 6.8% Iqr: 13.8%point Min: 0.01% Max: 100.7% Aid per capita, US$ Mode: 18.5$ Median: 34.6$ Iqr: 69.1$ Min: 0.3$ Max: 3742.2$
Note: Kernel density using Gaussian kernel. The height of the graph reflects the (weighted) average number of observations in an interval around the midpoint.
[image:12.612.181.431.375.556.2]2. Historical background
Foreign aid in its modern form emerged out of the disruption that followed World War II. The international economic system had col-lapsed, and war-ravaged Europe faced a critical shortage of capital and an acute need for physical reconstruction. The response was the European Recovery Programme, commonly known as the Marshall Plan. During the peak years, the US transferred some 2-3 per cent of its national income to help restore Europe. The motives behind the US aid were multifaceted, ranging from the selfish to the generous. Containing communism around the Soviet bloc and trying to secure access to raw materials and gain a leading role in the global trade and investment system were critically important nationalistic concerns. Altruistic aims, on the other hand, helped mobilize support from a wide spectrum of political opinion. The Marshall Plan, which was administered by the Organization for European Economic Coopera-tion (OEEC), the predecessor of the OECD, was implemented on schedule, and its success fuelled highly optimistic expectations about the future effectiveness of foreign aid.
After the success of the Marshall Plan, the attention of industrial-ized nations turned to the developing countries, many of which be-came independent around 1960. Economic growth in a state-led planning tradition became a key objective during the 1950’s and 1960’s, and it was widely believed that poverty and inequality would quickly be eliminated through growth and modernization (“trickle down”). A major part of the rapidly increasing bilateral flows during the 1950’s came from the US, but colonial ties remained strong, and developing regions continued to receive bilateral (country-to-country) support from the former colonial powers, notably France and the United Kingdom. Yet, the 1960’s was also the decade where a range of new bilateral donor agencies was established in, for example, the Nordic countries. They accounted for much of the increase in aid flows in the 1970’s.
A transition toward more independent, multilateral relations began to emerge during the 1960’s. This created a constituency for foreign aid, and the non-aligned movement for some time gave an articulated developing country focus to this voice,5 as did the various organs of
5 The first official non-aligned movement (NAM) summit was held in September of
the UN. They accounted for around one third of multilateral assis-tance during 1960-73 as shown in Table 2. The International Bank for Reconstruction and Development (IBRD) (or World Bank), estab-lished at the Bretton Woods Conference in 1944, plays a central role in multilateral development assistance, especially following the crea-tion of the Internacrea-tional Development Associacrea-tion (IDA) in 1960. IDA channels resources to the poorest countries on “soft” conditions alongside the regional development banks, formed from 1959 to 1966, and the European Commission.
The original Marshall Plan was built around support to finance general categories of imports and strengthen the balance of payments (i.e. programme aid), but from the early 1950’s, project aid became the dominating aid modality. Some donors continued to supply pro-gramme aid, but aid was increasingly disbursed for the implementa-tion of specific capital investment projects and associated technical assistance with support advances in infrastructure and productive sec-tors.
The multilateralism of aid became somewhat more pronounced af-ter the mid-1970’s, when the UN, World Bank and other multilaaf-teral agencies expanded their activities quite considerably, and the share of multilateral aid in total aid has since then remained close to 30 per cent. The 1970’s also saw an increased focus on employment, income distribution, and poverty alleviation as essential objectives of devel-opment and foreign aid. The effectiveness of trickle-down was widely questioned, and new strategies referred to as “basic human needs’ and “redistribution with growth” were formulated. Nevertheless, the typi-cal project aid modality largely remained unchanged; and micro-economic project evaluation, also referred to as cost-benefit analysis (CBA), was expanded and widely relied on in the aid debate. Many projects were favourably evaluated, and during the 1960’s and 1970’s, economic progress was visible in much of the developing world. Many developing countries borrowed heavily during the 1970’s, and this made eminent sense at the time. Inflation was high and credit ex-ceedingly cheap. After the first oil crisis in 1973, commercial banks started playing a large role in international lending by recycling OPEC petrodollars and issuing general-purpose loans to developing
tries to provide balance of payment support and expand exports. Bi-lateral donors and the international financial institutions (IFIs) were no longer alone on the lending scene. International lending surged, which permitted high growth with little debt-servicing difficulty.
The “golden era” of the 1960’s and 1970’s came to an abrupt end at the beginning of the 1980’s. The second oil shock in 1979 reversed the economic conditions, and there was a huge increase in interest rates due to the economic stabilization policies in the developed countries. Developing countries were faced with a combination of higher oil prices, import compression and a significant decrease in export opportunities due to slower overall global growth. The interna-tional debt crisis erupted, and macroeconomic imbalance became characteristic. It became evident that the downturn was longer lasting, not temporary as in 1973, and numerous debtor countries with de-pleted foreign exchange reserves, including bigger third world coun-tries such as Mexico, Brazil, Argentina and the Philippines, had to turn to the IMF. On the political scene, Ronald Reagan and Margaret Thatcher came into power in the US and the UK, and in the World Bank, Anne Krueger became Vice President and Chief Economist, replacing Hollis Chenery. This change was symbolic and substantive (Kanbur, 2003). Economic circumstances in the developing countries and the relations between the North and South had changed radically. The crisis hit hard, especially in many African countries. Progress over previous decades ground to a halt, inflation got out of control and the deficit in the balance of payments could not be financed on a sustainable basis. The Focus of development strategy and policy shifted to internal domestic policy failure, and achieving macroeco-nomic balance (externally and internally) became widely perceived as an essential prerequisite for renewed development. In parallel, a series of damaging political and military conflicts broke out, including mass homicides, major refugee problems and famines in a variety of Afri-can countries.
“ad-justment with a human face” approach of the UN Children’s Fund (Cornia, Jolly and Stewart, 1987).
At the same time, bilateral donors and international agencies strug-gled with how to channel resources to the developing world. The changing economic context and future perspectives had altered the development scene. Quick-disbursing macroeconomic programme assistance, such as balance of payments support and sector budget support (which were not tied to investment projects, and which could be justified under the headings of stabilisation and adjustment), ap-peared to be an ideal solution to the dilemma of maintaining the re-source flow and the desire to promote policy reform. Financial pro-gramme aid and adjustment loans (and eventually debt relief) became fashionable and policy conditionality more widespread. In other words, a rationale, which corresponded well with the orthodox guide-lines for good policy summarized by the “Washington consensus” (Williamson, 1997), had been found for maintaining the aid flow.6
Total aid continued to grow steadily in real terms until the early 1990’s, and as a rising share of the growing national income of the donor community it more than tripled during 1970–90. After 1992, total aid flows started to decline in absolute terms until the turn of the millennium. Many reasons account for the fall in aggregate flows after 1992, including first of all the end of the Cold War. The same can be said for the weakening patron-client relationships among the develop-ing countries and the former colonial powers. The traditional support of foreign aid by vocal interest groups in the industrial countries re-ceded. Bilateral and multilateral aid institutions were subjected to criticism and, at times, characterized as blunt instruments of commer-cial interests in the industrial world or as self-interested, inefficient rent-seeking bureaucracies. Moreover, acute awareness in donor countries of cases of bad governance, corruption, and “crony capital-ism” led to scepticism about the credibility of governments receiving aid. The potential role of foreign aid in all this attracted attention, and the fear that aid can generate undesirable dependency relationships became clear during the second part of the 1990’s and persisted into the 21st century.
In parallel, the perception that policy conditionality was failing to promote policy reform started to assert itself, see Kanbur (2000) and Svensson (2003). This assessment prompted a keen interest in new
kinds of donor-recipient relationships. One outcome was the call for increased national ownership of aid programmes. Another was that the World Bank and independent academic researchers started dig-ging into the aid-growth relationship using modern analytical tech-niques. More recent attempts to develop randomized programme evaluation also appeared on the scene, see for example Duflo (2004).7
Meanwhile, the developing world was hit hard by the Asian financial crisis. It affected development outcomes in a number of countries and modified the framework within which aid is implemented.
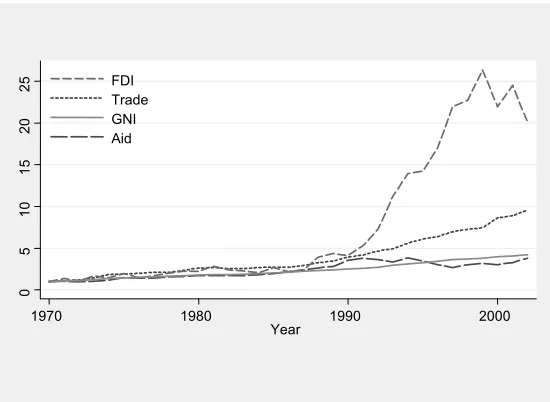
Finally, when reviewing the role and impact of foreign aid, it should be kept in mind that the world economy has during the past few decades seen major changes in international relations that go far beyond the changes in foreign aid. Growth in trade, GDP and the relationship between trade and growth have filled volumes with statis-tical tables, policy analysis, and academic research. With reference to foreign aid, a few trends are of particular relevance.8 Figure 3 shows
how global trade as well as ODA, GNI and FDI in aid-receiving countries evolved from 1970 onwards. This figure only reflects the relative changes in flows, not their relative magnitudes,9 but it is
evi-dent that global trade has been growing faster than both GNI and aid flows to poor countries. This is especially the case from around the mid-1980’s, and the importance of FDI started changing very consid-erably in the early 1990’s.
In sum, globalization has modified the context in which foreign aid is implemented. This suggests, on the one hand, that a broader and more refined awareness of the implications of coexistence be-tween public and private investment in developing countries would be beneficial. On the other hand, it implies that aid’s role in generating foreign exchange has changed relative to other entries on the balance of payments.
7 I will not pursue the set of issues related to this approach to aid impact evaluation
here. See Bigsten, Gunning and Tarp (2006) and Thorbecke (2005) for elaboration.
8 See also Roland-Holst and Tarp (2004).
9 FDI accounted for only 2.3 per cent of GDP in low- and middle-income
Figure 3. Macroeconomic indicators in aid receiving countries
0
5
10
15
20
25
1970 1980 1990 2000 Year
FDI Trade GNI Aid
0
5
10
15
20
25
1970 1980 1990 2000 Year
FDI Trade GNI Aid
Notes: All variables are expressed as an index equal to one in 1970 and constructed from series in constant 1995 USD. FDI is constructed from net FDI inflows and trade is based on the sum of exports and trade is based on the sum of exports and imports.
Source: World Bank (2004).
3. Aid allocation
Emphasis on the needs of poor countries was a particularly promi-nent characteristic—and the underlying economic rationale—in much of the policy literature on foreign aid in the 1950’s and 1960’s. Here, the focus was on estimating aid requirements in the tradition of the two-gap model, (Chenery and Strout, 1966). The two-gap model has been subjected to heavy criticism,10 and the role of aid has changed to
a much more multi-dimensional set of concerns (Thorbecke, 2000). Economic return is by no means the only goal of aid. Nevertheless, growth and economic development in aid receiving countries have continued as a yardstick for the effectiveness of aid, both in their own right and as necessary conditions for the realisation of other devel-opment aims, such as the reduction of poverty and the achievement of broader social goals. It is from this perspective that the discussion in Section 4 on aid’s impact on growth should be seen.
A second observation from Table 3 is that large, populous and poor countries, such as China and India receive relatively small amounts of aid in per capita terms. Smaller countries such as Mali, Ghana, Bolivia and Sri Lanka are given a more favourable per capita treatment. This finding is confirmed econometrically by Alesina and Dollar, but they stress the critical and complex importance of political and strategic considerations in aid allocations.
It is not new that selfish motives are critical in donor decisions. In the past, the Cold War was used as a powerful justification for provid-ing aid to developprovid-ing countries to stem the spread of communism. Similarly, aid from socialist governments was motivated to promote socialist political and economic systems. Other strategic interests play a role as well. The US has over the years earmarked very substantial amounts of aid to Egypt and Israel;11 being a former colony is an
im-portant determinant in getting access to French aid; and voting be-haviour in the UN can affect aid allocation both bilaterally (Alesina and Dollar, 2000) and through the multilateral system (Andersen, Harr and Tarp, 2006). Berthélemy and Tichit (2004) and Berthélemy (2006) offer further valuable insights into how bilateral donors are influenced in aid allocations by their own strategic and commercial interest versus the development motives of aid recipients, and into the fact that not all donors behave in the same way.
10 See Jones (1995) and Easterly (1999) for two key references.
11 To this list can be added Iraq and Afghanistan. For example, US aid to Iraq
In sum, the donor community has clearly failed to meet the estab-lished international target of contributing 0.7 per cent of their national income as ODA. As shown in Table 1, only the group of Nordic countries and the Netherlands has consistently met this target, while the US contributed around 0.1 percent of the US GNI in 2002.12
Fi-nally, it is well established that total ODA, ODA per capita, ODA as a share of GNI and ODA as a share of total financial inflows vary considerably in real terms among aid receiving countries (see Tarp, 2006). All in all, donor motives are complex and range from equating aid with charity, on the one hand, to strict self-interest and national security, on the other.
4. The impact of foreign aid
Various approaches have been tried to deal with the challenge of measuring the “true” impact of aid on development, as reflected by growth or progress in social indicators, for example.13 One is to
com-pare implicit or explicit targets with actual outcomes. The problem with this is that failure or success in reaching a target may be caused by reasons that are related to the provision of foreign aid. Another quite common approach is to rely on before-and-after comparisons, but this line of analysis also suffers from its inherent inability to at-tribute changes in observed outcomes to foreign aid. In other words, in assessing the impact of aid, it is not satisfactory to casually argue that since growth in Africa is far from satisfactory, aid “does not work”. Similarly, the fact that some aid projects have failed does not in any way prove that aid as a whole is a fiasco. Unsuccessful invest-ment projects and public sector activities abound in even the best of political, social and economic circumstances around the world and few would dream of lambasting private multinational firms for failed initiatives if the bottom line is on average satisfactory. In fact, most people would probably agree that if investments are always successful, then investor behaviour is likely to be too risk averse. Development is and will always be a particularly risky business. Any serious analysis must either (i) try to dig deeper in an attempt to uncover whether for-eign aid has on average had a positive impact on development in aid receiving countries or not, or (ii) aim at identifying the mechanisms
12 This share has increased in the last couple of years, but US aid as a share of US
GNI remains small.
through which aid impacts on for example growth, including the po-tential positive and negative effects (i.e. returns) associated with for-eign aid.
To be able to measure the effect of aid, the researcher must, in principle, be able to compare the value of a chosen indicator (such as growth or poverty reduction) in two strictly independent situations: with and without aid. To establish the “true” measure of aid impact, the importance of all other circumstances that have affected a given country over time needs to be properly accounted for.14 Alternatively,
if a group of countries is compared (with and without aid), the analyst needs to account for the impact on the chosen indicator of the other differences that exist among the units of observation, like in a con-trolled experiment. This is the fundamental evaluation challenge and in social science, there is no way of addressing this problem (i.e. the challenge of establishing an appropriate counterfactual) in a broadly acceptable way without making assumptions that are bound to be de-batable, in theory and in practice.
In Section 3, it was pointed out that aid has been given for many reasons that have little relation to socio-economic advancement in aid receiving countries. This has undoubtedly constrained the impact of aid on growth and development. The targets for aid have also varied wildly from one decade to the next. The same goes for the general political, social and economic circumstances as discussed in Section 2, and the modalities and sources of aid have changed as well. As a re-sult, the conditions under which aid has had to operate have changed dramatically from one decade to the next. Coming up with simple an-swers about how aid has worked—or not worked—in promoting de-velopment in the past is no easy task. We can draw on history, but we do not have the possibility of perfectly controlled experiments, in providing an answer to questions such as whether aggregate aid has worked or not. There is, to be sure, no simple way of properly ac-counting for all the many varied and complex factors of daunting size, which have played a role in African development over the past 30 years—alongside foreign aid generally amounting to around USD 35 per capita per year.15
14 This includes choosing the length of individual time units and an appropriate
overall time horizon, which are by no means simple choices.
15 Naturally, this does not mean that economics ignores the possibility of using
In any case, the past decades have witnessed a massive outpouring of studies on the effectiveness of foreign aid. This topic has been a central and recurring theme with which many development econo-mists, subscribing to the different paradigms of development think-ing, have grappled and the methodologies have varied. More specifi-cally: (i) the impact of aid has been evaluated at the micro- and mac-roeconomic level; (ii) cross-country comparisons as well as single-country case studies have been relied on; and (iii) aid effectiveness research includes broad surveys of a qualitative and inter-disciplinary nature as well as more quantitative econometric work.16 As a point of
departure for the remainder of this paper, it is relevant to stress that there is widespread agreement in the literature that aid has in many cases been highly successful at the microeconomic level. The most rigorous project evaluations are done by the World Bank, and reports from the Independent Evaluation Group of the World Bank are gen-erally encouraging. For the period 1993-2002, an average rate of re-turn of 22 per cent has been noted and decent project rates of rere-turn have over the years regularly been reported in one survey after the other, including for example Mosley (1987) and Cassen and Associ-ates (1994). Overall, a mass of project evidence has been collected. Few dispute that aid interventions have worked in helping improve social outcomes through better health, helping promote the develop-ment of appropriate technology (i.e. the green revolution) etc. Yet, doubts about aid’s overall impact on growth and development linger on, and the question is regularly raised whether all this adds up at the macro level.
Therefore, it is relevant to turn to how the empirical literature on aid’s macroeconomic impact on growth has evolved. This choice of focus can be justified on several grounds. First, as an extension of the microeconomic evidence, according to the World Bank (1998), nu-merous case studies support the observation that aid has, at times, been a spectacular success. In establishing causal links, the critical challenge is, as noted above, to pinpoint a credible counterfactual, and it is never straightforward to generalize from case studies. Another reason for the popularity in the past 10-15 years of the cross-country panel data approach is that it makes it possible to move well beyond simplistic aid-growth correlation analysis, where the analysis of causal
16 The reader may wish to consult for example Cassen and Associates (1994) for a
effects is indeed rather primitive. It should, in fact, come as no sur-prise to the informed observer that the simple correlation coefficient between growth and aid can easily turn out to be insignificant, or negative. As already discussed, donors allocate more aid to poorer countries, subject to difficulties and shocks of many kinds, including natural and man made calamities. When countries have done well for a while so average income has gone up, donors tend to transfer less aid and eventually, they will withdraw (as it happened in for example the case of Korea). While such “graduation” may take a while, simple correlations are against this background likely to show a negative rela-tionship; and they will certainly not reveal the “true” impact of aid.
In modern aid-growth work, the analyst can attempt to control for the impact of a large range of variables, and in this way becomes able to move somewhat closer to the ideal of having a reliable counterfac-tual.17 The analyst is, at least in principle, capable of addressing issues
such as the identification problem inherent in having aid endoge-nously allocated in the foreign aid system. Second, a focus on growth makes it, in a wider perspective, possible to draw on both traditional growth theory and new growth models to illustrate how aid can po-tentially impact through a highly diverse set of channels.18 Third,
mac-roeconomic studies are required in order to help generalize about the overall impact of aid on growth and economic development. Fourth, the aid-growth literature continues to be highly influential in shaping common perceptions about the significance and impact of foreign aid. Fifth, whether aid helps growth or not is essentially an empirical ques-tion.
The quantitative cross-country analyses of the macroeconomic im-pact of foreign aid on growth, which by now span almost four dec-ades, can be classified into three generations, see Hansen and Tarp (2000). Work in the first two generations (where aid’s impact on growth via savings and investment was in focus) was inspired by the simple Harrod-Domar model and the two-gap Chenery-Strout exten-sion. This framework was, as mentioned in Section 3, extensively used in the past as the analytical framework of choice for assessing aid im-pact; but from the early 1990’s, a third generation of panel based econometric studies came to dominate the academic and public dis-course. This work was in part motivated by the availability of much
17 The same can be said about the use of randomized programme evaluation, which
I do not pursue as already noted above. For perspective, see Thorbecke (2005).
better (panel) data across a range of countries and in part by insights emerging from new growth theory and the rapidly increasing number of general empirical studies of growth. In addition, the endogeneity of aid and other variables is addressed more consistently than before,19
and the aid-growth relationship is appropriately perceived as non-linear.
The underlying idea behind the Harrod-Domar model was indeed simple. Assume that physical capital is the only factor of production (so investment is the key constraint on growth) and assume as well that all aid is invested. Then, it is straightforward to calculate the growth impact of additional aid. If aid corresponds to six per cent of the gross national product and the capital-output ratio is estimated at 3.0,20 which is a rather typical estimate, then aid adds two percentage
points a year to the growth rate. The impact of aid is clearly positive, and aid works by helping fill either a savings- or a foreign exchange gap. The latter gap relates to the argument that aid represents foreign currency and as such, can facilitate imports of goods and services that may in some cases be critically important in output production over and above aid’s impact on relieving the savings constraint. This kind of reasoning has, however, led to wildly overoptimistic expectations about aid’s potential impact.21
First, it is a tall order to expect both a linear relationship between output and capital and that all aid is invested. As discussed in Section 3, aid is provided for many reasons. For example, food aid in famine situations is not intended as an investment. In addition, the share of aid that ends up being invested (rather than consumed) will, in even the very best of circumstances, depend on the degree of fungibility of
19 The wider ranging and complex econometric endogeneity problems inherent in
relying on time averages for aid and growth, typically used in panel data growth regressions are laid out in Dalgaard, Hansen and Tarp (2004). They point out that not only aid but also policy is likely to be endogenous.
20 Note from Figure 1 that the annual median aid to GNI ratio amounted to 6.8 per
cent from 1993 to 2002.
21 Whether this completely discredits the two-gap model, as argued by some
the foreign aid transfer.22 On the other hand, even if aid adds to
do-mestic savings and investment on less than a one to one basis, aid does continue to have a positive impact on growth in the traditional line of thinking—as long as total savings and investment go up.23
A second line of critique of the Harrod-Domar and two-gap ap-proach has been the argument that growth is less related to physical capital investment (including aid) than what is often assumed (East-erly, 2001). If the key driver of the productive impact of aid is related more to incentives and relative prices and more generally to the policy environment, then it becomes important to consider potentially dis-tortionary effects of aid on incentives and economic policies in the aid receiving system and vice versa. An example is “Dutch disease”, and domestic demand and resource allocation may be twisted in undesir-able directions following a large aid inflow if macroeconomic man-agement is weak. One concrete example is that aid donors often pay much higher wages to national experts and staff than equally—and in many cases—more important national institutions.24
Third, a large and growing literature on the political economy of aid, see for example Kanbur (2003), Gunning (2005) and Svensson (2000), has argued that if aid allows a recipient government (local el-ites) to pursue behaviour that is in any way anti-developmental, then the potential positive impact of aid can be undermined. There are many such examples available in practice, ranging from outright mis-use of aid by corrupt governments to more subtle issues such as the potential negative impact of aid on domestic taxation (Adam and O’Connell, 1999).
22 Fungibility arises when the recipient can reallocate its own resources to other
ends when aid is provided. There is limited and conflicting evidence on the degree of fungibility of foreign aid, see for example Feyzioglu, Swaroop and Zhu (1998).
23 This observation goes back to Papanek (1972, 1973) and inspired Hansen and
Tarp (2000), who reviewed 131 cross-country regressions produced over three dec-ades. They challenged the widespread perception among academic researchers and aid practitioners that there are no significant macroeconomic links associated with foreign aid as stated by, for example, Michalopoulos and Sukhatme (1989) and White (1992). A re-examination of the then existing literature revealed that (i) aid increases savings, although not by as much as the aid inflow, (ii) aid increases in-vestment, and (iii) aid on average has a positive effect on the growth rate whenever growth is driven by capital accumulation. Hansen and Tarp therefore suggested that the micro-macro paradox identified by Mosley (1987) to which I shall return below is non-existent—even in the context of the traditional aid-growth literature.
The third generation debate about aid’s impact on growth is rooted in the above kinds of observations as well as in Mosley’s (1987) micro-macro paradox. He suggested that while aid seems to be effective at the microeconomic level,25 identifying any positive impact
of aid at the macroeconomic level is harder, or even impossible. In fact, the micro-macro paradox seemed self evident to many at the time it was formulated, where the general atmosphere was one of aid fatigue and lack of belief in a positive impact of aid on growth. An-other explanation, sometimes referred to as the “Iron Law of Econometrics”, in the terminology of Hausman (2001), received less attention.26 It must never be overlooked that once we try to explain a
“dirty” dependent variable with noisy data and weak proxies, it should come as no surprise that the result is biased towards zero, or in this case even towards the negative given the aid allocation behaviour of donors. What Mosley and many after him have struggled with is how to control for the wildly changing circumstances under which aid has been implemented. We can (and should) look to history and try to treat it as a controlled experiment but, at the end of the day, we are limited by the extent to which our proxies capture the massive changes in circumstances under which aid is implemented over time and across countries.
Boone (1994) managed to stir up the aid-growth debate again in the early to mid-1990’s. His work was cited in The Economist on 10 December 1994 under the colourful heading: “Aid Down the Ra-thole”, and Boone did indeed suggest that aid does neither create, nor correlate with those underlying factors which cause growth. Boone did not, however, occupy the centre stage for long. His underlying theoretical model was qualified by Obstfelt (1999). Moreover, Boone treated the aid-growth relationship as linear and, as is the case with many other aid papers, did not convincingly account for the potential endogeneity of aid.27 Finally, and much more importantly, a highly
influential idea spread, in part due to effective backing by the World
25 Dalgaard and Hansen (2005) also discuss the micro-economic evidence on
posi-tive ex-post rates of return of World Bank aid projects, referred to above. Median returns range between 10 to 30 per cent for the period 1996 to 2001.
26 Hausman (2001, p. 58) notes: “At MIT I have called this “The Iron Law of
Econometrics”—the magnitude of the estimate is usually lower than expected. It is also called “attenuation” in the statistical literature”. In what follows I will use the technical term, attenuation bias.
27 In Boone’s 1994 aid-growth regressions, he did not instrument for aid, but he did
Bank. This is the idea that while aid on average has no impact on growth, it may still work in some countries or time periods. Burnside and Dollar (1997, 2000) pursued this and argued that “aid has a posi-tive impact on growth in developing countries with good fiscal, monetary and trade policies”, and they added that in “the presence of poor policies, aid has no positive effect on growth”. In other words, aid works, but only in countries with “good policy”. They based this conclusion on an aid-policy interaction term, introduced to capture the non-linearity between aid and growth, which emerged as statisti-cally significant in their panel data analysis. In sum, Burnside-Dollar provided an attractive and very elegant solution to the micro-macro paradox with clear-cut and easy to interpret policy implications. In addition, they are very much in line with orthodox development thinking.
Burnside and Dollar, and more recently Collier and Dollar (2001, 2002), have used the foregoing framework as a basis for suggesting that aid should be directed to “good policy” countries to improve aid’s impact on poverty alleviation. The index meant to capture “good policy” has gradually been expanded from the Burnside-Dollar focus on budget surplus, inflation and openness to the World Bank’s Coun-try Policy and Institutional Assessment (CPIA) index.28 The argument
for selectively allocating aid is also, at least partly, justified with refer-ence to the finding that the amount of aid countries receive has no impact on the quality of their macroeconomic policies; a finding that also appeared to emerge from Bank-funded research (Devarajan, Dol-lar, and Holmgren 2001).29 While the Bank’s Monterrey document
(World Bank, 2002) toned down these recommendations, and the World Bank (2005a) strikes a very different line of argument in its interpretation of the policy reform process during the 1990’s, the ba-sic thrust in much of the international aid debate remains that macro-economic performance evaluation and policy criteria should play a key role in aid allocation.
28 The CPIA index assesses the quality of a country’s present policy and
institu-tional framework in 20 different dimensions, assessed by World Bank experts on a scale from 1 to 6. Each item has a 5 per cent weight in the overall rating. The items are grouped into four categories: “Economic Management”, “‘structural Policies”, “Policies for Social Inclusion/Equity” and “Public Sector Management and Institu-tions”.
The thorny academic dilemma in all this includes that: (i) Hansen and Tarp (2001) found that the Burnside-Dollar result is far from ro-bust. In fact, at the time, it appeared that diminishing returns where aid squared is introduced into the analysis to capture non-linear ef-fects between aid and growth was the empirical specification with most support in the data. In contrast, the data did not support the Burnside-Dollar aid-policy interaction term;30 (ii) Dalgaard and
Han-sen (2001) showed the same with the Burnside and Dollar data set, once it had been made available to researchers outside the World Bank, performing a general-to-specific test; (iii) Easterly et al. (2004) found the Burnside-Dollar aid-policy story to be fragile in the face of an expansion of the data set in years and countries; and finally (iv) Roodman (2004) offers a comparative assessment of the large number of stories on the relationship between how much foreign aid a coun-try receives and how it grows, which the contemporary econometric literature has generated. He concludes that the aid-policy link (identi-fied by Burnside-Dollar) proves the weakest, while the aid-tropics link (identified by Dalgaard, Hansen and Tarp, 2004) is most robust.
Dalgaard, Hansen and Tarp argue that aid and policy both depend on the average rate of growth, even though they are predetermined in the original system. Therefore, they take account of this in their em-pirical testing, which also controls for the potential endogeneity of institutions. In their attempt at assessing the importance of structural characteristics on aid effectiveness, they add the fraction of land in tropical areas as a proxy for climate related variables. This variable and its interaction with aid outperform both the “good policy” and “the diminishing returns” model. In concluding, Dalgaard, Hansen and Tarp make the point that it does appear from the data as if aid has been far less effective in tropical areas over the last 30 years. They
30 The turning point at which increased aid will start having a negative impact on
also stress that it is hard to believe that aid should, inherently, be less potent in the tropics. The real explanation for the aid-tropics link is in their assessment likely to lie elsewhere; and they call for further re-search to help disentangle the channels through which aid matters for productivity and efficiency. Their result also highlights that while there is merit in more sophisticated versions of arguments for selec-tivity, macroeconomic allocation rules critically depend on under-standing the complex links in particular country circumstances be-tween aid, growth and development objectives such as poverty reduc-tion.
What this (and the many other studies listed in for example Clem-ens, Radelet and Bhavnani, 2004) adds up to can in my assessment be summarized as follows:
• It may well be true that “aid pays a growth price” as growth regu-larly gives way to other concerns as the most important criterion for aid.31 Yet, the single most common result of recent empirical
aid-growth studies is that aid has a positive impact on per capita growth.32 At the same time, aid is by no means a panacea for
growth and poverty reduction.
• The way in which data are dealt with to address the complex issue of identifying the impact of aid on growth is critically important for the conclusions drawn. Methodological choices matter.
• The impact of aid on growth is not the same across aid recipients. There are differences in aid efficiency from country to country; and it remains unclear what drives these differences. In particular, the importance of “deep” structural characteristics in affecting how aid impacts on growth is not yet fully understood.
31 Food aid in famine situations geared toward increased consumption is a specific
case in point as is, more generally, aid for consumption that is not investment tar-geted.
32 Dalgaard and Hansen (2005) estimate that the aggregate real rate of return on
Furthermore, using “good policy” (in the form of the CPIA index) as a basis for selectively allocating aid is questionable. There are at least three reasons:
• An attraction of the original Burnside-Dollar index was its simplic-ity. It was controversial but easy to interpret. It is much harder to derive clear cut policy advice based on any positive interaction be-tween aid and the CPIA. The CPIA is, as already noted, a compos-ite index of 20 different variables grouped into four categories. In spite of the descriptive value of the CPIA index, which I do not question, it is from an analytical point of view far from easy to de-cipher what drives aid efficiency when indicators of “economic management”, “structural policies”, “social policies” and “public sector management and institutions” are aggregated into one measure. In addition, trade-offs between the elements of the index are bound to arise in practice. For example, placing greater empha-sis on budget balance (an element in “economic management”) may well be in conflict with improving health care, education etc. belonging to the component “building human resources” which forms part of “policies for social inclusion/equity”. Improved budget balance may also lead to a lower “pro-poor expenditure in-dex” shown to be poverty reducing by Mosley, Hudson and Ver-schoor (2004).
• The changes in the CPIA index may be caused by the growth per-formance, in which case the CPIA should not be used as an ex-ogenous variable.33 Moreover, Mauro (1995) highlights that using
expert evaluations may be problematic. The argument is that evaluators are likely to conclude that a particular set of institutions is good if the country in question is growing rapidly.
• The use of “good policy” may lead us to punish countries with un-favourable conditions instead of helping them. There is a very high probability that a country with a low CPIA is in the tropical region. If the variation in aid effectiveness across countries is not policy induced, but rather a result of poor initial conditions, a different approach to allocating aid must, as I see it, be established. At the
33 Similar concerns are alluded to by Cornia (2005) when he points out that it is far
same time, every effort must, of course, be made to help put in place improved policy, which helps growth and poverty reduction.
In sum, it is advisable to be alert about what is, in fact, unknown. This implies, for example, that in future research on foreign aid and development, more attention should be given to different modalities of aid (such as project versus programme assistance) and their design and application in different types of aid receiving countries. One dif-ficulty in this is that it is by no means straightforward to derive gen-eral results across countries with available theory and data.34
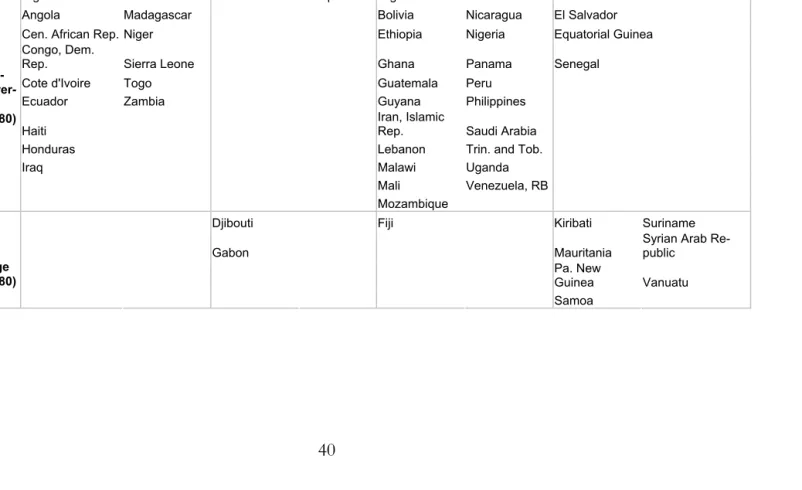
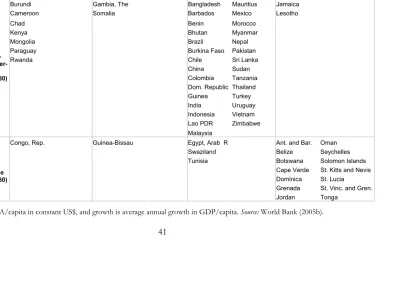
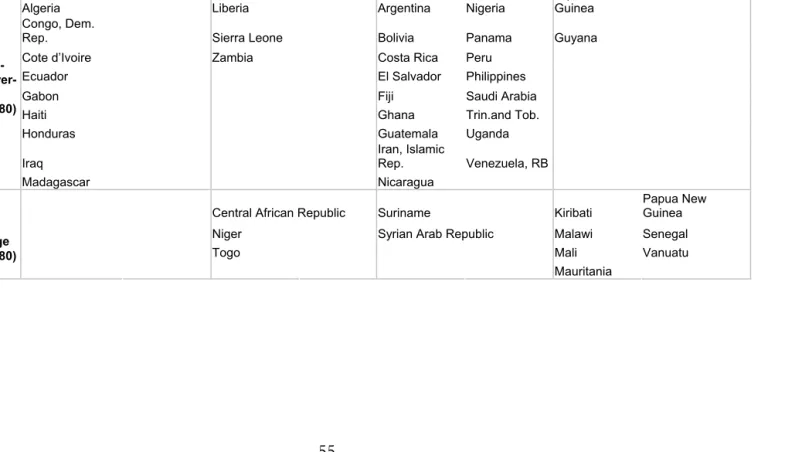
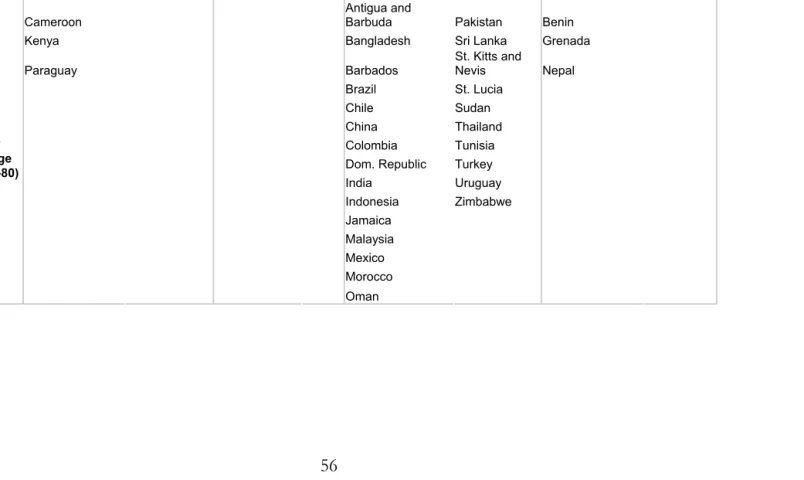
To put this in further perspective, it may be useful to take a prag-matic look at the aid-growth data in Table 4 (and the three additional tables in the Annex). They illustrate the difficulties of coming up with simple aid-growth stories. Inherent in this table is the following ques-tion: “Does aid above/below average in the 1970’s and 1980’s help determine whether countries were successful in terms of growth in the subsequent decades”? As is clear from the table, there are 16 cate-gories of aid-growth experiences. They can be summarized as follows in four sets of aid-growth experiences:
• 72 countries, a very clear majority, had below average aid in both the 1970’s and 1980’s. Some 21 of these countries moved from having negative growth in the 1980’s to positive growth in the 1990’s and joined the 29 countries in this group that had positive growth in both decades. Moreover, seven of these countries (Bur-indi, Cameroun, Chad, Kenya, Mongolia, Paraguay and Rwanda) turned from being positive to negative growth performers from the 1980’s to the 1990’s and joined the 15 that had negative growth in both decades.
• 24 countries had above average aid in both the 1970’s and 1980’s. Seven moved from being negative growth performers in the 1980’s and joined the 14 that had positive growth in both decades. Only one country (Guinea-Bissau) moved from positive growth in the 1980’s to negative growth in the 1990’s and joined the two (Dji-bouti and Gabon) that had negative growth in both decades.
• Only nine countries changed from below average aid in the 1970’s to above average aid in the 1980’s. They include four countries (Costa Rica, El Salvador, Equatorial Guinea and Senegal) that
34 See Clemens, Radelet and Bhavnani (2004) for an attempt, relying on
moved from negative to positive growth and joined two countries (Jamaica and Lesotho) with positive growth in both periods. Two countries (Gambia and Somalia) turned from positive to negative growth and joined the one country in this group (Sao Tome and Principe) with negative growth in both periods.
• Just five countries (Congo, Fiji, Egypt, Swaziland and Tunisia) changed from above average aid in the 1970’s to below average aid in the 1980’s. Three (Egypt, Swaziland and Tunisia) had positive growth in both periods. One (Fiji) changed from negative to posi-tive growth and only one (Congo) changed from posiposi-tive to nega-tive growth.
It should be recognized up-front that the implicit 10 year aid-growth impact lag in Table 4 is longer than the four-year lag that is typical in cross-country regression work, and I reiterate that this kind of empirical overview can at best be illustrative. No causality can be implied. It is notable that the two largest boxes are the groups of countries that had (i) positive growth post-1990, but (ii) below aver-age aid pre-1990. On the other hand, among the 24 countries that had above average aid pre-1990, no less than 21 had positive growth post-1990. In other words, below average aid does not seem to prevent growth from occurring (or that countries change growth category). Similarly, above average aid does not come across as harmful to growth or as a factor that makes it difficult to turn a negative growth trend around.
In sum, aid cannot on this basis be claimed to be a highly potent driver of growth and development across the board, but it is equally true that there is little in Table 4 to suggest that aid has done dam-age.35 Hard and clear cut evidence is difficult to uncover from this
kind of analysis. There is no simple answer. We do instead appear to be left with lots of special cases, where country-specific and other cir-cumstances have played a key role in determining the growth out-come and how donors reacted in the allocation of aid. This is one motivation why cross-country regression analysis has been so popular. Data are after all the plural form of anecdotes. But the picture in Ta-ble 4 also helps suggest why controversy remains so prevalent.
35 In addition to the results included in the Annex, I have experimented with a
Table 4. Aid and growth, 1970-2000
Negative growth (1990-2000) Positive growth (1990-2000)
Aid below average (1980-90)
Aid above average
(1980-90) Aid below average (1980-90) Aid above average (1980-90)
Algeria Liberia Sao Tome and Principe Argentina Namibia Costa Rica Angola Madagascar Bolivia Nicaragua El Salvador Cen. African Rep. Niger Ethiopia Nigeria Equatorial Guinea Congo, Dem.
Rep. Sierra Leone Ghana Panama Senegal Cote d'Ivoire Togo Guatemala Peru Ecuador Zambia Guyana Philippines
Haiti
Iran, Islamic
Rep. Saudi Arabia Honduras Lebanon Trin. and Tob.
Iraq Malawi Uganda
Mali Venezuela, RB
Aid be-low aver-age (1970-80)
Mozambique
Djibouti Fiji Kiribati Suriname
Gabon Mauritania
Syrian Arab Re-public
Pa. New
Guinea Vanuatu
Negative growth (1980-90)
Aid above average (1970-80)
Table 4. Continued….
Negative growth (1990-2000) Positive growth (1990-2000) Aid below average
(1980-90) Aid above average (1980-90) Aid below average (1980-90) Aid above average (1980-90)
Burundi Gambia, The Bangladesh Mauritius Jamaica Cameroon Somalia Barbados Mexico Lesotho
Chad Benin Morocco
Kenya Bhutan Myanmar Mongolia Brazil Nepal Paraguay Burkina Faso Pakistan Rwanda Chile Sri Lanka
China Sudan
Colombia Tanzania
Dom. Republic Thailand
Guinea Turkey
India Uruguay
Indonesia Vietnam
Lao PDR Zimbabwe
Aid be-low aver-age (1970-80)
Malaysia
Congo, Rep. Guinea-Bissau Egypt, Arab R Ant. and Bar. Oman Swaziland Belize Seychelles Tunisia Botswana Solomon Islands Cape Verde St. Kitts and Nevis
Dominica St. Lucia
Grenada St. Vinc. and Gren.
Positive growth (1980-90)
Aid above average (1970-80)
Jordan Tonga
5. Discussion of the current aid and development
debate
Has foreign aid been a success or failure in promoting development? Based on some of the contributions to the foreign aid literature over the past decade, including for example the works of Boone, Burnside-Dollar, Sachs and Easterly, it might appear that “The answer, my friend, is blowin’ in the wind”.36 Boone (2006) has recently reiterated
that “the history of large aid flows is, to date, a major failure”, while Burnside and Dollar (2000) found that aid promotes growth, but only when policy is “good”.
Nevertheless, Sachs (2005) and the UN Millennium Project (2005) argue emphatically that aid has worked and should be “scaled up”. Sachs has played a key role as special adviser to the UN Secretary General on the Millennium Development Goals (MDGs), and he makes a concerted effort to reinstate many of the traditional argu-ments within development economics for believing that aid works in helping poor countries break out of poverty traps. He refers to in-vestments attuned to local needs and uses a vocabulary which is phrased along gap-filling lines of thinking. He also dismisses corrup-tion and domestic policy failure as the fundamental “cause” of Af-rica’s problems, and argues instead that the causal links originate in poverty and the lack of growth. Sachs furthermore provides (p. 259) “ten dramatic examples that prove the naysayers wrong”. These ex-amples, which are referred to as “clear aid triumphs”, range from aid’s contribution to the Green Revolution of Asia to the eradication of smallpox and polio and on to the mobile phone revolution in Bangla-desh. They demonstrate in Sachs’ words (p. 265) some common themes. “First and foremost, scaling up is possible when it is backed by appropriate and widely applicable technology, organizational lead-ership, and appropriate financing”; and he goes on to state that in “the case of the Millennium Development Goals, the promising tech-nologies exist, but have not been scaled up”.
Cornia (2005) pointedly notes that Sachs deserves a lot of credit for his “passionate advocacy”. Moreover, Sachs does manage to call attention to at least some of the ways in which aid has helped poor people in the past. His suggestion that much more can and should be
36 Bob Dylan song, where the full text is available at www.
done, in my assessment deserves attention together with his menu of initiatives.37 At the same time, as argued by Cornia, it is problematic
that so much of the present development debate is being cast in terms of increases in aid flows for the achievement of the MDGs. This is, to quote Cornia, “reductionist”. It ignores that the development process is much more sensitive to macroeconomic, financial and technological changes (or their lack thereof) than to the aggregate volume of aid. In addition, even if it is accepted that aid works, and works well, it is unlikely that the MDGs can be reached if aid is increased to 0.7 per cent of donor GNI, as argued by Sachs. The return will in even the best of circumstances not be big enough. I am afraid that mobilising such optimistic expectations may in a few years in the final analysis lead to frustration and an undesired backlash.
Over the years, Easterly has authored an impressive number of books and papers, a few of which are listed in the references. He is a sharp and articulated critic of foreign aid, and his contributions to the academic and the broader policy literature are influential. In two re-cent studies, Easterly (2005, 2006), he attacks the UN Millennium Project and the work of Sachs head on. Easterly refers to the white man’s burden and ponders “Why the West’s efforts to aid the rest have done so much ill and so little good”. Easterly deserves a great deal of credit for demonstrating in his many writings that much went wrong in aid in the past, and he is spot on when he argues that a great deal of individual initiative has been stifled under the burden of dog-matic and centralized planning practices and bureaucratic incompe-tence in many past decades. I believe that human initiative and appro-priate incentives are correctly identified by Easterly as two critically important elements in making development happen. Much can—and should—be gained from taking this to heart in thinking about devel-opment and the appropriate role of foreign aid in the future.
Sen (2006) has in a similar vein noted that there is much in East-erly’s latest book that offers “a line of analysis that could serve as the basis for a reasoned critique of the formulaic thinking and policy tri-umphalism of some of the literature on economic development”; and Cornia (2005) argues that Easterly is right on target in arguing that “poverty, mortality and so on are in fact much more sensitive to mac-roeconomic, financial and technological changes (or their lack
37 The UN Millennium Project (2005) goes on to recommend no less than 449