ABSTRACT
The Multiresolution visualization and interactive of three-dimensional mesh becomes a very active topic in recent years, which makes a state of art rich that it devoted this article. With the rapid development has seen computer graphics, three-dimensional objects become widely used in daily life. Given the large size of the mesh, it becomes very difficult to load them all into memory and transmit them on the internet. The segmentation techniques and multiresolution compression are used to reply these requirements. Indeed, in this paper, it proposed a new approach to multiresolution visualization based on a combination of segmentation and multiresolution mesh compression. For this, it proposed a new segmentation method that benefits the organization of faces of the mesh followed by a progressive local compression of regions of mesh to ensure the refinement local of the three-dimensional object.
Keywords
3D mesh, Interactive visualization, 3D segmentation, Multiresolution compression, Refinement local, Selective visualization.
1.
INTRODUCTION
The 3D objects are widely disseminated to the public and very useful in its daily lives through the great development that has seen the technology of acquisition, graphic design and internet development. These objects are often represented as triangular surface mesh.
Recent technological developments in various areas have given birth to different techniques that generate meshes with sizes very large and voluminous so that it becomes difficult to load in all their view, and for transmitting on the network. Therefore, for facilitating the visualization of this type of 3D object, it was necessary to use compression techniques ensuring progressive multiresolution representation of such an object, and segmentation methods that facilitate selective refinement of a part thereof.
In this context, its work has as objective to propose a method of selective visualization of multiresolution significant parts of the 3D object based on a combination of a progressive compression scheme and segmentation technique of triangular mesh surfacique, however, this approach has led to distortions (appearance of holes) for the boundaries between the different regions significant. The solution it proposed based on KNN classifier (K-the Nearest Neighbor), which moving the vertex of the subdivided area to the nearest vertex in the non-subdivided area.
In fact, this article consists of four parts. It started by present the techniques of multiresolution visualization of 3D object existing. Then it detailed segmentation techniques of 3D mesh. Towards the end of the paper, it devoted to describe its proposed method and the results obtained by the implementation of this method. Finally, it end with a conclusion.
2.
THE TECHNIQUES OF
MULTI-RESOLUTION VISUALIZATION OF 3D
OBJECT
Different techniques of multiresolution visualization (progressive), designed to accelerate the loading of the 3D object, appeared. The first progressive visualization techniques are based on the simplification of the mesh. Other techniques are oriented compression and which is based on a combination of a segmentation method and a progressive compression method.
2.1
Visualization techniques oriented
simplification of the mesh
Please use a 9-point Times Roman font, or other Roman font with serifs, as close as possible in appearance to Times Roman in which these guidelines have been set. The goal is to have a 9-point text, as you see here. Please use sans-serif or non-proportional fonts only for special purposes, such as distinguishing source code text. If Times Roman is not available, try the font named Computer Modern Roman. On a Macintosh, use the font named Times. Right margins should be justified, not ragged.
The simplification of the mesh was the first technique used for adaptive refinement of the 3D object. Indeed, this technique is based on subdivision surfaces so that areas with more details will be more refined than other areas. These visualization techniques focus on rendering speed and often induced a significant increase in the file size.
Among the existing work in this area, it include: Hoppe [1] that showed how to extend the progressive mesh with adaptive refinement which the generated meshes are more refined in the field of vision.
In fact, he introduced an algorithm for selective refinement. The refinement criteria were: corner of view, the surface orientation and the space between the screen and the geometry. The aim was to develop an algorithm refinement, in real time, of the mesh according to these criteria.
In 1998, Mueller [2] proposed the methods for adaptive subdivision of the principles of Doo-Sabin and Catmull-Clark. The adaptive process is controlled by vertices of the final
Interactive Multiresolution Visualization of 3D
mesh
Zeineb Abderrahim
1Hanen Jeder
1Mohamed Salim Bouhlel
11
mesh at each level of subdivision. A measure of the error indicates to the vertices of a mesh if the approximation is sufficient. The estimate of the error is measured as the distance between a vertex and its original image on the boundary surface.
In 1999, Kondo and Xu [3] proposed an adaptive subdivision based on the principle of Doo-Sabin whose the faces of initial mesh control the adaptive subdivision. The subdivision of one face is stopped when the angle dihedral (angle between the normal vectors of adjacent faces) is below a given threshold. Subsequently, in 2000, Müller and Havemann [4] proposed an adaptive subdivision for Loop principle based on the normal cone [5].
Similarly, in 2003, Amresh and Farin [6] is interested in the adaptive subdivision for the principle Loop. They propose a method based on the calculation of the dihedral angle and another where the user selects the parts of the mesh to be subdivided.
These techniques are also known as: techniques of non-uniform subdivision, depending on the area considered. This type of subdivision can be decomposed into two steps: first, how to choose the area of the mesh to be subdivided (according to some criteria) and then how to join parts subdivided mesh with the rest of preserving triangular faces.
2.2
Visualization techniques oriented
progressive compression
This approach is based on a combination of the segmentation of the mesh into a set of zones, named regions or cluster and the compression. Indeed, the author applies a segmentation algorithm of the mesh in the first place. Then, it applies a progressive compression method for each region separately.
The random access compression schemes are called "out-of-core" enable interactive visualization of large meshes, because only the information necessary and sufficient for parts requested at a given moment are loaded into memory. These approaches often start by dividing the mesh into clusters, compress independently and allow decompression independently.
Among these approaches, Lindstrom [7] has developed a method for meshes with connectivity. An octree is used to divide the triangles into clusters and to build a multi-resolution hierarchy. A measure of quadratic error is used to select the positions of representative points for each level of detail and the refinement is guided by the visibility and the measurement of error in screen space.
Subsequently, Yoon et al. [8] proposed a similar algorithm with a bounded memory footprint: a hierarchy of clusters is constructed, each containing a progressive sub-mesh to smooth the transition between levels of detail.
In this context, Cignoni et al 2003 [9] describes an efficient technique for out-of-core rendering and management of large textured terrain surfaces. The technique, called batch dynamic adaptive meshes (BDAM), is based on a tree structure associated (a quadtree). The objective is to propose a technique which is able to manage huge datasets of textured terrain without weigh down the CPU and fully exploit the power of current and future graphics cards.
In 2005, Gobbetti et Marton [10] have introduced fars voxels, capable of displaying both regular mesh that a soups of
triangles. The principle is to transform the volume sub-parts of the model in approximations of their appearance at a certain distance, following the angle of view.
In 2008, Clément Jamin et al [11] the method proposed out-of-core that combines good performance in compression and interactive visualization. They chose as a starting point the compression algorithm in-core without loss of Gandoin and Devillers [12]. The basic idea is to divide the original object in a tree mesh independent by introducing a hierarchical primary structure (nSP-tree). In fact, this method reduces the size of objects while allowing interactive navigation in real time.
In addition, Clement Courbet et Celine Hudelot [13], have proposed a new hierarchical representation of the mesh using an approach based on a recursive division of the mesh into two independent parts, under the constraint that one of the two parties which result must be reconstructible independently. Thus, their approach decompresses gradually the requested parts of a mesh without decoding the less interesting parts. More recently, Adrien Maglo et al [14], introduces a new compression scheme randomly accessible of triangular meshes. The scheme is aimed at interactive visualization of large meshes, supporting the encoding of vertex colors. They extended the approach of [15] using the encoder progressive [16] to compress the faces of clusters. These schemas have been modified to avoid duplication of information on the geometry of the boundary between the vertices of cluster.
3.
SEGMENTATION METHODS
Please use a 9-point Times Roman font, or other Roman font with serifs, as close as possible in appearance to Times Roman in which these guidelines have been set.
The 3D mesh segmentation is a relatively new research topic and appeared as an important issue due to the complexity of its implementation and various applications that are dependent. The segmentation can be mesh segmentation in surface patches or in significant parts.
In the first case, the mesh is divided into characteristic patchs that can respect the constraints of border curvature, flatness, convexity, etc. In the second case, the objective is to detect significant parts of the object in a more oriented semantics manner. [17] and [18] propose a state of the art segmentation methods while a comparison between these different techniques is given in [19].
Among the works appeared in recent years on the 3D mesh segmentation in surface patches: in first place, it found the best known approaches correspond to the growth regions. His general algorithm is initialized from an element germ and the growth is carried as a sub-mesh as a parameter of homogeneity. Among the methods of region growing [20] calculates the distortion of each face relative to its transformation 2D to decide whether it will be added to the region. [21] is based on the detection of boundaries from information Gaussian curvature and region growing. By cons, [22] uses contour extraction features to capture all the components of the patch.
In second place, approaches based on the principle of the watershed line (EPL) which is placed in a context where the graph partition is considered such as a relief and vertices are positioned at a certain height [24].
The contribution of Mangan and whitker [25] on the 3D mesh segmentation by the watershed line has served as the basis for several subsequent works.
For the evolution of EPL on the edges of the mesh, [26] have implemented an algorithm using a function of LPE in height with respect to the edges of the mesh and in function of the dihedral angle of the edge (the angle between the two adjacent faces). In [27], the authors proposed an algorithm for hierarchical segmentation resulting from the watershed unbiased Beucher.
Thirdly, there are approaches corresponding to the hierarchical partitioning among the existing work in this area [28], [29] and [30]. Finally, in the iterative partitioning, the research of optimal segmentation can be approximated by the iterative search for the best partition from a fixed number of clusters like as [31] and [32].
The other side, the segmentation in significant parts for applications where the semantics of objects is significant. The segmentation tries generally to follow the cutting that could be achieved by human vision. State of the art of different segmentation methods in significant parts have been recently proposed in [33]. A comparative study of some of these methods has been proposed in [19].
4.
Proposed method
Its work is a combination of a new method of segmentation and progressive compression method which aims to selective visualization. The compression method is chosen Wavemesh proposed by Valette and Prost in 2004 [34]. This method allows you to handle all types of input mesh from any type of modeling or scanning. Thus it retains the original mesh connectivity which has a major advantage of the meshes of which are applied textures when rendering, since avoids resampling of textures.
4.1
Description of the Segmentation
algorithm
For pages other than the first page, start at the top of the page, and continue in double-column format. The two columns on the last page should be as close to equal length as possible. Its proposed method fits into the family of segmentation surface patch designed to have significant parts. In this segmentation method, the number of region of the mesh is fixed at four (4), since in general, any object can be divided semantically in four regions.
Indeed the algorithm begins with a round of the topology of the mesh. The total number of faces of the mesh will be divided by four. For each iteration, the algorithm will recover all faces with an identifier id as (i-1) * n < id < i * n with i represents the number of the region and n represents the number of faces by region n = nbface / 4 (such as nbface is the number of faces of the mesh in question). Then, the algorithm will recover all the vertices of these faces with their connectivity and saves them in a file that represents the corresponding region i. Its topological partitioning of 3D mesh can be summarized by the following algorithm: Segmentation Algorithm:
1: nbface = number of faces of the mesh 2: n = nbface / 4
3 : Fori=1 TO 4 INCREMENT 1 do 4 : a = (i-1)*n
5 : b = i*n
6 : For j=a TO b INCREMENT 1 do 7 : Recover the Id of the face 8 : Recover the vertices of the face 9 : Recover connectivity
10 : End for
[image:3.595.115.436.62.236.2]11 : Create a file for region i 12 : End for
After creating a new mesh from each region, it refines the region based on neighborhood relations between the faces and taking into account the concave and convex discontinuities along the edges to avoid the problem of over-segmentation.
Then, the files representing these regions will be used later in the process of visualization.
4.2
Description of visualization algorithm
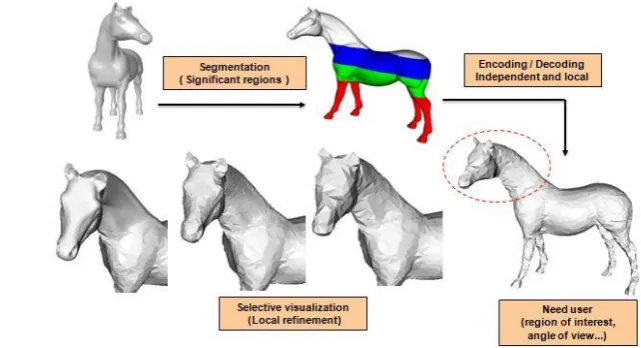
At each user interaction, a simple left click, the corresponding region will be refined so that it move from one level of detail to another higher. In fact, the process of selective visualization of the mesh (see Figure 1) can be explained as follows:
When interaction of user, it detect the region which tip the mouse.
It calls the compression process Wavemesh for it applies on the mesh representing the corresponding region in the final mesh.
It then uses the inverse process of the progressive compression which is decompression. In fact, this process is used to generate the set of levels of detail for this region.
At each interaction, it detects the level of detail of the region in the current mesh.
It appealed to the next level, it remove the current region and replaced by the new region which is more detailed.
It should be noted that it must always test the current level of accuracy compared to the maximum level of detail of the region, to avoid the crash of the algorithm.
4.3
Problem of holes
Since it is possible to have two regions that do not have the same level of resolution, visual artifacts (holes) may occur. The following figure illustrates this phenomenon:
Figure A represents all of the holes between two regions; the top (of the image) is more detailed than the bottom. To solve this problem, it uses the KNN classifier (K-Nearest Neighbor).
The idea was to use the KNN algorithm for moving the vertex of the subdivided area toward the nearest vertex in the non-subdivided area. This correction allowed us to have a better performing visualization of the 3D object.
In fact, after the replacement of a region by a more detailed level, it uses a function of filling holes. The algorithm is as follows: Recovering the vertices of borders in the region in question and its neighbors. For each point of the boundary of the region more detailed, find the nearest point which lies on the border of its neighbor, using the KNN algorithm. Subsequently, it changes the coordinates of the vertex in question by the coordinates of its nearest neighbor. Points a, b, c, d and e will be moved respectively to the points x1, x2, x3, x4 and x5 in Figure B.
5.
Tests and comparison
After detailing its segmentation method and selective visualization of 3D mesh, it represents in this section the experimental results it has made to valorize the performance of its method.
5.1
Segmentation
The evaluation of the segmentation of a mesh is not obvious and is difficult to measure as outlined Attene et al. [19] in their comparative study of mesh segmentation.
To measure the performance of its method, it uses the evaluations criteria listed in [35] which are: the creation of regions and borders correct and of complexity. In addition to better demonstrate the performance of its method it compare it with other methods such as the method of 3D mesh hierarchical segmentation from dynamic contour [36] and the method of Wang Jun [23].
5.1.1
The creation of correct regions and
bounda-ries
[image:4.595.113.468.81.186.2]Figure 3 shows that its method respects well the criterion of border regions creation a more adequate than Delest and same for Wang for this object.
[image:4.595.48.282.664.757.2]Indeed, it seems as in figure 3 (b) and (c) there are regions whose boundaries are overlapped. By against, its method defines the boundaries more precisely.
Thus, figure 4 shows the effectiveness of its method compared to other approaches [30] [37], in terms of segmentation quality, its goal of segmentation is to identify the different significant parts of the 3D object for use in a visualization application adaptive.
5.1.2
The complexity of the method
Since its method will be used for visualization and multi-resolution interactive 3D objects it is required to reduce the complexity of the algorithm. It uses the computation time of
the algorithm to valorize its complexity. Table 1 below lists the computation time of its algorithm compared with the method of Delest [36] and Wang [23], in seconds:
Observation of the results provided in this table shows that its method has a running time of very small compared to that of Delest and Wang. The gain is presented in the order of 45% for the object Fandisk.
In addition, for the object of car (car), the execution time of its segmentation algorithm is inconsiderable compared to the method of Wang.
5.2
Multiresolution Visualization selective
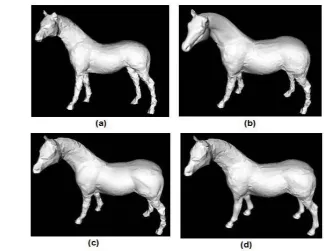
Because its method was able to give acceptable segmentation of the mesh in regions more or less significant, it will present the following the extracts visual demonstrating its utility in the visualization process multiresolution of 3D mesh. The following figure 5 explains the process of local refinement
model horse that it has completed the combination of segmentation and compression.
The refinement only affects the region selected by the user. Figure 5 (a) shows the initial mesh (coarse) that will be refined.
Figure 5 (b) shows the refinement has been the head by three levels of successive refinements. The refinement in Figure 5 (c) affects only the back region; other regions keep their coarse levels. Figure 5 (d) shows the result of refinement of feet region by two successive levels of details. The user can select a region to refine, so it can continue the refinement of the same region or choose another region.
6.
Conclusion
It propose in this paper a new method of selective, multiresolution visualization that allows to locally refining the mesh in regions significant, which allows to easily visualizing the details as different parts of the object. So it solved the problem of holes between regions using the KNN algorithm. Its approach is based on a new segmentation method which refers to neighborly relations and connectivity between the faces.
The experimental results on many 3D models have demonstrated the effectiveness and robustness of the proposed segmentation method. Thus, its approach provides a good characterization of borders with a speed of calculated.
In conclusion, it is necessary to mention that this work could be further improved by synchronizing the mesh refinement with moving the camera. In addition, it can improve the segmentation method using markers to facilitate the grouping of regions by the user. Thus, this work can be improved by the development of a new compression scheme by minimizing the time compression /decompression.
7.
ACKNOWLEDGMENTS
Its thanks to reviewers for their valuable comments which helped improving the quality of the paper.
Table 1. Comparison of execution times of the different algorithms
Models Vertices Delest Wang Our method
Fandisk 6475 3,5** 14,5 1,925
Car 342693 - 109,660** 64,30
[image:5.595.96.486.88.226.2]Horse 48485 - - 18,5
8.
REFERENCES
[1] Hugues Hoppe: "View-Dependent Refinement of Progressive Meshes", Proceedings of ACM SIGGRAPH 97, p. 189-198, 1997.
[2] Mueller, H. and R. Jaeschke: "Adaptive Subdivision Curves and Surfaces.", Proceedings of Computer Graphics International 98, p. 48-58, 1998.
[3] Xu, Z. and K. Kondo: "Adaptive renements in subdivision surfaces." Eurographics '99, Short papers and demos, p. 239-242, 1999.
[4] Müller, K. and S. Havemann: "Subdivision Surface Tesselation on the Fly using a Versatile Mesh data Structure." Eurographics'2000 19(3), p. 151-159, 2000. [5] S. Lanquetin : "Etude des surfaces de subdivision:
intersection, précision et profondeur de subdivision ", Thèse de doctorat, Université de Bourgogne, 2004. [6] Ashish Mresh , Gerald Farin , Anshuman Razdan:
"Adaptive subdivision schemes for triangular meshes. Hierarchical and Geometric Methods in Scientific Visualization". H. H. G. Farin, and B. Hamann, editors, p. 319-327, 2003.
[7] Lindstrom P.: “Out-of-core construction and visualization of multiresolution surfaces”. In Sym. on Interactive 3D Graphics (2003), ACM Press, pp. 93–102. [8] Yoon s.-e., Salomon b., Gayle r., Manocha D.: “Quick-vdr : Interactive view-dependent rendering of massive models. In Proc. of Visualization (2004), IEEE Computer Society, pp. 131–138.
[9] P. Cignoni , F. Ganovelli, E. Gobbetti, F. Marton, F. Ponchio and R. Scopigno, “BDAM – Batched Dynamic Adaptive Meshes for High Performance Terrain
Visualization”, EUROGRAPHICS 2003, Volume 22 (2003), Number 3.
[10] Gobbetti e., Marton f.: Far voxels : “a multiresolution framework for interactive rendering of huge complex 3d models on commodity graphics platforms”. In ACM SIGGRAPH (2005), ACM Press, pp. 878–885.
[11] Clément Jamin, Pierre-Marie Gandoin et Samir Akkouche : “Compression out-of-core pour la visualisation interactive de maillages”, AFIG 2008 (Association Française d’Informatique Graphique 2008), Toulouse, IRIT Presse.
[12] Gandoin p.-m., Devillers o.: “Progressive lossless compression of arbitrary simplicial complexes”. In ACM SIGGRAPH Conference Proc, 2002.
[13] Clement Courbet, Celine Hudelot: “Random Accessible Hierarchical Mesh Compression for Interactive Visualization”, Eurographics Symposium on Geometry Processing 2009, Volume 28 (2009), Number 5.
[14] Adrien Maglo, Ian Grimstead and Céline Hudelot: “Cluster-based Random Accessible and Progressive Lossless Compression of Colored Triangular Meshes for Interactive Visualization”, Computer Graphics International 2011 (CGI 2011).
[15] Choe, S., Kim, J., Lee, H., Lee, S.: “Random accessible mesh compression using mesh chartification”. IEEE Transactions on Visualization and Computer Graphics 15, 2009.
[image:6.595.128.453.76.327.2]for 3D mesh segmentation”, ACM Transactions on Graphics (Proc. SIGGRAPH) 28, 3 (Aug.2009).
[18] A. Shamir, “A survey on mesh segmentation techniques”, Computer Graphics Forum (2008). [19] M. Attene, S. Katz, M. Mortara, G. Patane, M.
Spagnuolo, A. Tal, “Mesh segmentation a comparative study”, In SMI ’06 : Proceedings of the IEEE International Conference on Shape Modeling and Applications 2006, (Washington, DC, USA), IEEE Computer Society, p. 7, 2006.
[20] O. Sorkine, D. Cohen-Or, R. Goldenthal and D. Lischinski, “Bounded-distortion piecewise mesh parameterization”, VIS ’02: Proceedings of the conference on Visualization, pages 355-362, Washington, DC, USA. IEEE Computer Society, 2002. [21] Y.Zhang, J. K. Paik, A. Koschan, M. A. Abidi and D.
Gorsich, “A simple and efficient algorithm for part decomposition of 3D triangulated models based on curvature analysis”, ICIP ’02 : Proceedings of the International Conference on Image Processing, volume 3, pages 273-276, Rochester, 2002.
[22] B. Lévy, S. Petitjean, N. Ray and J. Maillot, “Least squares conformal maps for automatic texture atlas generation”, SIGGRAPH ’02: Proceedings of the 29th annual conference on Computer graphics and interactive techniques, pages 362-371, New York, NY, USA. ACM Press, 2002.
[23] J. WANG and Y. Zeyun: “Surface feature based mesh segmentation”, SMI2011, pages 27, 31 and 35, 2011. [24] P. P. Acharjya and D. Ghoshal, “Watershed
Segmentation based on Distance Transform and Edge Detection Techniques”, International Journal of Computer Applications, Volume 52– No.13, August 2012.
[25] A. P. Mangan, R. T. Whitaker: “Partitioning 3D surface meshes using watershed segmentation”. IEEE Transactions on Visualization and Computer Graphics, 5(4):308-321, 1999.
[26] E. Zuckerberger, A. Tal and S. Shlafman: “Polyhedral surface decomposition with applications”, Computers and Graphics, 26(5):733-743, 2002.
[27] S. Delest, B. Romuald and H. Cardot: “Fast segmentation of triangular meshes using waterfall”, In VIIP ’06: International Conference on Visualisalization, Imaging
Mallorca, Spain, August 2006.
[28] Garland, M., Willmott, A. et Heckbert, P. S. (2001): “Hierarchical face clustering on polygonal surfaces”. Dans SI3D ’01: Proceedings of the 2001 Symposium on Interactive 3D graphics, pages 49-58, New York, NY, USA. ACM Press.
[29] Inoue, K., Itoh, T., Yamada, A., Furuhata, T. et Shimada, K.: “Face clustering of a large-scale cad model for surface mesh generation”. Computer-Aided Design, 33(3):251-261, 2001.
[30] Sander, P. V., Snyder, J., Gortler, S. J. et Hoppe, H.: “Texture mapping progressive meshes”. Dans SIGGRAPH ’01: Proceedings of the 28th annual conference on Computer graphics and interactive techniques, pages 409-416, New York, NY, USA. ACM Press, 2001.
[31] Shlafman, S., Tal, A. et Katz, S. : “Metamorphosis of polyhedral surfaces using decomposition”. Computer Graphics Forum, 21(3):219-228, 2002.
[32] Lloyd, S. P.: “Least squares quantization in pcm. IEEE Transactions on Information Theory, 28(2):129-137, 1982.
[33] A. Shamir: “Segmentation and shape extraction of 3D boundary meshes”, State-of-the-Art Report, Proceedings Eurographics 2006, pages 137-149, Vienna, Austria, 2006.
[34] S. Valette, R. Prost, "A Wavelet-Based Progressive Compression Scheme For Triangle Meshes: Wavemesh", IEEE Transactions on Visualization and Computer Graphics, vol. 10, no. 2, pp. 123-129, March-April 2004, doi:10.1109/TVCG.2004.
[35] S. Delest, B. Romuald, et C. Hubert : “Etat de l’art de la segmentation de maillage 3D par patchs surfaciques”, GTMG’2007, Groupe de Travail en Modélisation Géométrique, Valenciennes. p. 171-18, mars 2007. [36] S. Delest, R. Boné and H. Cardot: “Hierarchical mesh
segmentation using waterfall and dynamics”, ISPA ’07: Proceedings of the 5th International Symposium on Image and Signal Processing and Analysis, Istanbul, Turkey, 2007.
![Fig 3: Comparison of creating borders: a) our method, b) the method of Deleste (Image extracted from [36]), c) the method of Wang (Image extracted from [23])](https://thumb-us.123doks.com/thumbv2/123dok_us/8081284.782387/4.595.113.468.81.186/comparison-creating-borders-method-method-deleste-extracted-extracted.webp)
![Fig 4: The result of segmentation of horse model: method of Sander et al, 01 [30], method of Lee et al, 04 [37], our method with 4 regions](https://thumb-us.123doks.com/thumbv2/123dok_us/8081284.782387/5.595.96.486.88.226/result-segmentation-horse-method-sander-method-method-regions.webp)