http://dx.doi.org/10.4236/am.2014.51009
A Method to Predict Amino Acids at Proximity of
Beta-Sheet Axes from Protein Sequences
Antonin Guilloux1, Bernard Caudron2, Jean-Luc Jestin3 1
Analyse Algébrique, Institut de Mathématique de Jussieu, Université Pierre et Marie Curie, Paris, France 2
Centre d’Informatique Pour la Biologie, Institut Pasteur, Paris, France 3
Département de Virologie, Institut Pasteur, Paris, France
Email: [email protected], [email protected], [email protected]
Received June 21, 2013; revised July 21, 2013; accepted July 28, 2013
Copyright © 2014 Antonin Guilloux etal. This is an open access article distributed under the Creative Commons Attribution License, which permits unrestricted use, distribution, and reproduction in any medium, provided the original work is properly cited. In accor- dance of the Creative Commons Attribution License all Copyrights © 2014 are reserved for SCIRP and the owner of the intellectual property Antonin Guilloux etal. All Copyright © 2014 are guarded by law and by SCIRP as a guardian.
ABSTRACT
A general and elementary protein folding step was described in a previous article. Energy conservation during this folding step yielded an equation with remarkable solutions over the field of rational numbers. Sets of se- quences optimized for folding were derived. In this work, a geometrical analysis of protein beta-sheet backbone structures allows the definition of positions of topological interest. They correspond to amino acids’ alpha car- bons located on a unique axis crossing all beta-sheet’s strands or at proximity of this axis defined here. These posi- tions of topological interest are shown to be highly correlated with the absence of sequences optimized for folding. Applications in protein structure prediction for the quality assessment of structural models are envisioned.
KEYWORDS
Polypeptide Chain; Protein Structure; Topology; Beta-Strand; Folding; Amino Acid; Structure Prediction
1. Introduction
Protein structure prediction from sequences remains a major challenge even though the problem is several dec- ades old [1,2]. Protein structure prediction was recently achieved using abinitio methods for small proteins, us- ing templates with sequence or fold similarity or using sets of correlated mutations [3-9]. One-dimensional pro- tein sequences can generally be predicted from gene sequences on genomic scales [10,11]. Secondary structures can also be efficiently predicted computationally from protein sequences [12-17]. However, three-dimensional protein structures have generally been solved experimentally and computationally by time-consuming and costly approaches such as X-ray diffraction on protein crystals or nuclear magnetic resonance on concentrated protein solutions. Independently, studies on protein folding allowed major conceptual advances on the understanding of general protein properties linked to their conversion of one dimensional sequences into three-dimensional struc- tures [18-21]. Molten globules and pre-molten globules have been characterized [22,23]. A rugged funnel-like energy landscape was described for protein folding [24]. Small model systems allowed protein folding simula- tions to be carried out [25,26]. Protein engineering and folding kinetics were combined to define folding path- ways at the level of single amino acid residues [27]. Consideration of an elementary folding step allowed edge strands in beta-sheets to be predicted from protein sequences [28]. A link was also established here between protein sequences and three-dimensional structure information: the focus is in this work on amino acids at proximity of the axis crossing the beta-sheet’s strands.
Methods
and makes use of files from the Protein Data Bank (PDB) [30]. Protein lengths were in the range of 50 to 250 amino acids. Sequences optimized for folding (SOF) as shown in Figure 1 were computed as described earlier [28]. Small proteins and designed proteins were not included in this study. Proteins were chosen because of their distinct folds as described in the structural classification of proteins (SCOP) [32].
The gap is characterized by an integer value, which is the integer part of the middle of the gap’s ends corres- ponding to the set of amino acid positions for which no SOF were found (Figures 1 and 2). Independently, posi- tions of topological interest (TIPs) were determined from the protein domain structures’ backbone either by vis- ual analysis of the structure using the Pymol software or by automatic annotation using pdb22 (see below). For each protein consisting of L amino acids, the number of TIPs T and the number of gaps G were noted in the
Annex Table A1. A coincidence was defined as an amino acid position where a TIP coincides with a gap within a small error range e depending on the protein length L. For proteins of length L between 51 and 100, the gap position was defined plus or minus two amino acids (e = 2), thereby corresponding to 5 amino acid positions. Similarly, for proteins of length 101 - 150, 151 - 200 and 201 - 250, the error e was defined as 3, 4 and 5 respec-tively (Figure 2). For example, the structure with PDB reference (1c3g) with 170 amino acids numbered from 180/1 to 349/170 in the structure and sequence files respectively allows the definition of 10 TIPs corresponding to amino acid alpha carbons on the three following axes at positions numbered (266/87; 291/112; 316/137), (188/9; 228/49; 253/74), (206/27; 212/33; 247/68; 238/59). The model applied to the corresponding sequence allows the definition of two gaps between amino acids 28 and 31 (noted 29 and coinciding with TIP 27) and between amino acids 89 and 90 (noted 89 coinciding with TIP 87). Given that the differences between TIP and gap numbers is 2 in both cases and as an error of 4 is allowed for proteins of 170 amino acids, the number C of coincidences is two for the two gaps (Annex Table A1). The www interface for the identification of gaps is avail-
able for any protein sequence at the following ad
accepts PDB file names as entries (4 characters).
The program pdb22 is available at the address:
also a program written in perl and uses the same entry files as pdb2. The pdb22 output file (.xls) provides for each protein within the list its PDB name, the amino acid number and name in three-letter code, the start and the end of beta-strands indicated as amino acid numbers, the name of the sheet noted on the lines corresponding to amino acids found at the intersection of a beta-strand with the sheet axis and the distance D, which is calculated
0 20 40 60 80 100 120 140
1 4 7 10 13 16 19 22 25 28 31 34 37 40 43 46 49
Amino acid number
Nu
mb
e
r o
f
[image:2.595.96.532.433.689.2]SOF
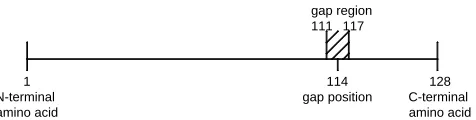
114 gap position
117 gap region 111
1 N-terminal amino acid
[image:3.595.196.434.83.143.2]128 C-terminal amino acid
Figure 2. Representation of a gap position and of a gap region in a protein sequence. For the protein domain of PDB reference 2fm4 which is 128 amino acids long [31], the small error e of plus or minus 3 amino acids around the gap position is applied to proteins of lengths 101 and 150 for the prediction of topologically interesting positions (TIPs).
in Angströms and averaged per beta-strand for each sheet consisting of n strands using the following equation:
12
mindist
2
n
i
i d
n
(1)
where mindist(i) is the minimal distance between an alpha carbon of strand i and the sheet axis. The distance d is estimated for each pair of amino acids defining an axis characterized by the atomic coordinates of one amino acid’s alpha carbon in the first strand and another one in the sequence’s last strand. The sheet axis is defined as the axis for which the distance d is minimal. For a sheet, the minimum of all distances d is noted D.
The probability q for having C coincidences occurring at random, that is the probability for G gaps to coincide with T TIPs within the error range e was calculated according to Equation (2) deriving from the exclusion-in- clusion principle (cf. Annex for the equation’s proof).
1
1
1 2 1
1 1
G
j G C
j G C
j G L e j L
q
G C j T T
(2)with
!
! !
a a
b b a b
The corresponding probabilities q are reported for each protein structure defined by its PDB reference in the
Annex Table A1. It appears that for 14 of the proteins, the probability q is higher than 0.5.
In order to compute the p-value of the test, the probability of failing at most 14 times within 46 experiments (one experiment for each protein structure associated to a PDB reference) when the probability of failure is tak- en as 0.5 was computed using the binomial law as in Equation (3):
14
0 46
46
2
j j
p
(3)The severity of this statistical test is highlighted for example by the data obtained for the protein of 193 amino acids referenced 3pn3 in the PDB, for which the correct identification of one coincidence for the gap was not considered as successful because of the large number of TIPs defined which is associated to a probability (q > 0.5; Annex Table A1). The numerical value of p 0.0057 indicates the statistical significance, which is far be- low the commonly accepted standard threshold of 0.05.
Independently, a program (pdb7) was written to make use of lists of PDB files as entries and to provide within the output sequence file the gaps and TIPs calculated using pdb2 and pdb22 respectively. For each beta-sheet, the axis was defined as the line minimizing the distance for all strands from one alpha carbon per beta-strand to the line defined by two alpha carbons taken in the first and last strands in the protein sequence as described above. Analysis of the pdb7 output files yielded the results for the 248 correlations evaluated between gaps and TIPs (Table 1).
3. Results
folding properties were derived [28].
A gap was defined as one or several amino acid(s) position(s) for which no sequence with optimal folding properties (SOF) is found. A quarter of the proteins analyzed yielded graphs of SOF which did not contain any gap. As an example, a single gap was noted between amino acids 114 and 115 for the central domain of C.
sym-biosum pyruvate phosphate dikinase (Figure 1). The gap’s position was defined as the integer part of the middle of the gap (Figures 1 and 2).
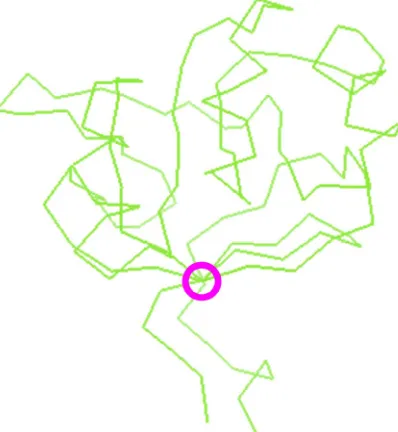
Topologically interesting positions (TIPs) can be determined from protein domain structures’ atomic coordi- nates. Beta-sheets are typically curved planes in three dimensions because of the twist found within beta-strands [33]. Still, there generally exists at least one axis crossing most, if not all, beta-strands of the sheet (Figure 3): we define here a sheet axis as a straight line crossing the sheet’s beta-strands, and which is generally perpendi- cular to the beta-strands (cf. Methods). The axis was chosen to cross the first and last strands at amino acids’ al- pha carbons. For the other strands, one amino acid per strand is further chosen for its proximity to the axis. The axis minimizing the distance to their alpha carbon is represented as a circle including the set of amino acids which are on the axis or closest to the axis in the pyruvate phosphate dikinase domain sheet structure (Figure 3). The intersection of this axis with each beta-strand yields one alpha carbon at an amino acid position defined as a topologically interesting position or TIP.
[image:4.595.88.535.315.417.2]An error e for the gaps’ positions prediction was allowed and chosen to increase slightly as a function of in-
Table 1. Distribution of distances between gaps and TIPs within seven amino acids long beta-strands.
Distancea Calculatedb Observedc
0 7 33
1 12 76
2 10 49
3 8 52
4 6 22
5 & 6 6 16
a
Distance is the difference between a gap position and a topologically interesting position (TIP) within a beta-strand sequence; brelative occurrence assuming a random assignment of gaps and TIPs within seven amino acids long beta-strands; coccurrences in a non-redundant set of proteins with at least one seven amino acids long beta-strand deriving from the PDB.
[image:4.595.222.421.457.673.2]creasing proteins’ length as described in the methods section (Figure 2). The statistical evidence that TIPs and gaps are strongly correlated derives from a binomial test on the analysis of domain structures (Annex Table A1). The p-value (<0.0057) calculated (cf. Methods) shows the correlation. Given that gaps can be straightforwardly calculated for any protein sequence, the correlation between gaps and topologically interesting amino acid posi- tions (TIPs) provides information on the three-dimensional protein structure.
To obtain an independent proof of this conclusion, another program (pdb7) was then written for automatic annotation of gaps and TIPs on protein sequences: the hypothesis that the observed distribution of distances be- tween gaps and TIPs (Table 1) follows the calculated distribution assuming a random assignment is excluded given the statistical p-value (0.0032).
4. Discussion
An elementary protein folding step was described [28]. Application of classical mechanics and of the total en-ergy conservation law to an elementary folding step yielded a quadratic equation with remarkable solutions over the field of rational numbers [28].
While numerical applications of equations from classical mechanics are commonly done over the field of real numbers, the following pieces of evidence indicate that discreteness provides a useful basis which is adapted in particular for the understanding of why the genetic code is the way it is. The genetic code is remarkable because of its quasi-universality within living organisms on earth and because it is about four billion years old [34]. The role of selection pressures in the definition of amino acid assignments to codons was largely discussed in the context of the coevolution of the genetic code with essential proteins [35,36]. A side-chain volume conservation was further found to be statistically significant for amino acids involved in precursor-product relationships within biosynthetic pathways and put in the context of side-chains’ packing in protein beta-sheets [37]. From the experimental side, the genetic code was engineered in multiple studies for applications in protein engineering [38-40]. From the theoretical side, discrete symmetries associated to degeneracy in the genetic code were identi- fied by Rumer [41,42]. The discrete nature of the most frequent mutations provided a rationale accounting for those symmetries [43]. Independently, kinetic energy conservation in polypeptide chains during molecular evo- lution was found to be consistent with the grouping of codons in the genetic code; the formalism consisting of energy conservation laws with solutions over the field of rational numbers was thereby validated for amino acids by the genetic code’s codon arrangement [44]. The field of rational numbers was also taken into consideration for another extension of classical mechanics [45].
This mathematical and physical formalism provides information on beta-sheet structures from protein se- quences as shown recently for the prediction of edge strands [28] and above for the prediction of amino acids at proximity of beta-sheet axes (Figure 3). Protein beta-strands and their arrangement in beta-sheets were exten- sively described [46-49]. Numerous studies have been undertaken to identify rules linking the beta-strands’ se- quences and three-dimensional structural properties of the corresponding beta-sheets [33,50-61]. The notion of random quasi-spherical proteins was recently introduced [62]. Several computational approaches allow the pre- diction of beta-sheet topology with accuracies around 80% for sheets of more than four beta-strands [63-67]. The parallel or anti-parallel character was also predicted by computational methods [68-70].
In this work, the absence of sequences optimized for folding was linked to topological information on protein beta-sheets. It should be of interest to extend this analysis to other secondary structure elements such as protein helices while considering the impact of protein families and classes [71,72].
5. Conclusion
achieved within the next challenge for the critical assessment of techniques for protein structure prediction such as CASP11 [77,78].
Acknowledgements
The authors thank B. Néron for interfacing pdb2 and pdb22, Y. Benoist and A. Kempf for discussions.
REFERENCES
[1] C. B. Anfinsen, “Some Observations on the Basic Principles of Design in Protein Molecules,” ComparativeBiochemistryand Physiology, Vol. 4, No. 2-4, 1962, pp. 229-240.
[2] C. Clementi, “Coarse-Grained Models of Protein Folding: Toy Models or Predictive Tools?” CurrentOpinioninStructural Biology, Vol. 18, No. 1, 2008, pp. 10-15.
[3] L. A. Kelley and M. J. E. Sternberg, “Protein Structure Prediction on the Web: A Case Study Using the Phyre Server,” Nature Protocols, Vol. 4, No. 3, 2009, pp. 363-371.
[4] S. Y. Lee and J. Skolnick, “Tasser-wt: A Protein Structure Prediction Algorithm with Accurate Predicted Contact Restraints for Difficult Protein Targets,” BiophysicalJournal, Vol. 99, No. 9, 2010, pp. 3066-3075.
[5] R. Norel, D. Petrey and B. Honig, “Pudge: A Flexible, Interactive Server for Protein Structure Prediction,” NucleicAcids
Re-search, Vol. 38, Suppl. 2, 2010,
[6] A. Leaver-Fay, M. Tyka, S. M. Lewis, etal., “ROSETTA3: An Object-Oriented Software Suite for the Simulation and Design of Macromolecules,” MethodsinEnzymology, Vol. 487, 2011, pp. 545-574.
[7] J. Thompson and D. Baker, “Incorporation of Evolutionary Information into Rosetta Comparative Modeling,” Proteins, Vol. 79,
No. 8, 2011, pp. 2380-2388.
[8] J. I. Sulkowska, F. Morcos, M. Weigt, etal., “Genomics-Aided Structure Prediction,” ProceedingsoftheNationalAcademyof SciencesoftheUnitedStatesofAmerica, Vol. 109, No. 26, 2012, pp. 10340-103 [9] D. S. Marks, T. A. Hopf and C. Sander, “Protein Structure Prediction from Sequence Variation,” NatureBiotechnology, Vol.
30, No. 11, 2012, pp. 1072-1080
[10] I. Iliopoulos, S. Tsoka, M. A. Andrade, etal., “Evaluation of Annotation Strategies Using an Entire Genome Sequence,”
Bio-informatics, Vol. 19, No. 6, 2003
[11] A. S. Juncker, L. J. Jensen, A. Pierleoni, etal., “Sequence-Based Feature Prediction and Annotation of Proteins,” Genome Bi-ology, Vol. 10, 2009, p. 206.
[12] B. Rost and C. Sander, “Prediction of Protein Secondary Structure at Better than 70% Accuracy,” JournalofMolecularBiology,
Vol. 232, No. 2, 1993, pp. 584-5
[13] D. Bordo and P. Argos, “The Role of Side-Chain Hydrogen Bonds in the Formation and Stabilization of Secondary Structure in Soluble Proteins,” JournalofMolecularBiology, Vol. 243, No. 3, 1994, pp. 504-5 [14] J. Selbig, T. Mevissen and T. Lengauer, “Decision Free-Based Formation of Consensus Protein Secondary Structure
Predic-tion,” Bioinformatics, Vol. 15, No. 12, 1999, pp.
[15] D. T. Jones, “Protein Secondary Structure Prediction Based on Position-Specific Scoring Matrices,” JournalofMolecular Bi-ology, Vol. 292, No. 2, 1999, pp. 195-202.
[16] J. Martin, J. F. Gibrat and F. Rodolphe, “Analysis of an Optimal Hidden Markov Model for Secondary Structure Prediction,” BMCStructuralBiology, Vol. 6, 2006, p. 25
[17] C. A. Floudas, “Computational Methods in Protein Structure Prediction,” BiotechnologyandBioengineering, Vol. 97, No. 2,
2007, pp. 207-2
[18] L. Mirny and E. Shakhnovich, “Protein Folding Theory: From Lattice to All-Atom Models,” AnnualReviewofBiophysicsand BiomolecularStructure, Vol. 30, 2001, pp. 361-3
[19] G. D. Rose, P. J. Fleming, J. R. Banavar and A. Maritan, “A Backbone-Based Theory of Protein Folding,” Proceedingsofthe NationalAcademyofSciencesoftheUnitedStatesofAmerica, Vol. 103, No. 45, 2006, pp. 16623-16633.
[20] K. A. Dill, S. B. Ozkan, M. S. Shell and T. R. Weikl, “The Protein Folding Problem,” AnnualReviewofBiophysics, Vol. 37,
No. 1, 2008, pp.
[21] D. Thirumalai, E. P. O’Brien, G. Morrison and C. Hyeon, “Theoretical Perspectives on Protein Folding,” AnnualReviewof
Biophysics, Vol. 39, No. 1, 2010
[23] A. F. Chaffotte, J. I. Guijarro, Y. Guillou, etal., “The ‘Pre-Molten Globule’, a New Intermediate in Protein Folding,” Journal ofProteinChemistry, Vol. 16, No. 5, 1997, pp. 4
[24] J. N. Onuchic, Z. Luthey-Schulten and P. G. Wolynes, “Theory of Protein Folding: The Energy Landscape Perspective,” An-nualReviewofPhysicalChemistry, Vol. 48, 1997
[25] R. D. Schaeffer, A. Fersht and V. Daggett, “Combining Experiment and Simulation in Protein Folding: Closing the Gap for Small Model Systems,” CurrentOpinioninStructuralBiology, Vol. 18, No. 1, 2008, pp. 4-9.
[26] J. A. Hegler, J. Latzer, A. Shehu, etal., “Restriction versus Guidance in Protein Structure Prediction,” Proceedingsofthe Na-tionalAcademyofSciencesoftheUnitedStatesofAmerica, Vol. 106, No. 36, 2009, pp. 15302-15307.
[27] A. Matouschek, J. T. Kellis Jr., L. Serrano and A. R. Fersht, “Mapping the Transition State and Pathway of Protein Folding by Protein Engineering,” Nature, Vol. 340, 1989, pp. 122-126.
[28] A. Guilloux, B. Caudron and J. L. Jestin, “A Method to Predict Edge Strands in Beta-Sheets from Protein Sequences,” Compu-tationalandStructuralBiotechnologyJournal, Vol. 7, 2013, Article ID: e201305001.
[29] H. Ménager, V. Gopalan, B. Néron, S. Larroudé, J. Maupetit, A. Saladin, P. Tufféry, Y. Huyen and B. Caudron, “Bioinformat- ics Applications Discovery and Composition with the Mobyle Suite and MobyleNet,”LectureNotesinComputerScience, Vol.
6799, 2012, pp. 11-22.
[30] F. C. Bernstein, T. F. Koetzle, G. J. Williams, etal., “The Protein Data Bank. A Computer-Based Archival File for Macromo- lecular Structures,” EuropeanJournalofBiochemistry, Vol. 80, No. 2, 1977, pp. 319-324.
[31] Y. Lin, J. D. Lusin, D. Ye, etal., “Examination of the Structure, Stability, and Catalytic Potential in the Engineered Phosphoryl Carrier Domain of Pyruvate Phosphate Dikinase,” Biochemistry, Vol. 45, No. 6, 2006, pp. 1702-1711.
[32] L. Lo Conte, B. Ailey, T. J. Hubbard, etal., “SCOP: A Structural Classification of Proteins Database,” NucleicAcidsResearch,
Vol. 28, No. 1, 2000, pp. 257-25
[33] B. K. Ho and P. M. Curmi, “Twist and Shear in Beta-Sheets and Beta-Ribbons,” JournalofMolecularBiology, Vol. 317, No. 2,
2002, pp. 291-3
[34] M. Eigen, B. F. Lindemann, M. Tietze, etal., “How Old Is the Genetic Code? Statistical Geometry of tRNA Provides an An-
swer,” Science, Vol. 244, No. 4905, 1989, pp. 67
[35] M. A. Jimenez-Montano, “Protein Evolution Drives the Evolution of the Genetic Code and Vice Versa,” Biosystems, Vol. 54,
No. 1, 1999, pp. 47-64.
[36] M. Di Giulio, “The Origin of the Genetic Code: Theories and Their Relationships, a Review,” Biosystems, Vol. 80, No. 2, 2005,
pp. 175-184.
[37] M. Di Giulio, “The β-Sheets of Proteins, the Biosynthetic Relationships between Amino Acids, and the Origin of the Genetic Code,” OriginsofLifeandEvolutionoftheBiosphere, Vol. 26, No. 6, 1996, pp. 589-609.
[38] L. Wang and P. G. Schultz, “Expanding the Genetic Code,” AngewandteChemieInternationalEdition, Vol. 44, No. 1, 2004,
pp. 34-66
[39] N. Budisa, “Engineering the Genetic Code,” Wiley-VCH, Weinheim, 2006.
[40] K. Wang, W. H. Schmied and J. W. Chin, “Reprogramming the Genetic Code: From Triplet to Quadruplet Codes,” Ange- wandteChemieInternationalEdition, Vol. 51, No. 10, 2012, pp. 2288-2297.
[41] Y. B. Rumer, “About the Codon’s Systematization in the Genetic Code,” TheProceedingsoftheUSSRAcademyofSciences, Vol. 167, 1966, pp. 1393-1394.
[42] V. I. Shcherbak, “Rumer’s Rule and Transformation in the Context of the Co-Operative Symmetry of the Genetic Code,” JournalofTheoreticalBiology, Vol. 139, No. 2, 1989, pp. 271-276.
[43] J. L. Jestin, “A Rationale for the Symmetries by Base Substitutions of Degeneracy in the Genetic Code,” Biosystems, Vol. 99,
No. 1, 2010, pp.
[44] A. Guilloux and J. L. Jestin, “The Genetic Code and Its Optimization for Kinetic Energy Conservation in Polypeptide Chains,” Biosystems, Vol. 109, No. 2, 2012, pp. 141-144
[45] J. X. Madarasz and G. Szekely, “Special Relativity over the Field of Rational Numbers,” InternationalJournalofTheoretical Physics, Vol. 52, No. 5, 2013, pp. 1706-1718.
[47] F. R. Salemme, “Structural Properties of Protein β-Sheets,” ProgressinBiophysicsandMolecularBiology, Vol. 42, 1983, pp.
95-133.
[48] C. Chothia, “Conformation of Twisted β-Pleated Sheets in Proteins,” JournalofMolecularBiology, Vol. 75, No. 2, 1973, pp.
[49] E. Koh, T. Kim and H. S. Cho, “Mean Curvature as a Major Determinant of β-Sheet Propensity,” Bioinformatics, Vol. 22, No.
3, 2006, pp. 297-302.
[50] M. J. Sternberg and J. M. Thornton, “On the Conformation of Proteins: An Analysis of β-Pleated Sheets,” JournalofMolecular Biology, Vol. 110, No. 2, 1977, pp. 285-296
[51] M. J. Sternberg and J. M. Thornton, “On the Conformation of Proteins: Towards the Prediction of Strand Arrangements in
β-Pleated Sheets,” JournalofMolecularBiology, Vol. 113, No. 2, 1977, pp. 401-418.
[52] M. J. Sternberg and J. M. Thornton, “On the Conformation of Proteins: Hydrophobic Ordering of Strands in β-Pleated Sheets,” JournalofMolecularBiology, Vol. 115, No. 1, 1977, pp. 1-17
[53] G. Von Heijne and C. Blomberg, “Some Global β-Sheet Characteristics,” Biopolymers, Vol. 17, No. 8, 1978, pp. 2033-2037.
[54] M. A. Wouters and P. M. Curmi, “An Analysis of Side Chain Interactions and Pair Correlations within Antiparallel β-Sheets: the Differences between Backbone Hydrogen-Bonded and Non-Hydrogen-Bonded Residue Pairs,” Proteins, Vol. 22, No. 2,
1995, pp. 119-1
[55] I. Ruczinski, C. Kooperberg, R. Bonneau and D. Baker, “Distributions of Beta Sheets in Proteins with Application to Structure Prediction,” Proteins: Structure, Function, andBioinformatics, Vol. 48, No. 1, 2002, pp. 85-97.
[56] J. S. Richardson and D. C. Richardson, “Natural β-Sheet Proteins Use Negative Design to Avoid Edge-to-Edge Aggregation,” ProceedingsoftheNationalAcademyofSciencesoftheUnitedStatesofAmerica, Vol. 99, No. 5, 2002, pp. 2754-2759.
[57] A. E. Kister, A. S. Fokas, T. S. Papatheodorou and I. M. Gelfand, “Strict Rules Determine Arrangements of Strands in Sand- wich Proteins,” ProceedingsoftheNationalAcademyofSciencesoftheUnitedStatesofAmerica, Vol. 103, No. 11, 2006, pp.
4107-4110.
[58] T. S. Papatheodorou and A. S. Fokas, “Systematic Construction and Prediction of the Arrangement of the Strands of Sandwich Proteins,” JournaloftheRoyalSocietyInterface, Vol. 6, No. 30, 2009, pp. 63-73. [59] N. Koga, R. Tatsumi-Koga, G. Liu, R. Xiao, T. B. Acton, G. T. Montelione and D. Baker, “Principles for Designing Ideal Pro-
tein Structures,” Nature, Vol. 491, No. 7423, 2012, pp. 222-227.
[60] C. M. Santiveri, J. Santoro, M. Rico and M. A. Jimenez, “Factors Involved in the Stability of Isolated Beta-Sheets: Turn Se- quence, β-Sheet Twisting, and Hydrophobic Surface Burial,” ProteinScience, Vol. 13, No. 4, 2004, pp. 1134-1147.
[61] B. Caudron and J. L. Jestin, “Sequence Criteria for the Anti-Parallel Character of Protein β-Strands,” JournalofTheoretical Biology, Vol. 315, 2012, pp. 146
[62] M. Brylinski, M. Gao and J. Skolnick, “Why not Consider a Spherical Protein? Implications of Backbone Hydrogen Bonding for Protein Structure and Function,” PhysicalChemistryChemicalPhysics, Vol. 13, No. 38, 2011, pp. 17044-17055.
[63] J. Cheng and P. Baldi, “Three-Stage Prediction of Protein β-Sheets by Neural Networks, Alignments and Graph Algorithms,” Bioinformatics, Vol. 21, Suppl. 1, 2005, pp. i75-
[64] R. Rajgaria, Y. Wei and C. A. Floudas, “Contact Prediction for β and alpha-β Proteins Using Integer Linear Optimization and Its Impact on the First Principles 3D Structure Prediction Method ASTRO-FOLD,” Proteins, Vol. 78, No. 8, 2010, pp. 1825-
[65] Z. Aydin, Y. Altunbasak and H. Erdogan, “Bayesian Models and Algorithms for Protein β-Sheet Prediction,” IEEE/ACMTran- sactionsonComputationalBiologyandBioinformatics, Vol. 8, No. 2, 2011, pp. 395-409.
[66] A. Subramani and C. A. Floudas, “β-Sheet Topology Prediction with High Precision and Recall for β and mixed α/β Proteins,”
PLoSONE, Vol. 7, No. 3, 2012, Article ID: e32461.
[67] N. S. Burkoff, C. Varnai and D. L. Wild, “Predicting Protein β-Sheet Contacts Using a Maximum Entropy-Based Correlated
Mutation Measure,” Bioinformatics, Vol. 29, No. 5, 2013, pp. 580
[68] R. E. Steward and J. M. Thornton, “Prediction of Strand Pairing in Antiparallel and Parallel β-Sheets Using Information The-ory,” Proteins, Vol. 48, No. 2, 2002, pp. 178-191.
Vol. 7, No. 4-5, 2007, pp. 535-542.
[70] N. Zhang, G. Duan, S. Gao, J. S. Ruan and T. Zhang, “Prediction of the Parallel/Antiparallel Orientation of β-Strands Using Amino Acid Pairing Preferences and Support Vector Machines,” JournalofTheoreticalBiology, Vol. 263, No. 3, 2010, pp.
[71] A. V. Efimov, “Standard Structures in Proteins,” ProgressinBiophysics andMolecular Biology, Vol. 60, No. 3, 1993, pp.
[72] C. A. Orengo and J. M. Thornton, “Protein Families and Their Evolution—A Structural Perspective,” AnnualReviewofBio-
chemistry, Vol. 74, 2005, pp. 867-900.
[73] W. Thiel, “Theoretical Chemistry—Quo Vadis?” AngewandteChemieInternationalEdition, Vol. 50, No. 40, 2011, pp. 9216-
[74] S. C. Lovell, I. W. Davis, W. B. Arendall III, P. I. W. de Bakker, J. M. Word, M. G. Prisant, J. S. Richardson and D. C. Rich- ardson, “Structure Validation by Cα Geometry: φ, ψ and Cβ Deviation,” Proteins, Vol. 50, No. 3, 2003, pp. 437-450.
[75] B. Wallner and A. Elofsson, “Identification of Correct Regions in Protein Models Using Structural, Alignment, and Consensus Information,” ProteinScience, Vol. 15, No. 4, 2006, pp. 900-913
[76] P. Benkert, M. Biasini and T. Schwede, “Toward the Estimation of the Absolute Quality of Individual Protein Structure Models,” Bioinformatics, Vol. 27, No. 3, 2011, pp. 343-35
[77] D. Fischer, L. Rychlewski, R. L. Dunbrack Jr., A. R. Ortiz and A. Elofsson, “CAFASP3: The Third Critical Assessment of Fully Automated Structure Prediction Methods,” Proteins, Vol. 53, No. S6, 2003, pp. 503-516.
[78] D. Cozzetto, A. Kryshtafovych, K. Fidelis, J. Moult, B. Rost and A. Tramontano, “Evaluation of Template-Based Models in CASP8 with Standard Measures,” Proteins, Vol. 77, No. S9, 2009, pp. 18-28
Abbreviations
PDB is the Protein Data Bank; SCOP is the structural classification of proteins; SOF is a sequence optimized for folding; a gap consists of one or several contiguous amino acids position(s) for which no SOF were found; G is the number of gaps; TIPs are Topologically Interesting Positions; T is the number of TIPs; e is the error tole- rated around a gap and is defined as plus or minus a number of amino acids; C is the number of coincidences between TIPs and gaps; L is the number of amino acids of a protein or its length; D is the sum for all strands of a beta-sheet of the distances from the sheet axis to the closest amino acid alpha carbon in each strand; q is a prob- ability as defined in Equation (2); p is the statistical p-value as defined in Equation (3).
Annex: Proof of the Inclusion-Exclusion Formula
We give here a proof of the formula for the probability of having at least C coincidences between the G gaps and
T TIPs in a protein of length L, up to an acceptable error of e:
1 1
2 1
1
1 1
G
j G C
j G C
L e j
j G T
L
G C j
T
The last fraction in the sum is the probability for the T TIPs to avoid j choosen gaps. With the additional
bi-nomial coefficient G
j
, we may moreover choose the j gaps we want to avoid.
distribu-tion of TIPs avoiding exactly k gaps gets counted k
j
times in the term:
2 1
L e j
G T L j T
for every G C 1 j k: those are the possibilities to choose j among the k gaps the distribution avoids. To get an exact formula for the probability of avoiding at least G – C + 1 gaps, there is a need to compensate this via an inclusion-exclusion method. To prove that in the sum above one counts exactly one time a configuration of TIPs avoiding exactly k gaps, it remains to prove the formula:
11
1
1 1
k
j G C
j G C
j k
G C j
For the sake of readability, let us note r G C . Then one may transform it:
1 1 ! ! !
! 1 ! ! ! ! ! !
! !
.
! ! ! !
j k j k j r k
G C j r j r j k j j j r r k j
k k r
k r
j r k j r
r j r
j r k r j r k j j
Hence the sum we are interested in is rewritten:
1
11 1
1
1 1 .
k k
j G C j r
j G C j r
j k k j r k r
G C j r j j r
And it remains to prove:
1
1 ! 1 1 . 1 2 k j r j r
k r k r
j r
k j r
j r r k
r
We may use an analytic proof. Define the polynomial in two variables:
1
10
, 1 1 .
k r k r l
r l r l
l
k r
F X Y Y XY X Y
l
Now let
1 11
1, 1 ,
k r l
l r l l
k r F
f Y Y l X Y
l X
and eventually:
1
1 0
d 1 .
k r l l
k r l
A f Y Y
l l r
Putting l j r, one sees that
11 1 . k j r j r k r j r A j r j
It thus remains a simple equality to check,namely
! . 1 2 k r Ar r k
Using the factorized form of F, we get
1
1 k r .
r
f Y k r Y Y
1 1 1 0 0 1 1 1 2 1 1 0 0 1 2 1 0 1 1 0d 1 d
1 1
1 1 d
1 1 1 1 d 1 ! ! d
1 2 1 1 2
k r r
k r k r
r r
k r r
k
A f Y Y k r Y Y Y
k r
k r Y Y k r Y Y Y
r r
k r k r
Y Y Y
r
k r k r
Y Y
r r k r r k
[image:11.595.58.538.254.713.2]
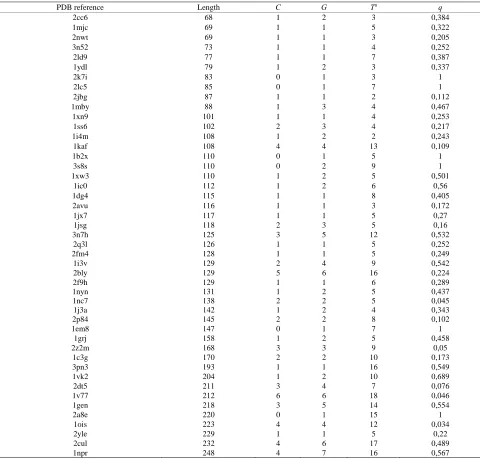
Annex Table
Table A1. List of protein domains and of the probabilities q calculated according to Equation (2).
PDB reference Length C G Ta q
2cc6 68 1 2 3 0,384
1mjc 69 1 1 5 0,322
2nwt 69 1 1 3 0,205
3n52 73 1 1 4 0,252
2ld9 77 1 1 7 0,387
1ydl 79 1 2 3 0,337
2k7i 83 0 1 3 1
2lc5 85 0 1 7 1
2jbg 87 1 1 2 0,112
1mby 88 1 3 4 0,467
1xn9 101 1 1 4 0,253
1ss6 102 2 3 4 0,217
1i4m 108 1 2 2 0,243
1kaf 108 4 4 13 0,109
1b2x 110 0 1 5 1
3s8s 110 0 2 9 1
1xw3 110 1 2 5 0,501
1ic0 112 1 2 6 0,56
1dg4 115 1 1 8 0,405
2avu 116 1 1 3 0,172
1jx7 117 1 1 5 0,27
1jsg 118 2 3 5 0,16
3n7h 125 3 5 12 0,532
2q3l 126 1 1 5 0,252
2fm4 128 1 1 5 0,249
1i3v 129 2 4 9 0,542
2bly 129 5 6 16 0,224
2f9h 129 1 1 6 0,289
1nyn 131 1 2 5 0,437
1nc7 138 2 2 5 0,045
1j3a 142 1 2 4 0,343
2p84 145 2 2 8 0,102
1em8 147 0 1 7 1
1grj 158 1 2 5 0,458
2z2m 168 3 3 9 0,05
1c3g 170 2 2 10 0,173
3pn3 193 1 1 16 0,549
1vk2 204 1 2 10 0,689
2dt5 211 3 4 7 0,076
1v77 212 6 6 18 0,046
1gen 218 3 5 14 0,554
2a8e 220 0 1 15 1
1ois 223 4 4 12 0,034
2yle 229 1 1 5 0,22
2cul 232 4 6 17 0,489
1npr 248 4 7 16 0,567
a
![Figure 1. Set of sequences with optimal folding properties. SOFs (red) were calculated as in [28] for the central pro- absence of SOF is found between amino acids 114 and 115 and is characterized by the integer part of the gap’s middle tein domain of Clost](https://thumb-us.123doks.com/thumbv2/123dok_us/7970481.754551/2.595.96.532.433.689/figure-sequences-properties-calculated-central-absence-characterized-integer.webp)