An Investigation of the Level of Emotional Intelligence level among educators in Salem City.
Dr.R.Tamilmaran,
M.Com., M.Phil., MBA., M.Phil., Ph.D., NET
Associate Professor, School of Management Studies,Tamil Nadu Open University,
ABSTRACT
Emotional Intelligence has been associated with positive outcome process in various professions. In the field of management, Emotional Intelligence has been a popular topic of debate
in recent years. Plethoras of literatures on the subject are available especially in the educational sector. Emotional intelligence (EI) is the capacity for understanding one’s own feelings and the
feelings of others, for motivating self, and for managing the emotions of self effectively to sustain relationships. Rather than being a single characteristic, emotional intelligence can be thought of as a wide set of competencies that are organized into a few major clusters. The most widely accepted view of emotional intelligence identifies 20 competencies, which are in turn organized into four clusters: Self-Awareness, Self-Management, Social Awareness and Social Skills. Hence a study was conducted to measure the Emotional Intelligence level among college educators in Salem district.
The study used the EI scale developed by Petrides and Furnham (2006) consisting of thirty questions and data was collected using questionnaire. The sample size for the study was 239 respondents representing Engineering, Arts and Science and Management disciplines. The collected data was analysed using appropriate statistical methods. The results of the study reveal that 2/3rd of the respondent’s level of emotional intelligence is high and the remaining 1/3rd of the
emotional intelligence of the respondents is low on the basis of age, gender, discipline and designation. Present study may contribute to the better understanding of emotion-related
parameters that affect the work process with the view to increasing the quality of service in the educational sector.
INTRODUCTION TO HRM
Human Resource Management (HRM) is a relatively new approach to manage people in any organisation. This approach considers people as the key resource. It is concerned with the people dimension in management of an organisation. Since an organisation is a body of people, their acquisition, development of skills, motivation for higher levels of attainments, as well as ensuring maintenance of their level of commitment are all significant activities. These activities fall in the domain of HRM. HRM is a process, which consists of four main activities, namely, acquisition, development, motivation, as well as maintenance of human resources. Human Resource Management is responsible for maintaining good human relations in the organisation. It is also concerned with development of individuals and achieving integration of goals of the organisation and those of the individuals.
According to John Storey, (1995), “Human resource management is a distinctive approach
to employment management which seeks to achieve competitive advantage through the strategic deployment of a highly committed and capable workforce, using an integrated array of Cultural, structural and personal techniques”.
EMOTIONAL INTELLIGENCE IN HRM
In today's business world, HR professionals and managers need to be emotionally intelligent to deal with problems, lead by example, take initiative, handle difficult situations and develop good relationships with clients. Successful human resource professionals know that their job is not just about hiring: they can help line managers deliver measurable improvements in productivity and win the hearts and respect of management to contribute to the bottom line.
Emotional Intelligence provides methods to help solve the retention and morale problems, improve the company's creativity, create synergy from teamwork, improve information flow, drive forward the objectives, and ignite the best and most inspired performance from the employees.
challenges of survival or well-being, both personally and professionally. An individual experience many types of emotions in daily lives such as fear, anger, enjoyment, disgust, interest, surprise, contempt, shame, sadness and guilt. These emotions become much stronger during times when the
values and beliefs are compromised by individuals.
However, in order to function professionally, individuals often have to temporarily manage these emotions to encourage smooth communication or avoid conflict. But managing these emotions does not equate to ignoring them, as this can, over time, take its toll and lead to stress, with true personal feelings leaking through the mask. The consequence of such mismanagement of emotions leads to HR functions being overwhelmed by petty conflicts in the workplace which spiral out of control. Emotional Intelligence is one concept which may help to overcome these conflicts.
REVIEW OF LITERATURE
1. A study by Muhammed Mansoor Alam (2009) reveals that the study seeks to investigate the relationship between emotional intelligence (EI) and job satisfaction among the administrative staff in higher education institution in Malaysia. The sample size of the study is 120. The tools carried out were descriptive analysis and linear regression. The majority of them were male employees who were married, and the study concluded that EI
has a positive effect on the employees. The study suggested that HR policies have to be developed to ensure that the EI factor must be incorporated particularly in the crucial process like staffing and performance appraisal.
2. Mohsin Atta & Muhammed Ather (2013) profound the aim of this study is to examine the relationship pattern between personality traits and emotional intelligence, besides exploring the gender differences. The sample size of the study is 163. The statistical packages used were Alpha coefficients and descriptive analysis, correlation and T-test. The study resulted that female teachers are high on conscientiousness when compared to males. The study suggested using other sources rather than self-reporting method.
4. According to U W M R Sampath Kappagoda (2014), research the teachers who have high emotional intelligence show less work-to-family conflict and family-to-work conflict. It is concluded that the possession of high emotional intelligence is more important when
balancing work-family responsibilities.
5. Mondal, Paul and Bandyopadhyay (2012) in their study theyanalyzed the nature and extent of Emotional Intelligence among secondary level schools teachers of Burdwan district in west Bengal. The respondents are 300 teachers in urban and rural areas encompassing different gender, age, teaching experience, qualification and training were taken for the study. The results revealed that few demographic factors positively impacted on the level of teacher’s Emotional Intelligence while some were not significant.
6. Akomolafe (2011) study shows an interactive and relative effect of Emotional Intelligence and locus of control on burnout among the secondary school teachers and has suggested that secondary school teachers should be managed by capable and qualified counselors for the desired results to be achieved.
7. Research study by Lynda Jiwen Song, et al., (2010) narrates the debate about whether
Emotional Intelligence has incremental validity over and above traditional intelligence dimensions. Emotional Intelligence and general mental abilities (GMA) differ in predicting academic performance and the quality of social interactions among college students. Using two college student samples, it is found that support for the notion that EI and GMA each have a unique power to predict academic performance, and that GMA is
the stronger predictor. However, the results also show that Emotional Intelligence, but not GMA, is related to the quality of social interactions with peers.
RESEARCH METHODOLOGY
OBJECTIVES OF THE STUDY
1. To assess the level of emotional intelligence levels of the male and female faculty working in colleges.
2. To study the factors associated with emotional intelligence of male and female faculties. 3. To study the personal profile of male and female faculty at colleges.
ANALYSIS AND INTERPRETATION
DEMOGRAPHIC PROFILE OF THE RESPONDENTS
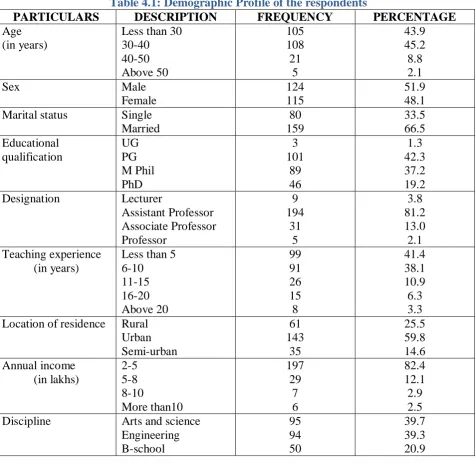
[image:5.595.70.547.274.740.2]Table 4.1 depicts the information about demographic profile of the educators.
Table 4.1: Demographic Profile of the respondents
PARTICULARS DESCRIPTION FREQUENCY PERCENTAGE
Age (in years)
Less than 30 30-40 40-50 Above 50 105 108 21 5 43.9 45.2 8.8 2.1
Sex Male
Female
124 115
51.9 48.1 Marital status Single
Married 80 159 33.5 66.5 Educational qualification UG PG M Phil PhD 3 101 89 46 1.3 42.3 37.2 19.2 Designation Lecturer
Assistant Professor Associate Professor Professor 9 194 31 5 3.8 81.2 13.0 2.1 Teaching experience (in years)
Less than 5 6-10 11-15 16-20 Above 20 99 91 26 15 8 41.4 38.1 10.9 6.3 3.3 Location of residence Rural
Urban Semi-urban 61 143 35 25.5 59.8 14.6 Annual income (in lakhs) 2-5 5-8 8-10 More than10 197 29 7 6 82.4 12.1 2.9 2.5 Discipline Arts and science
INFERENCE
45.2% respondents fall under the age group between 30-40 years and only 2.1% of
respondents fall under the age group of more than 50 years of age.
51.9% of the respondents are male. Remaining 48.1% of the respondents are female. 66.5% of the respondents are married and the remaining 33.5% of respondents are
unmarried.
42.3% of the respondents are falling under the PG qualification and 19.2% of respondents
fall under PhD qualification.
Majority of 81.2% of respondents fall under the designation as Assistant Professor. Only
2.1% of the respondents are Professors in the designation group.
41.4% of the respondents have less than five years of teaching experience and only 3.3%
of respondents fall under the group of more than 20 years of teaching experience.
Majority of 82.4% of respondents have the annual income level between 2-5 lakhs and
only 2.5% of respondents have more than 10 lakhs as the annual income.
39.7% of the respondents come under the Arts and Science colleges discipline and 20.3%
of respondents fall under the B-School group discipline. DESCRIPTIVE STATISTICS
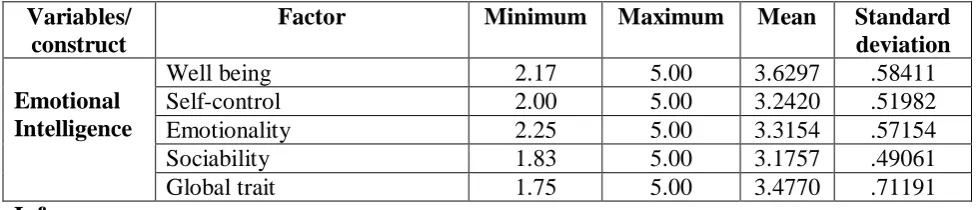
[image:6.595.65.555.503.608.2]The Descriptive procedure displays univariate summary statistics for several variables in a single table and calculates standardized values (z scores).
Table 2: Descriptive Statistics
Variables/ construct
Factor Minimum Maximum Mean Standard deviation Emotional
Intelligence
Well being 2.17 5.00 3.6297 .58411
Self-control 2.00 5.00 3.2420 .51982
Emotionality 2.25 5.00 3.3154 .57154
Sociability 1.83 5.00 3.1757 .49061
Global trait 1.75 5.00 3.4770 .71191
Inference
ONE WAY ANALYSIS OF VARIANCE
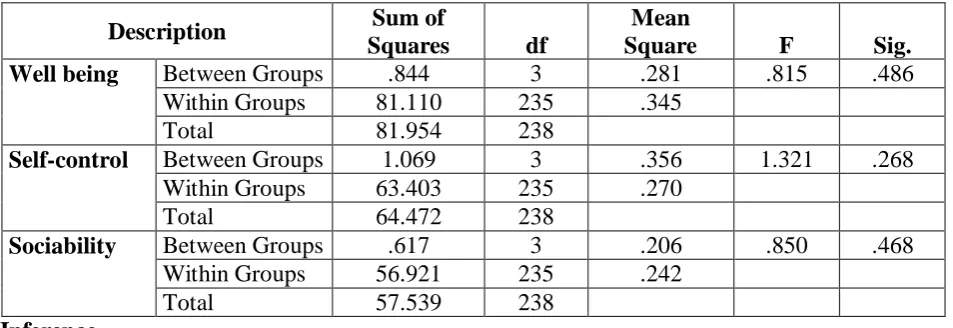
[image:7.595.72.549.182.346.2]One Way Analysis of Variance is performed to identify the significant difference in the perception of respondents of varied demographic profile with regard to the factors considered for the study.
Table 3: Analysis of Variance of the respondents of varied age group
Description Sum of
Squares df
Mean
Square F Sig.
Well being Between Groups .844 3 .281 .815 .486
Within Groups 81.110 235 .345
Total 81.954 238
Self-control Between Groups 1.069 3 .356 1.321 .268
Within Groups 63.403 235 .270
Total 64.472 238
Sociability Between Groups .617 3 .206 .850 .468
Within Groups 56.921 235 .242
Total 57.539 238
Inference
[image:7.595.72.547.503.708.2]There is no significant difference in Wellbeing factor (F=0.815, P>.05), Self-control factor (F=1.321, P>.05) and the Sociability factor (F=0.850, P>.05) among the respondents of different age group.
Table 4: Analysis of Variance of the respondents of varied gender
Description Sum of
Squares df
Mean
Square F Sig. Well being Between
Groups
.051 1 .051 .148 .701
Within Groups 81.903 237 .346
Total 81.954 238
Self-control Between Groups
.603 1 .603 2.238 .136
Within Groups 63.869 237 .269
Total 64.472 238
Sociability Between Groups
.076 1 .076 .313 .576
Within Groups 57.463 237 .242
Inference
There is no significant difference in wellbeing factor (F=0.148, P>.05), self-control factor (F=2.238, P>.05) and the sociability factor (F=0.313, P>.05) among the respondents of different gender.
FINDINGS AND SUGGESTIONS PERCENTAGE ANALYSIS
45.2% respondents fall under the age group between 30-40 years and only 2.1% of
respondents fall under the age group of more than 50 years of age.
51.9% of the respondents are male. Remaining 48.1% of the respondents are female. 66.5% of the respondents are married and the remaining 33.5% of respondents are
unmarried.
42.3% of the respondents are falling under the PG qualification and 19.2% of respondents
fall under PhD qualification.
Majority of 81.2% of respondents fall under the designation as Assistant Professor. Only
2.1% of the respondents are Professors in the designation group.
41.4% of the respondents have less than five years of teaching experience and only 3.3%
of respondents fall under the group of more than 20 years of teaching experience.
59.8% of the respondents are from the urban locality of residence and 14.6% of
respondents come under the semi-urban locality of residence.
Majority of 82.4% of respondents have the annual income level between 2-5 lakhs and
only 2.5% of respondents have more than 10 lakhs as the annual income.
39.7% of the respondents come under the Arts and Science colleges discipline and 20.3%
of respondents fall under the B-School group discipline. DESCRIPTIVE STATISTICS
Descriptive statistics reveals that for all the factors other than Sociability, Self-Control,
ONE WAY ANALYSIS OF VARIANCE
There is no significant difference in wellbeing factor, self-control factor and the sociability
factor among the respondents of different age group.
There is no significant difference in wellbeing factor, self-control factor and the sociability
factor among the respondents of different gender.
CONCLUSION
Emotional intelligence is very important for teachers in nowadays, as teachers are vital part of education without them there is nothing. So, teachers must improve their EI by developing self-awareness among them, maintain standards of integrity and always subject to self-criticism.
REFERENCES
1. Muhammed masrooralam, The Relationships Between the Emotional Intelligence and Job Satisfaction: Empirical Findings From Higher Education Institution in Malaysia, Journal of management and social sciences, Vol. 5, Issue no. 2, 2009, pg no: 124-139
2. Mohsin Atta, Muhammed Ather and Dr Maher Bano, Emotional Intelligence and
Personality Traits among University Teachers: Relationship and Gender Differences, International journal of Business and Social Science, Vol. 4, Issue 17, December 2013. 3. Laila; Amjad and Shehla, Emotional Intelligence Determining Work Attitudes and
Outcomes of University Teachers: Evidence from Pakistan, Interdisciplinary Journal of
contemporary research in business, Vol. 2, Issue. 10, February 2011, Pg.No: 240-259 4. U W M R Sampath Kappagoda, 2014. Emotional intelligence as a predictor of
work-family conflict among school teachers. IUP J. Organ. Behavior, 8(3): 53 68.
5. Van Rooy, D. L., &Viswesvaran, C. (2004). Emotional intelligence: a meta-analytic
investigation of predictive validity and nomological net. Journal of Vocational Behavior, 65, 71–95.
6. Matthews, G., Zeidner, M., & Roberts, R. D. (2002). Emotional intelligence: science and
myth. Cambridge, MA: MIT Press.
7. Mayer, J., & Salovey, P. (1997) what is emotional intelligence? In P. Salovey, & D.
Sluyter (Eds.), Emotional development and emotional intelligence: Implications for educators (pp. 3–31). New York7 Basic books.