2017 2nd International Conference on Artificial Intelligence and Engineering Applications (AIEA 2017)
ISBN: 978-1-60595-485-1
Structure Segmentation of Dental Tissue Based on
Semantic Characteristics
WEI WANG and XI JIN
ABSTRACT
Dental tissue segmentation is very challenging due to the complexity of histological structure, the variability of imaging modality and image quality. Aiming at this problem, a novel dental tissue structural segmentation method based on semantic characteristics was proposed, which not only focus on dental tissue semantic segmentation, but also the instance level tooth indication. The dental images were firstly pre-processed to decrease the impact of imbalanced local illumination. Secondly, the primary dental tissue segmentation results were obtained based on the prior knowledge of oral anatomy. Then a robust key point’s extraction strategy was investigated referring to dental tissue’s hierarchy structure. At last, the marker-controlled watershed transform was employed to complete semantic segmentation. The experimental results show that the proposed method is robust and has higher accuracy.
KEYWORDS
Dental Image Analysis; Semantic Segmentation; Object Instance Segmentation; Marker-controlled Watershed.
INTRODUCTION
With the rapid development of dental clinical diagnosis equipment, digital imaging technology has been widely used and become the basis of informatization and intellectualization. Recently, semantic dental tissue segmentation in dental images and videos is generally agreed to be a challenging computer vision task. Taking intra-oral camera as an example, common difficulties appear from the various imaging modality, image quality and patients variability. Firstly, the topological structure of dental hard tissue will change greatly according to different view angle. The discrepancy in profile among lingual, buccal and occlusal surface can be huge. Secondly, it is usually difficult to execute instance level tooth identification because of the weak inter-proximal surface. Thirdly, the variations in dental lesion shape and appearance will impact the accuracy of semantic segmentation greatly. Finally, the imbalanced local illumination and the specular reflection will bring image degradation and impact image processing.
_________________________________________
Wei Wang, [email protected], Xi Jin, [email protected] School of Optical-Electrical and Computer Engineering, University of Shanghai for Science and Technology, Shanghai 200093, China.
The algorithm proposed in this paper aims to the dental tissue segmentation for dental intra-oral camera. It not only focus on the semantic segmentation to label dental hard tissue, soft tissue and background, but also the instance level segmentation between neighboring tooth within dental hard tissue. In the early research of image semantic segmentation, N-cut and Grab Cut algorithm [1-2] were widely used and proven to be efficient for binary classification. Nowadays deep learning technique is gradually applied into this field. From convolution neural networks [3, 4] (CNN) to fully convolutional networks [5, 6] (FCN), the performance of pixel-wise semantic image labeling was improved greatly. Moreover, the technique of conditional random field [7] (CRF), Markov random field [8] (MRF) and Gauss conditional random field [9] (G-CRF) is applied into post-processing step to further optimize semantic segmentation results. For instance-level object segmentation, i.e. the recognition of individual object instance in single monocular images, it is still an incompletely solved task [10] and has become a new research hot spot [11-13]. Within the dental digital image analysis field, a lot of efforts have been done for dental tissue semantic segmentation. At present, their exist manual labeling method, adaptive threshold segmentation method, active contour evolution method [14-17], and so on. Seldom research was reported for instance level segmentation of dental tissue. After analysis of current study, a novel algorithm was investigated to solve the problem referring to the intra-oral image features and the prior knowledge of oral anatomy.
HIERARCHY STRUCTURE OF DENTAL TISSUE MODEL
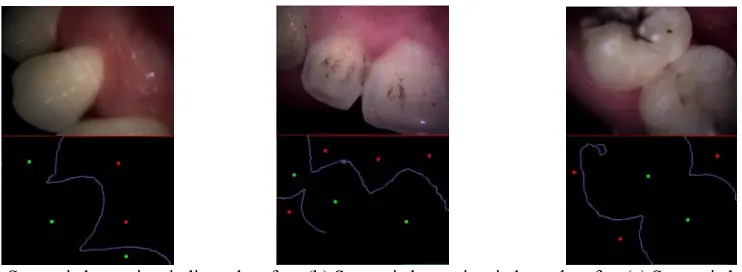
As intra-oral images have their own characteristics of histopathology appearance and clinical symptoms, three kinds of semantic key points can be extracted to describe the hierarchy structure, which are shown in Fig.1.
1) Dental soft tissue key points. These points usually locate in the center of dental soft tissue, such as gum, oral mucosa, and tongue, etc. Based on different view angel, the structure of dental soft tissue will change and lead to key point’s location change. For the case of lingual and buccal surface imaging, the key points of gum areas usually locate in the side of teeth roots as the red labels in Fig.1a and b shows. For the case of occlusal surface imaging, these points are mostly appears both sides of teeth just as Fig.1c does.
[image:2.612.113.484.529.665.2]
(a) Semantic key points in lingual surface (b) Semantic key points in buccal surface(c) Semantic key points in occlusal surface
2) Dental hard tissue key points. These points are defined as the center of each individual tooth. The green labels in Fig.1a~c correspond to these kind of points.
3) Dental tissue border key points. These points refer to the border between dental hard tissue and soft tissue which are shown as blue labels within Fig.1a~c.
Statistically, one tooth usually contains at least one hard tissue key point. The location of hard tissue key points and the distance among them is constrained by oral anatomy. For the location of dental soft tissue key points, they are grouped in one or both hard tissue sides, which are separated from hard tissue key points by the tissue border key points.
DENTAL TISSUE STRUCTURE SEGMENTATION
The algorithm for dental tissue structure segmentation contains several main steps. The first is dental image primary analysis, which includes the image pre-processing and interested areas segmentation. Based on the dental tissue primary segmentation results, distance transform was applied to get the skeleton information. Then dental semantic key points are calculated through the skeleton information and the prior knowledge of oral anatomy. Finally, marker-controlled watershed transform is employed to complete the dental tissue segmentation. The semantic characteristic is calculated referring to the information of dental tissue semantic key point. In the following sections, each step will be illustrated in details.
Dental Image Primary Analysis
DENTAL IMAGE PRE-PROCESSING
During the images and videos captured by intra-oral camera, the imbalanced local illumination cannot be avoided. It is necessary to normalize each picture before next step processing. Considering the imaging feature and real-time requirements, a free form digital image stretching algorithm based on linear transformations is applied into the original images. After pre-processing, the original images will be stretched into the similar intensity range.
Soft Tissue Primary Segmentation
For the soft tissue area primary segmentation, one of the mathematical morphological operations, i.e. image reconstruction, is efficient to overcome the impact of imbalance local illumination and weak boundary, which is given by:
' ( ker, )
Mask Mar S
S uct imreconstr
S (1)
Where '
S represents the primary segmentation results before optimization,
ker
Mar
S and SMaskare defined as follows:
others j
i g
j i j
i j
i
SMar G
0
T ) , (
) , ( g & T ) , ( g 1 ) ,
( R R2 R RG
Others j i g
j i g j
i
S G
R Mask
0
T ) , (
) , ( 1 ) ,
( RG
(3)
Where TR2 and TRG is predefined threshold, gR(i, j) and gG(i,j) is the
intensity value of red & green channel of normalized images. The intensity and color information is considered during Eq.2 and 3 calculation.
After image reconstruction process, '
S will be optimized into S by remove
those isolated regions which area size are too small.
HARD TISSUE PRIMARY SEGMENTATION
For the hard tissue area primary segmentation, the background areas are easily segmented by the global threshold at first. Then the hard tissue areas are left after soft tissue S and background areas Bremoval.
The background areas and the hard tissue areas '
T is calculated as follows:
Others j i g j
i g j
i g j
i
b R G B
0
T ) , ( & T ) , ( & T ) , ( 1 ) ,
( R G B
(4)
S B
T' (5)
WhereTR, TGand TB is predefined threshold, gR(i, j),gG(i,j)and gB(i, j) is
the intensity value of red, green and blue channel of normalized images, b(i,j) is the binary value of background areas flag.
The hard tissue area '
T need further optimization for better performance. The
morphological operations, i.e. image fill, is employed to fill the holes within '
T to
get the final resultsT.
Semantic Key Points Calculation
HARD TISSUE SEMANTIC KEY POINTS
Before hard tissue semantic key point’s extraction, the prior knowledge of oral anatomy is carefully investigated. Certain rules and constraints are found out and listed below:
During intra-oral camera imaging, each individual tooth has limited area size, and the area size variance is also limited between neighboring teeth;
The distance center of dental hard tissue indicates the location of each individual tooth, and the variance of distance between each distance center is limited;
Considering these rules, the procedure of dental hard tissue key points calculation can be described as follows:
Step1: Execute the Euclidean distance transform based on the hard tissue primary segmentation areasT.
dij min
DT[(i,j),(x,y)], (x,y)T
(6)Where [( , ),( , )] ( )2 ( )2
y j x i y
x j i
DT , dijmeans the pixel value within
the Euclidean distance transform imageDT, T is the complement of the hard tissue
primary segmentation areasT.
Step2: Through image reconstruction operation, calculate the local maximal distance map '
T
D .
' ( 1, )
ij T ij ij
ij d imreconstruct d d
d
(7)
Where T1 is predefined threshold, '
ij
d equals the pixel value within the local maximal distance map '
T
D .
Step3: Locate the dental hard tissue key points, and extract the potential
regions '
T
KP . Based on the rules and constraints, we can obtain the potential regions
as follows:
Others d
j i
KP ij
T
0
& d
1 ) ,
( T3
' T2 ij
'
(8)
Where T2 and T3 are predefined threshold.
Step4: Label the local maximal distance map '
T
KP , and select the local maximal
points as dental hard tissue key pointsKPT.
SOFT TISSUE SEMANTIC KEY POINTS
For dental soft tissue semantic key points calculation, the similar procedure is executed as hard tissue key points does. The corresponding Euclidean distance transform image is DS, and the local maximal distance map is
'
S
D . The potential
regions KPS' are also calculated, and the final soft tissue key points are represented
as KPS.
TISSUE BORDER SEMANTIC KEY POINTS
different type of dental tissue, which can provide useful information for the marker calculation within the next step.
The key points of tissue border can be obtained as Eq. 9:
G T b T
KPB ( ) (9)
Where means the morphological dilation operation, bis the structure element
and the default setting is a disc structure with a radius of 3, Tand Grefers to the
primary segmentation results of dental hard tissue and soft tissue.
Dental Tissue Semantic Segmentation
It is usually difficult to execute instance level tooth identification because of the weak inter-proximal surface. In order to solve this problem, marker-controlled watershed transform [18-20] is invoked for dental tissue precise segmentation. The markers are calculated based on the semantic key points and prior knowledge of oral anatomy at first, then they are imposed into the gradient image as local minimal areas. Finally, watershed transform is used to acquire the homogeneous region. Proper markers selection will be benefit to avoid the over-segmentation and acquire the proper instance level tooth identification results.
MARKER CALCULATION BASED ON SEMANTIC KEY POINTS
Considering the rules and constraints, i.e. each tooth contains at least one key point which corresponds to the local maximal distance, and tissue border key points separate different type of dental tissue, the procedure of markers calculation can be described as follows:
Step1: For each dental hard tissue key pointKPTm, the corresponding marker
1 ker
Mar
T can be obtained referring to the Euclidean distance withKPTm:
Supposed that
m xy m T Tm B
m min d , *min(D [(x,y),(x ,y )]), (x,y)KP ,(x ,y )KP ' ' ' ' 2 1 (10) Then
Others KP y x y x j i j iTMar m Tm
0 ) , ( , ) , ( ), , ( D 1 ) , ( T 1 ker (11)
Where KPB is the tissue border key points, dxy equals to the distance value of
certain hard tissue key pointKPTm , DT[,]is the Euclidean distance transform,
1
m
and m2is predefined parameters.
Step2: Referring to tooth topological structure, TMarker2 is calculated as Eq.12.
Others KP y x d d j i
TMar 0 ij n xy T
Where n is predefined parameters, dxyand dij means the distance value of
pixels in (x,y) and (i,j) .
Step3: TMarker3 is obtained through the complement of the hard tissue primary
segmentation results:
b T
TMarker3 (13)
Where T is the complement of the hard tissue primary segmentation areasT, means the morphological erosion operation, bis the structure element and is
usually set as a disc structure with radius range within 3~5. Step4: Finally, the marks are given by:
3 ker 2 ker 1 ker
ker Mar Mar Mar
Mar T T T
T (14)
MARKER-CONTROLLED WATERSHED TRANSFORM
After the markers calculation complete, Sobel operator gradient is applied into the normalized image g(x,y) to calculate the gradient imageg. Then TMarker is imposed into g as local minimal regions, and the modified gradient image '
g
is
obtained. After that, watershed transform is executed on '
g
and get homogeneous regions.
' ( , ker)
Mar
T g IMMIN
g
(15)
Where IMMIN()means the morphological operation of setting regional minima
within original intensity image.
In the following experimental section, Fig.2 illustrates each step in details. The neighboring tooth was identified successfully.
DENTAL TISSUE SEMANTIC CHARACTERISTICS CALCULATION
Once the homogeneous regions are acquired, the procedure of dental tissue semantic characteristics calculation can be described as follows:
Step1: Search dental semantic key points in each homogeneous region, and record the number and type of the found key points.
Step2: If certain homogeneous region only have one semantic key point regardless of soft tissue or hard tissue, the semantic characteristics are given by:
thers , 0 ) n ..., , 2 , 1 ( ) , ( , ) n ..., , 2 , 1 ( ) , ( P , 1 ) , ( Re Sm ' O i Li y x KP T i Li y x K y x
sults i Tm (16)
Where Liis ithhomogeneous region after marker-controlled watershed, nis the
tissue indication, 0 equals to the background areas characteristics, Ti means the
hard tissue labels for each individual tooth.
Step3: If certain homogeneous region have zero or more than one semantic key point, the semantic characteristics are calculated as Eq.18:
Supposed that
) , , max(
maxi NLi B NLi S NLi T
N (17)
Then thers , 0 ) n ..., , 2 , 1 ( N N & N , ) n ..., , 2 , 1 ( N N & N , 1 ) , (
Re max 2 maxi Li
Li maxi 1 max ' O i N T i N y x sult T Li i i S Li i (18)
where NLi is the pixel number of ithhomogeneous region,NLiS is the pixel
number of the intersection of soft tissue primary segmentation results and
ithhomogeneous region, NLiTis the pixel number of the intersection of hard tissue
primary segmentation results and ith homogeneous region, 1 and 2 are
predefined parameters and the range is [0,1].
Step4: As the weak boundary between background and soft tissue areas, further optimization is necessary for background areas withinRe '
sult . The process is described by Eq.19.
other , ) , ( Re 1 y) S(x, & 0 y) (x, esult , 1 ) , ( Re ' ' y x sult R y x
sult (19)
Where S(x,y) is the dental soft tissue primary segmentation results, and sult
Re means the final dental tissue semantic characteristics results.
EXPERIMENTAL RESULTS
Algorithm Evaluation Scheme
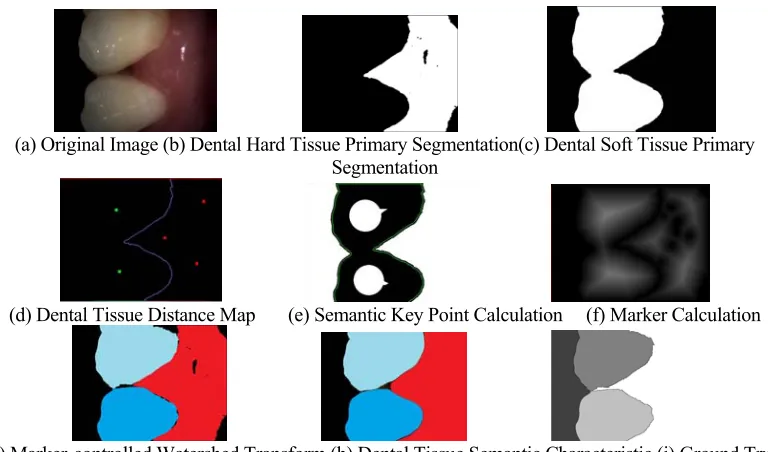
(a) Original Image (b) Dental Hard Tissue Primary Segmentation(c) Dental Soft Tissue Primary Segmentation
(d) Dental Tissue Distance Map (e) Semantic Key Point Calculation (f) Marker Calculation
[image:9.612.105.489.51.277.2]
(g) Marker-controlled Watershed Transform (h) Dental Tissue Semantic Characteristic (i) Ground Truth Results
Figure 2. Dental Tissue Semantic Segmentation Results.
Corresponding to each testing image, a ground truth image was created through manually labeling dental tissue type by pixel. After dental image semantic segmentation, the ground truth data were employed for the algorithm performance evaluation.
In order to facilitate the estimation of algorithm performance, the evaluation indices [21] are given by:
P(NgtNseg)/Ngt (20)
R(NgtNseg)/Nseg (21)
( 2 1) /[ 2( )]
R P PR
F (22)
where P, Rand Fmeans the value of precision, recall of retrieval and normal
average precision, and Ngt is the pixel number of each dental tissue type within
ground truth image, Nseg refers to the corresponding pixel number in the
segmentation results, is the parameter for Fcalculation and the default value is
set as 1.
Algorithm Evaluation Results
By carrying out a series of experiments and employing mathematical statistics, the parameters can be determined for obtaining satisfying experiments results. Generally, there are three kinds of parameters, listed as follows:
20
G B
R T T
T , TRG150 , TR245 in dental tissue segmentation process;
15 1
T
, T2 20 , T3 5 for key points calculation; m10.5 ,
8 . 0
2 n m
king the picture shown in Fig.2a as an example, which was extracted from the testing data set. Fig.2b and c corresponds to the dental hard tissue & software tissue primary segmentation results. Through Fig.2b, we found the primary segmentation result can hardly separate neighboring two teeth, and need further processing. Based on the dental tissue primary segmentation results, distance transform was applied to get the skeleton information, the distance map is shown as Fig.2d. Combined with prior knowledge and dental skeleton information, semantic key points were calculated as Fig.2e. The red points belongs to soft tissue, the green ones were extracted from hard tissue, the purple curve means tissue border.
Fig.2f indicates the marker calculation results referring to the dental semantic key points. Fig.2g shows the marker-controlled watershed transform results, and the corresponding semantic characteristic is Fig.2h. Compared Fig.2 h with Fig.2i, i.e. the ground truth results, the corresponding evaluation indices is listed as Tab. 1.
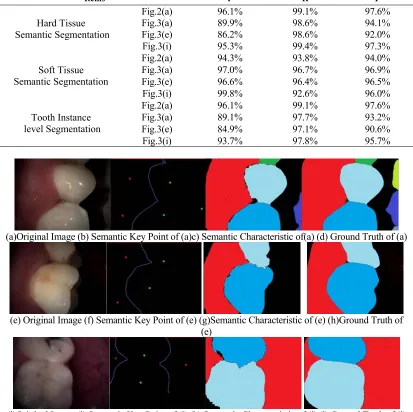
TABLE 1. SEGMENTATION ACCURACY OF FIG.2 & FIG. 3.
Items P R F
Hard Tissue Semantic Segmentation
Fig.2(a) 96.1% 99.1% 97.6%
Fig.3(a) 89.9% 98.6% 94.1%
Fig.3(e) 86.2% 98.6% 92.0%
Fig.3(i) 95.3% 99.4% 97.3%
Soft Tissue Semantic Segmentation
Fig.2(a) 94.3% 93.8% 94.0%
Fig.3(a) 97.0% 96.7% 96.9%
Fig.3(e) 96.6% 96.4% 96.5%
Fig.3(i) 99.8% 92.6% 96.0%
Tooth Instance level Segmentation
Fig.2(a) 96.1% 99.1% 97.6%
Fig.3(a) 89.1% 97.7% 93.2%
Fig.3(e) 84.9% 97.1% 90.6%
Fig.3(i) 93.7% 97.8% 95.7%
(a)Original Image (b) Semantic Key Point of (a)c) Semantic Characteristic of(a) (d) Ground Truth of (a)
(e) Original Image (f) Semantic Key Point of (e) (g)Semantic Characteristic of (e) (h)Ground Truth of (e)
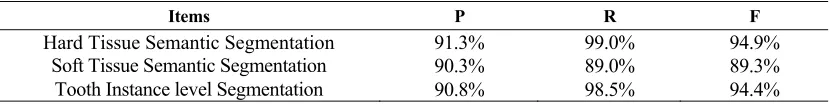
[image:10.612.91.504.274.686.2]TABLE 2. AVERAGE SEGMENTATION ACCURACY WITHIN TEST DATA SET.
Items P R F
Hard Tissue Semantic Segmentation 91.3% 99.0% 94.9%
Soft Tissue Semantic Segmentation 90.3% 89.0% 89.3%
Tooth Instance level Segmentation 90.8% 98.5% 94.4%
The experimental results of other dental images are illustrated in Fig.3, which can represent the case of lingual, buccal and occlusal surface. The corresponding evaluation indices is also listed as Table 1.
If we apply the algorithm to the test data set, satisfactory results are achieved and shown as Tab. 2. The values of precision, recall of retrieval and normal average precision are all close to 90%. The experimental results shows our method is not only efficient for dental hard tissue and soft tissue’ semantic segmentation, but also for dental tooth instance level segmentation.
CONCLUSION
In this paper, a semantic dental tissue segmentation algorithm is presented. It is built on the basis of the semantic characteristics of dental tissue model. It is not only suitable for the successful segmentation of dental soft tissue and hard tissue, but also for the instance-level dental tooth segmentation. After dental image primary analysis, three types of semantic key points are obtained. In order to achieve better segmentation results, the marker-controlled watershed transform is applied to ensure the homogeneous region segmentation. The semantic key points are the useful reference for the marker calculation and the final semantic characteristic calculation. Finally, the proposed method is proved to be effective by the results of experiment.
ACKNOWLEDGMENTS
The work described in this paper was substantially supported by the Training Program Foundation for 2016 Young Teacher from Shanghai Municipal Education Commission (No.ZZsl15012), the Cultivation Fund of the Scientific and Technical Innovation Project, USST (No.1000302006). The authors would like to thank the anonymous reviewers for their constructive comments.
REFERENCES
1. Boykov Y.Y., Jolly M.P. “Interactive graph cuts for optimal boundary & region segmentation of objects in N-D images”, IEEE International Conference on Computer Vision (ICCV 2001). Vancouver, Canada, 105-112 (2001).
2. Berglund J., Skorpil M. Multi-scale graph-cut algorithm for efficient water-fat separation. Magnetic Resonance in Medicine. 78(3), 941-949 (2017).
3. Rawat Waseem, Wang Zenghui. Deep convolutional neural networks for image classification: A Comprehensive Review. Neural Computation. 29(9), 2352-2449 (2017).
5. Bi Lei, Kim Jinman, Ahn Euijoon, et al. Dermoscopic image segmentation via multistage fully convolutional networks. IEEE Transactions on Biomedical Engineering, 64(9), 2065-2074 (2017). 6. Kruthiventi Srinivas S.S., Ayush Kumar, Babu R. Venkatesh. DeepFix: A fully convolutional
network for predicting human eye fixations. IEEE Transaction on Image Processing, 26(9), 4446-4456 (2017).
7. Chen Liang-Chieh, Papandreou George, Kokkinos lasonas, et al. DeepLab: Semantic Image Segmentation with Deep Convolutional Nets, Atrous Convolution, and Fully Connected CRFs. IEEE Transactions on Pattern Analysis and Machine Intelligence, 99, 1-1 (2017).
8. Zheng Chen, Zhang Yun, Wang Leiguang. Semantic Segmentation of Remote Sensing Imagery Using an Object-Based Markov Random Field Model with Auxiliary Label Fields. IEEE Transactions on geoscience and remote sensing, 55(5), 3015-3028 (2017).
9. Chandra Siddhartha, Kokkinos lasonas. “Fast, Exact and multi-scale inference for semantic image segmentation with deep Gaussian CRFs”, 14th European Conference on Computer Vision (ECCV). Amsterdam, Netherlands, 402-418 (2016).
10. Brand J., Ochs M., Mester R. “Instance-Level segmentation of vehicles by deep contours”, 13th Asian Conference on Computer Vision: International Workshops. Taipen, Taiwan, 477-492 (2016). 11. Chen Hao, Qi Xiaojuan, and Yu Lequan, et al. DCAN: Deep contour-aware networks for object
instance segmentation from histology images. Medical Image Analysis, 36, 135-146 (2017). 12. Weinmann Martin, Weinmann Michael, Mallet Clement, et al. A classification-segmentation
framework for the detection of individual trees in dense MMS point cloud data acquired in urban areas. Remote sensing, 9(3), 277 (2017).
13. Seguin Guillaume, Bojanowski Piotr, Lajugie Remi, et al. “Instance-level video segmentation from object tracks”, 29th IEEE Conference on Computer Vision and Pattern Recognition Workshops (CVPRW). Las Vegas, NV, 3678-3687 (2016).
14. Liu Xiaoxiong, Shi Feng, Zhang Jiwu. Teeth segmentation from CBCT images using deformable triangle mesh model. Chinese Journal of Medical Instrumentation, 35(6), 414-417 (2011).
15. Zang Jing, Song Kai. Research on segment algorithm based on the nonnasality image. Control Engineering of China, 14, 96-98 (2007).
16. Li Huilin, “Research on tooth segmentation method in virtual orthodontic system”, Master thesis, Xi’an University of Science and Technology, 2016.
17. Ma Yaqi, Li Zhongke, Wang xianze. Research on interactive algorithm of teeth segmentation based on geodesic path. Journal of Image and Graphics, 16(4), 554-557 (2011).
18. Wei-Yen Hsu. Improved watershed transform for tumor segmentation: application to mammogram image compression. Expert Systems with Applications, 39, 3950-3955 (2012).
19. Huiguang Yang, Narendra Ahuja. Automatic segmentation of granular objects in images: combining local density clustering and gradient-barrier watershed. Pattern Recognition, 47, 2266-2279 (2014).
20. Xiaodong Zhang, Fucang Jia, Suhuai Luo, Guiying Liu, Qingmao Hu. A marker-based watershed method for X-ray image segmentation. Computer Methods and Programs in Biomedicine, 113, 894-903 (2014).