2016 6th International Conference on Information Technology for Manufacturing Systems (ITMS 2016) ISBN: 978-1-60595-353-3
1 INTRODUCTION
With the rapid development of multimedia technology and pervasiveness of intelligent mobile terminals, nowadays natural scene images have become the most popular information carrier, underscoring people’s needs for processing enormous amounts of imaging information. Therefore, in recent years technologies concerning image scene understanding and content-based image search have come under the spotlight in the field of computer vision[1]. Researches on detection and recognition of natural scene images have a wide range of applications, which mainly fall into following categories: content-based image searching technology; accurate tag assignment for targets in images after analyzing image scenes and sematic information they contain; intelligent traffic systems involving issues such as location and recognition of license plates; vision assistant systems helping the blind retrieve visual information in their daily life.
Nonetheless, reading Chinese characters from natural scenes is often compounded by various issues, such as multiple fonts and sizes, complex backgrounds, varied orientations and uneven illumination. Thus, it is still challenging to develop a robust method for the effective extraction and recognition of Chinese texts from natural scene images.
Currently there are generally two types of methods for text location, texture-based method and region-based method. Texture-based method retrieves images’ texture features through a sliding window and predicts the probabilities for different windows to contain characters. For such methods, their strength is the robustness on resolving image noise, whereas their weakness is the significantly increased complexity in computation after the incorporation of sliding windows. Moreover, as this method cannot be used to retrieve split characters, it is not advantageous for character recognition. By using AdaBoost classifier, Chen[2] combined mean gray value and variance characteristics of an image’s partial areas to locate text region. Through the optimized Niblack algorithm[3], they performed binarization on the image and obtained the character candidate regions. Pan et al. [4] proposed to integrate features of HOG and multi-scale Local Binary Pattern for text detection, and then use Markov Random Field to merge characters into words. This method earned the best score in ICDAR 2005 Text Detection Contest. Yet its disadvantage is the enormous computation power and time required in execution. Lee[5] et al. improved the efficiency of text detection through using six different features to represent characters. In this method, multi-scale continuous search was combined with a certain level of AdaBoost algorithm to achieve a strong classifier
Chinese Text Detection and Recognition in Natural Scene Using
HOG and SVM
Boran Yu, Hongjie Wan
College of Information Science and Technology, Beijing University of Chemical Technology, Beijing, China
after training multiple weak classifiers. Song et al.[6] also presented a method based on AdaBoost classifier. Yet they opted for Harr-like features.
In this area-based method, local feature of each pixel in an image is first computed, followed by CCA(Connected Component Analysis), which merges pixels with similar features into an uninterrupted area. As pixels within a single character usually possess similar color features, CCA can often retrieve an intact character. Because such methods require sufficient number of pixels with similar features, their qualities are sensitive to noise or low resolution images. Kim et al.[7] combined three different image channels to look up for character candidate regions. Their method first merges characters into character strings through limiting conditions such as character size and spatial location. Then it filters noises by combining SVM and character features formed after wavelet transformations. Epstein [8] proposed to use SWT (Stroke Width Transform) to detect text regions. SWT first carries out edge detection with Canny operator, then searches for pixel pairs that meet the pre-conditions along the gradient direction of peripheral pixels, and finally uses stroke width values to add routes between paired pixels. Epstein first extracted character candidate regions through SWT method and then merged characters into words by setting up connection conditions. By using MSER, Neuman et al. [9] extracted candidate character regions, merged characters based on features such as text line, and eventually accomplished good text detection through using highly efficient alpha-beta pruning algorithm. Their validation experiment demonstrated that MSER can retrieve most of the texts from images in a rapid and efficient process.
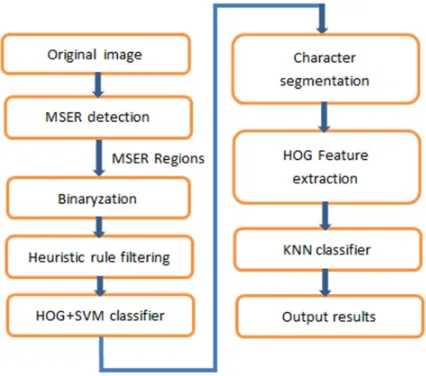
In this paper, we use MSER to retrieve candidate character regions from connected regions, and then perform binarization on images, setting candidate character regions to white and background to black. Next, we merge the strokes of characters through morphology close operation and filter candidate character regions with pre-set heuristic rules and SVM classifier in succession, resulting in the final character regions. In the recognition stage, we use KNN classifier. The flowchart of the flowchart of the entire system is shown below in Figure 1.
[image:2.612.326.539.36.224.2]The remaining part of this paper is structured as following: the second part is the text detection and localization algorithm; the third part is the character recognition; the fourth part is the experimental results and analysis; the fifth part offers the conclusion.
Figure 1. System Flowchart.
2 TEXT DETECTIONAND LOCALIZATION
2.1 Text Candidate Region Extraction Based on
MSER
MSER(Maximally Stable Extremal Regions) is an algorithm for detecting image region features proposed by J.Matas et al. in 2002. Specifically, it was designed to solve the issue of matching wide baseline stereo vision[10]. In recent years, MSER has been successfully applied to detect license plates and texts in natural scenes.
MSERs are the most stable regions obtained during image binarization with different gray threshold values. We use threshold values between 0 and 255 to binarize an image, setting pixels with gray values lower than thresholds as white and ones with gray values higher than thresholds as black. In this way, we have obtained a series of extremal regions, in which gray values of all pixels are either higher or lower than those at the external boundaries. If extremal regions are stable within a certain range of gray values, such regions are defined as maximally stable extremal regions, as described by the formula below:
| \ |
( ) i i
i
Q Q
q i
Q
+ ∆ −∆
=
(1)
1
Q,...,Qi−1,Qi…(Qi⊂Qi+1)are extremal regions. If local minimum values of (1) exist at *
i , then Qi* is MSER. ∆ denotes the step length of gray
threshold value. After extracting candidate character regions through MSER, we binarize the image, setting MSER regions to white and remaining regions to black. In the next step, mathematical morphology methods are used to piece together the broken strokes.
2.2 Merging Strokes
There are seven basic strokes in Chinese characters: horizontal, vertical, left, down, point, fold, hook, combination and variation of which constitute unique characters. A character can contain separated strokes, which, for extracting the entire character, have to be merged into a connected region. For each candidate character regions, we use mathematical morphology and carry out close operation to first corrode and then swell the square structure elements, as shown in (2).
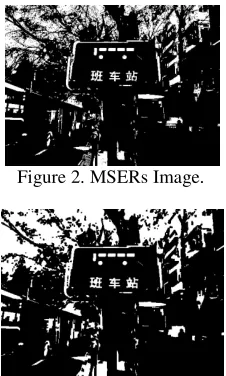
[image:3.612.121.234.264.452.2](2) F represents target image, S denotes structural element, ⊕ represents swelling operation, Θ represents corroding operation. A processed image is shown in Figure 2, suggesting that some small holes and gaps are filled and the boundary is smoothened.
Figure 2. MSERs Image.
Figure 3. Image after close operation processing.
Even after morphology operation, candidate character regions still contain a large portion of non-text regions. To solve this problem, we design heuristic rules to make preliminary judgment on candidate character regions based on special traits of Chinese characters. We reason that in natural scene images, the sizes of characters are usually not excessively large or small. Thus we calculate the Size(region) of the rectangle encasing each region, as shown in (3).
15000<Size region( ) 150000<
(3) An area smaller than 15000 or larger than 150000 is considered to be a non-text region. Width/height ratio of a character is also limited within a certain range.
( )
0.5 1.6
( )
width region height region
< <
(4) As the shape of Chinese characters is close to a square, we fit each region into an oval and calculate the oval’s eccentricity, E region( ). Areas with an
eccentricity larger than 0.75 are considered to be non-text regions.
( ) 0.75
E region <
(5) By following the above rules, we are able to winnow out a large number of non-text regions. The remaining regions are similar to text characters and need to be accurately classified with SVM classifier.
2.3 Feature Extraction
HOG (Histogram of Oriented Gradient) is a feature-description descriptor proposed in 2005 by Navneet Dalal and Bill Triggs[11]. The authors initially used HOG descriptor to detect passengers in still images, and later expanded this method for detecting animals and vehicles. The core idea of HOG descriptor is that the contour and shape of a local target in images can be successfully portrayed through gradients and density distribution of the edge direction. HOG descriptor divides up an image into small connected regions, called cell, and then calculates their gradients or histogram of their edge direction. Eventually, these histograms are linked to form the feature descriptor. HOG feature is a descriptor with rich and diverse shapes, retrieving a target’s shape through quantizing gradient information of each cell. For the remaining regions after heuristic-rules-guided screening, we dissect them out in their encasing rectangles and extract their HOG feature. The main steps are described as following: first, calculate the gradient. The gradient of the pixel
( , )x y in an image is:
( , ) ( 1, ) ( 1, ) x
G x y =H x+ y −H x− y
(6) ( , ) ( , 1) ( , 1)
y
G x y =H x y+ −H x y−
(7) In (6) and (7), G x yx( , ), G x yy( , ), H x y( , ) denote horizontal gradient of input pixel( , )x y , vertical gradient, and pixel value respectively. The gradient magnitude and direction at the pixel ( , )x y are:
2 2
( , ) x( , ) y( , ) G x y = G x y +G x y
(8)
1 ( , )
( , ) arctan ( )
( , )
y
x
G x y x y
G x y
α
−=
(9) We then construct a histogram along the gradient direction and normalize each dissected part to 48×48 pixel. In the histogram, every 8×8 pixel is set as a cell while every 2×2 cell is set as a block. Each time, only one cell moves in a block. The gradient direction is quantitated as 9. As a result, the number of dimensions of HOG eigenvector is 900. Chinese character “BAN”and its visualized HOG feature are shown in Figure 3.
( )
Figure 4. Visualized HOG Features.
2.4 SVM Classifier
SVM (Support Vector Machine) is a machine learning method based on the statistical classification theory of VC (Vapnik–Chervonenkis) dimension and SRM (Structural Risk Minimization) principles. It usually maps the input vectors to a high-dimensional feature space and constructs optimal separating hyperplanes in this space to classify two or multiple groups. SVM is particularly advantageous for solving small sample size, non-linear and high-dimensional pattern recognition problems. We extract HOG feature from candidate character regions, which are divided up into positive and negative regions. We assume that positive regions contain characters and consider them as the results of accurate discrimination.
3 TEXT RECOGNITION
In the stage of character recognition, we used KNN classifier. The core idea of KNN is as following: assume that the samples can be divided to P categories, C C1, 2,...,Cp. Xdenotes a sample in the
train set whereas Ydenotes a sample of Chinese character ready for testing. And d X Y( , )represents
the distance between the test sample and a sample in the train set. The smaller d X Y( , )is, the higher the
similarity betweenXand Y becomes. Usually, for a character sample Y ready for test, K samples
with the closest distances to it will be selected from the train set{ ,X X1 2,...,Xk}. Through statistical analysis of the Ksamples, the category with the largest sample size is determined as Ci, and i can be any number among 1,2,3,...,P. Eventually the test sample Y is judged to belong in the category
i
C. In this paper, we let the HOG feature vector
extracted from the Chinese character test sample be 1 2
( , ,..., )n
Y = y y y and let eigenvector of a train set
sample X be X =( , ,..., )x x1 2 xn , then Euclidean
distance d X Y( , )can be expressed as:
1 2 2
1
( , ) (i n| i i| ) i
d X Y x y
=
=
=
∑
−(10) As to the neighboring number K, when K=1 it
is called the nearest neighbor, i.e. the category of the train set sample to which the Chinese character test sample is assigned. The circumstance of K =1 is
not robust as it often leads to erroneous classification.
GB2312 is a standard set of simplified Chinese characters, covering 6763 characters in total. Among
these characters, 3755 belong in Level One, the most frequently used characters whereas 3008 belong in Level Two. According to a previous research, 3755 frequently used characters cover over 99% of all materials written in Chinese[12]. Nonetheless, it is difficult to collect from natural scenes sufficient samples covering all character categories. Therefore, we employ Microsoft Word to generate multiple fonts as the train set for KNN classifier.
We have generated seven common fonts for 3755 Level One Chinese characters. For each font, we prepare eight sizes, 32×32, 48×48, 64×64, 80×80, 96×96, 128×128, 144×144, 160×160. Thus, a single character has 7×8=56 samples.
4 EXPERIMENT
Using a smart phone, we have taken 400 scene images (8 million pixels each) as the experiment data set, including road signs, outdoor advertisement, information signs and building names. In these images, Chinese characters are arranged in different orders, sizes and scales. We randomly pick up 200 images from the data set as the train set and extract HOG feature vector from characters in these images to train a SVM classifier. The remaining 200 images are used as the test set. Here we evaluate our method with precision and recall, which are expressed as below:
/ precision=T N
(11)
/
recall=T C (12)
Rdenotes the number of correctly recognized
[image:4.612.314.558.552.744.2]characters; N represents the overall recognition results, including both right and wrong recognitions. Crepresents the number of total characters included in images.Table 1 shows that we have achieved 0.74 in precision and 0.65 in recall with our algorithm. Table 1.Experimental results of natural scene images containing texts
Precision recall Ours 0.74 0.65
Figure 5. Experimental Results.
5 CONCLUSIONS
In this paper, we first employ MSER to detect candidate character regions and merge character strokes with morphology operation. By setting up heuristic rules suitable for Chinese characters and using a SVM classifier, we have achieved accurate discrimination between text and non-text. Finally, we apply the KNN classifier in character recognition. And the experiment demonstrates that our algorithm has achieved satisfactory results.
REFERENCES
[1] Mashford, J., et al. “Image classifier and scene understanding systems of multiagent teams”. in Systems, Man, and Cyberbetics, IEEE International Conference on. 2000. p. 1460-1465 vol.2.
[2] Xiangrong, C. and A.L. Yuille. “Detecting and reading text in natural scenes”. in Computer Vision and Pattern Recognition, 2004. CVPR 2004. Proceedings of the 2004 IEEE Computer Society Conference on. 2004. p. 366 -373 Vol.2.
[3] Niblack, W. “An Introduction to Digital Image Processing”. 1986. p.115-116.
[4] Yi-Feng, P., H. Xinwen, and L. Cheng-Lin. “A Robust System to Detect and Localize Texts in Natural Scene Images”. in Document Analysis Systems, 2008. DAS ’08. The Eighth IAPR International Workshop on. 2008. p. 35-42.
[5] Jung-Jin, L., et al. “AdaBoost for Text Detection in Natural Scene”. in Document Analysis and Recognition (ICDAR), 2011 International Conference on. 2011. p. 429-434. [6] Yajuan, S., et al. “Reading text in street views using
Adaboost: Towards a system for searching target places.” in Intelligent Vehicles Symposium, 2009 IEEE. 2009. p. 227-232.
[7] Kim, K.C., et al. “Scene text extraction in natural scene images using hierarchical feature combining and verification”. in Pattern Recognition, 2004. ICPR 2004. Proceedings of the 17th International Conference on. 2004. p. 679-682 Vol. 2.
[8] Epshtein, B., E. Ofek, and Y. Wexler. “Detecting text in natural scenes with stroke width transform”. in Computer Vision and Pattern Recognition(CVPR), 2010 IEEE Conference on. p. 2963-2970.
[9] Neuman, L. and J.Matas. “Text Localization in Real-World Images Using Efficiently Pruned Exhaustive Search”. in Document Analysis and Recognition(ICDAR), 2011 International Conference on. 2011. p. 687-691.
[10] J. Matas, O. Chum, M. Urba and T. Pajdla,“Robust wide baseline stereo from maximally stable extremal regions,” in Proc. of British Machine Vision Conference, 2002, pp. 384-396.
[11] Dalal N, Triggs B. “Histograms of oriented gradients for human detection”. Computer Vision and Pattern Recognition,2005. CVPR 2005. IEEE Computer Society Conference on. IEEE,2005,1:886-893.