Journal of Chemical and Pharmaceutical Research, 2014, 6(12):105-113
Research Article
ISSN : 0975-7384
CODEN(USA) : JCPRC5
Structural, thermal and electrical properties of polyaniline/CrO
3composites
Asha, Sneh Lata Goyal
*, Deepika Jain and Nawal Kishore
Department of Applied Physics, Guru Jambheshwar University of Science and Technology, Hisar, Haryana, India
_____________________________________________________________________________________________
ABSTRACT
The paper describes the synthesis and characterization of polyaniline (PANI)/CrO3 composites. Samples of PANI/CrO3 composites were synthesized by chemical oxidative polymerization of aniline added with various weight % of CrO3 in the presence of ammonium persulphate as an oxidant. The samples were characterized by Fourier Transform Infrared (FTIR) Spectroscopy, Scanning Electron Microscopy (SEM), X-ray Diffraction (XRD) and their thermal and electrical properties have also been investigated. The results of FTIR and SEM techniques confirm the presence of CrO3 in the composites. The FTIR spectra show that the intensity of characteristic peak of metal oxide increases and also there exist small shifting in the frequencies of characteristic bands of PANI in the composite. In the SEM micrograph of PANI/CrO3 composites, the smaller size particles are observed as compared to PANI. It reveals that CrO3 particles are embedded in the PANI structure. From Thermo Gravimetric Analysis (TGA), it is concluded that the thermal stability of PANI is more in composite form. First, it increases with increase in CrO3 content up to 10 weight% and thereafter it starts decreasing. The DC electrical conductivity also shows similar kind of behavior. DC conductivity of PANI as well as PANI/CrO3 composites increases with increase in temperature. Due to higher value of conductivity and thermal stability as compared to PANI, these composites can act as good conducting materials at higher temperatures. The composite can also act as a promising material for high performance humidity sensors.
Keywords: Polyaniline; Fourier transform infrared spectroscopy; Scanning electron microscopy; X-ray diffraction; Thermo gravimetric analysis
_____________________________________________________________________________________________
INTRODUCTION
interest owing to their novel properties derived from the successful combination of the characteristics of parent constituents into a single material. Also there exist, unparallel advantage such as tunable mechanical properties for the diverse applications such as microwave absorption layers, solid state electrolytes, catalysts and super capacitors [16].
CrO3 has been extensively explored for the purpose of developing widespread industrial applications, owing to the
convergence of a variety of mechanical, physical and chemical properties in one single oxide material. Therefore, CrO3 is selected for preparation of composites with PANI. Till now although a number of studies on PANI and its
oxide composites have been reported and majority of researchers are still focusing on their synthesis and characterization. The survey of literature reveals that there is no report on the synthesis and characterization of PANI/CrO3 composites to the best knowledge of authors. Also the evaluation of dynamic parameters for PANI and
oxide composites using techniques such as TGA etc. is scarce.
In the present paper, the synthesis of PANI and PANI/CrO3 composites by chemical oxidative polymerization of
aniline hydrochloride with ammonium persulphate using different concentrations of CrO3 is reported. The
characterization of the samples has been performed using SEM, FTIR spectroscopy, XRD and Thermal analysis. The variation in dc conductivity of these composites has also been studied as a function of temperature and concentration.
EXPERIMENTAL SECTION
2.1. Synthesis of PANI
To prepare PANI, 0.2 M aniline hydrochloride (Aldrich) was oxidized with 0.25 M ammonium persulphate (Aldrich) in aqueous medium. Both solutions were left to cool in the refrigerator for 2-3 hours and then mixed in a beaker drop-wise, maintained at a temperature between 0-4 0C in an ice bath, stirred for 2 hours and left for 24 hours at rest to polymerize in refrigerator. Thereafter PANI precipitate was collected on a filter paper and was washed with 1M HCl and subsequently with acetone till the filtrate turned colourless. PANI (emeraldine) hydrochloride powder was dried in air and then in vacuum at 450C. PANI prepared under these conditions was taken as standard sample.
2.2. Synthesis of PANI/CrO3 Composites
The samples of PANI/CrO3 composites were prepared by adding 5, 10, 20 and 40 weight percentage of 0.1 M
Chromium Oxide (Aldrich) to 0.2 M aniline hydrochloride solution in distilled water before oxidizing with vigorous stirring for 2 hours. Following this procedure, four different PANI/CrO3 composites were prepared and named as
Cr5, Cr10, Cr20 and Cr40 respectively.
ANALYTICAL TECHNIQUES
The samples were characterized by FTIR, SEM, XRD and TGA techniques. FTIR analysis was done by using Shimadzu IR affinity-1 8000 FTIR spectrometer by mixing the powder sample with dry KBr. SEM was done using Microtrac Semtrac Mini SM-300. XRD studies of the samples were performed by using Rigaku table-top X-ray diffractometer. TGA analysis was performed by TA instrument, model no. SDT Q600 in nitrogen atmosphere with a heating rate of 100C/minute. DC conductivity measurements were also made by using Keithley 6517B electrometer.
RESULTS AND DISCUSSION
4.1. Fourier Transform Infrared Spectroscopy
Fig. 1 shows the FTIR spectra of PANI and PANI/CrO3 (wt% 40). The FTIR spectrum of PANI shows characteristic
______________________________________________________________________________
4000 3000 2000 1000 0 Cr 40
PAN I
%
T
[image:3.612.196.426.81.265.2]W avenum ber (cm
-1)
Figure 1. FTIR spectra of PANI and PANI/CrO3 composite (Cr40)
The higher frequency vibration at 1569 cm-1 has a major contribution from the quinoid rings, while the lower frequency mode at 1458 cm-1 shows the presence of benzenoid ring units [19, 20].The broad band observed between 2400-2750 cm-1 is due to aromatic C-H stretching vibrations while the band at 2950-3300 cm-1 is due to N-H stretching of aromatic amines [19, 20].
The characteristic peak at 626 cm-1 is assigned to the presence of metal oxides [21] and in the spectrum of the composite; the intensity of this peak is observed to increase. Also there exists a small shifting in frequencies of all the bands existing in PANI. Thus the results confirm the presence of CrO3 in the composite.
4.2. Scanning Electron Microscopy
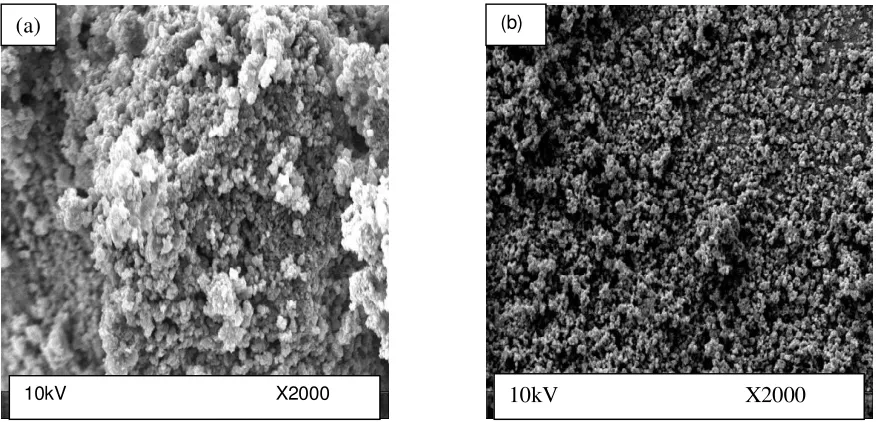
According to the SEM micrograph of pure PANI (Fig. 2(a)), relatively bigger size particles with weak bonding are observed. The structures with bigger sized particles such as that seen for the pure PANI could not be seen in the SEM micrograph of PANI/CrO3 composites (Fig. 2(b)), rather smaller particles are observed. The micrograph shows
a heterogeneous distribution of these particles suggesting a strong bonding. Thus, it was considered that the CrO3
particles are embedded within the structure built by PANI chains. It shows that it is easy to control the composite structure by using various types and shapes of metal oxides [22, 23].
[image:3.612.93.531.476.687.2]The XRD study of pure PANI, CrO3 and PANI/CrO3 composites have been investigated and published elsewhere
[24]. The XRD patterns of PANI/CrO3 composites show the presence of CrO3 in PANI.
4.4. Thermo Gravimetric Analysis
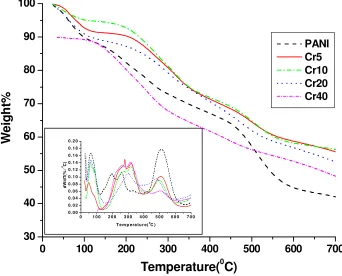
A TGA thermogram of PANI and PANI/CrO3 composites in nitrogen atmosphere is shown in Fig. 3. The TGA
analysis of PANI/CrO3 composites indicates four steps of weight loss.
1. First stage starts at about 1000C is considered as initial dehydrating stage and due to desorption of water absorbed at the surface of doped polymer [20].
2. Second stage at about 2500C is due to the removal of protonic acid component [20].
3. The subsequent stages (third at about 5000C and fourth at about 6000C) indicate breaking-up of the polymer chain which can lead to production of gases [25].
0
100
200
300
400
500
600
700
30
40
50
60
70
80
90
100
W
e
ig
h
t%
Temperature(
0C)
[image:4.612.142.484.233.509.2]PANI
Cr5
Cr10
Cr20
Cr40
Figure 3. TGA thermogram of PANI and PANI/CrO3 composites
4.4.1. Activation Energy
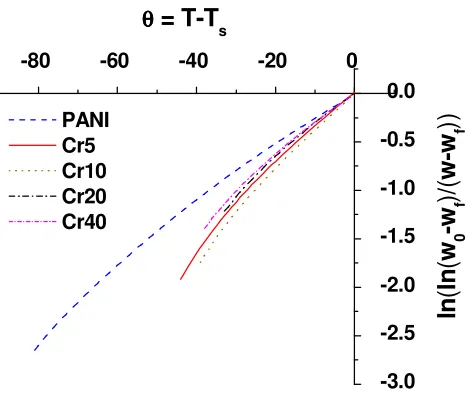
The activation energy of pure PANI and PANI/CrO3 composites has been deduced using the expression [26, 27]
ln
E
(1)
where w0 is the initial weight, w is the remaining weight at temperature T, wf is the final weight, Ea is the activation
energy, R is gas constant and θ = T-Ts with Ts as the reference temperature corresponding to
= 1/e.
From equation (1), the activation energy Ea can be calculated from the slope of the fitted straight line between
ln [ln
] and θ as illustrated in Fig. 4 (for Pure PANI and PANI/CrO3 composites). 0 1 0 0 2 0 0 3 0 0 4 0 0 5 0 0 6 0 0 7 0 0
0 .0 0 0 .0 2 0 .0 4 0 .0 6 0 .0 8 0 .1 0 0 .1 2 0 .1 4 0 .1 6 0 .1 8 0 .2 0
d
W
/d
T
(%
/
0C
)
______________________________________________________________________________
-80 -60 -40 -20 0
-3.0 -2.5 -2.0 -1.5 -1.0 -0.5 0.0
ln
(
ln
(
w
0-w
f
)
/
(
w
-w
f
))
θ
θ
θ
θ
= T-T
s
[image:5.612.196.430.80.281.2]PANI Cr5 Cr10 Cr20 Cr40
Figure 4. Plot of
ln [ln
] vs.
θ
for PANI and PANI/CrO3 compositesThe values of activation energy thus obtained have been listed in Table 1. It is clear from the table that the value of activation energy first increases with increase in CrO3 content up to 10 weight% of CrO3 and thereafter it starts
decreasing with increase in concentration of CrO3. The increase in activation energy signifies the increase in thermal
stability of the polymer while decrease in activation energy shows the decrease in thermal stability [27, 28]. The increase in activation energy may be due to increase in packing density and reorganization of molecular arrangements etc. in the polymeric sample and decrease may be due to lattice imperfections.
4.4.2. Frequency Factor
Frequency factor is a constant indicating how many collisions have the correct orientation to lead to products and is related to rate of reaction. The values of frequency factor for pure PANI and its composites with CrO3 have been
determined by substituting the values of the corresponding activation energy (Ea) in the following expression [29, 30]
exp (
)
(2)where A is the frequency factor and βis the constant rate of heating and other letters have their usual meanings. The calculated values of frequency factor are listed in Table1. It is clear from the table that the value of frequency factor, like activation energy, increases with increase in CrO3 content up to 10 weight% and thereafter it decreases. The
increase in the frequency factor shows that there is an increase in the rate of reaction and its decrease shows the reverse trend. This increase may be due to the scissoning of the polymeric chains which increases the rate of reaction as the concentration of CrO3 increases [28, 29].
4.4.3. Entropy of Activation
The entropy of activation (∆S) is the difference between the entropy of the transition state and the sum of the entropies of the reactants and is calculated using [29, 31]
Table 1. Values of various kinetic parameters for PANI and PANI / CrO3 composites
Sample Ea(KJ/mol) A (1010 ) (s-1) ∆S(J/mol/K) ∆G(KJ/mol)
PANI 136.714 0.0926 -187.568 286.393 Cr5 197.687 990.152 -56.36 238.838 Cr10 203.914 1146.94 -51.038 244.286 Cr20 171.3 344.96 -155.49 295.787 Cr40 152.3 170.665 -173.21 285.689
4.4.4. Free Energy of Change of Decomposition
Free energy of change of decomposition (∆G) is given as the difference between the enthalpy of the transition state and the sum of the enthalpies of the reactants in the ground state. It may be considered to be the driving force of a chemical reaction. ∆G determines the spontaneity of the reaction [29]. The values of ∆G are calculated using the expression [29, 31]
- .
/0 1
2(4)
The values thus calculated are listed in Table1. The positive values of ∆G in case PANI/CrO3 composites signify the
non-spontaneity of the degradation reaction [29].
4.5. DC Conductivity
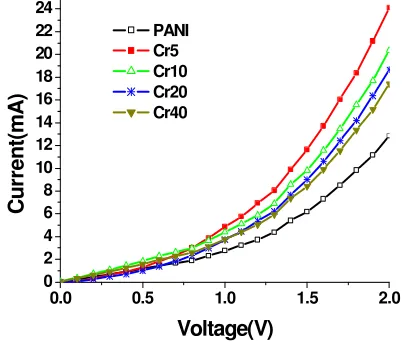
Current (I) - Voltage (V) characteristics of PANI and its various composites with CrO3 at 333K and the composite
with 20 weight % of CrO3 at various temperatures are shown in Fig. 5 & Fig. 6 respectively. The current increases
non-linearly with applied voltage and the conduction mechanism in such conducting polymers is very much different from intrinsic semiconductors [32].
In conducting polymers, the negative and positive charges initially added to the polymer chain do not simply begin to fill the rigid conduction or valence bands. In conducting polymers, there are no permanent dipoles. In fact, there exists random charge (polaron) trapping in the sample.
0.0 0.5 1.0 1.5 2.0
0 2 4 6 8 10 12 14 16 18 20 22 24
C
u
rr
e
n
t(
m
A
)
Voltage(V)
PANI Cr5 Cr10 Cr20 Cr40
Figure 5. I-V characteristics of PANI and PANI/CrO3 composites at 333K
The lattice distortions occur around the doped charge due to strong coupling between electrons and phonons under the influence of applied external field [33]. As a result of this, the charge trapping become strong and their localized motion serves as an effective electric dipole. This leads to formation of quasi particles such as polarons and bipolarons. Here the charge transport is through these polarons and bipolarons. With the increase in applied electric field, the formation of polarons and bipolarons increases contributing to the increase in current with respect to voltage, resulting in non-linear curve [33].
______________________________________________________________________________
3
75)456(5) where I is the current, L is the thickness, V is the voltage and A is the area of cross section of the sample.
0.0 0.5 1.0 1.5 2.0 0
2 4 6 8 10 12 14 16 18 20 22
C
u
rr
e
n
t(
m
A
)
Voltage(V) 313K
[image:7.612.190.440.113.289.2]333K 353K 373K 393K
Figure 6. I-V characteristics of PANI / CrO3 (20 wt %) composites at various temperatures
320 340 360 380 400 1.8
2.0 2.2 2.4 2.6 2.8 3.0 3.2 3.4 3.6 3.8 4.0 4.2 4.4 4.6
C
o
n
d
u
c
ti
v
it
y
X
1
0
-4 S
/c
m
Temperature(K)
[image:7.612.214.414.325.498.2]PANI Cr5 Cr10 Cr20 Cr40
Figure 7. Temperature dependent dc conductivity of PANI and PANI/CrO3composites
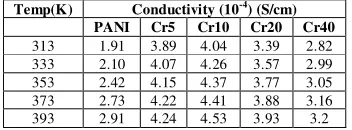
The calculated values of dc conductivity for PANI and PANI/CrO3 composites are listed in Table2. As mentioned in
the Table the dc conductivity first increases when doped with CrO3 and reaches maximum for Cr10 and thereafter it
decreases. Due to multiple doping effects [34] of Cr6+, there is an initial increase in σ with an increase in concentration of doping up to 10% CrO3 [35]. But with further increasing content of CrO3 it may lead to structural
distortion [36]as a result of unbalanced charge distribution on the chains resulting in a decrease in σ value [37].
DC conductivity of PANI as well as PANI/CrO3 composites increases with increase in temperature. This may be due
to increase in free charges with increase in temperature [17].
[image:7.612.226.402.644.709.2]described by the Mott’s variable range hopping (VRH) model, which is another possible charge transport mechanism in conducting polymers. Mott’s VRH mechanism is a phonon assisted quantum-mechanical transport phenomenon in which the movement of charge carriers to a nearby localized state of different energy is explained through the thermodynamic procedures, whereas the movement of charge carriers to a farther off localized state of similar energy is given by quantum mechanical tunneling [38].
The details worked out on this process lead to a characteristic temperature dependence of conductivity of the form ln σ (T) α T {-1 / (1+d)}, where σ is the conductivity of the sample and T is the temperature. Mott’s model for hopping is given by
3(1, 3
8exp 0
TTγ
(6)
where the pre-exponential factor σ0 is the high temperature limit of conductivity, T0 is the Mott’s characteristic
temperature associated with the degree of localization of the electronic wave function. The exponent γ = 1/ (1+d) determines the dimensionality of the conducting medium [39].
0.224 0.226 0.228 0.230 0.232 0.234 0.236 0.238 0.240 -8.6
-8.5 -8.4 -8.3 -8.2 -8.1 -8.0 -7.9 -7.8 -7.7
ln
C
o
n
d
u
c
ti
v
it
y
(S
/c
m
)
T
-1/4(
K
-1/4)
PANI Cr5 Cr10 Cr20 Cr40
Figure8. Plot of ln σ vs T -1/4 of pure PANI and PANI/CrO3 composites
The possible values of
γ
are 1/4, 1/3 and 1/2 for three, two and one-dimensional systems respectively [40]. The plot of lnσ (T) vs. T -1/4 is a straight line as shown in Fig. 8 and indicates that three dimensional (3D) charge transport occurs in all the present samples. The values of T0 and lnσ0 obtained from the slopes and intercept are obtained from [image:8.612.179.452.269.480.2]the above mentioned plots and presented in Table3.
Table 3The values of lnσ0 and T0
Sample ln ó0 (S/cm) T0 (103) K
PANI -0.6052 1255.45 Cr5 -6.3535 1.349 Cr10 -5.8027 4.534 Cr20 -5.1994 16.650 Cr40 -5.8985 7.344
CONCLUSION
PANI and PANI/CrO3 composites are synthesized by oxidative polymerization of aniline hydrochloride in presence
of different weight% of CrO3 and ammonium persulphate as an oxidant. In FTIR spectra of PANI/CrO3 composites
there exists small shifting in frequencies of bands as compared to that of PANI. Also, the peak of CrO3 is prominent
in case of composite, thereby, confirming the presence of CrO3 in the composites. The SEM study shows a
______________________________________________________________________________
thermal stability and a high value of dc conductivity as compared to that of PANI. In case of PANI/CrO3
composites, the dc conductivity and thermal stability are maximum for 10 weight% of CrO3 and then they start
decreasing with further increase in concentration of CrO3. DC conductivity of PANI as well as PANI/CrO3
composites increases with increase in temperature. Due to higher value of conductivity and thermal stability as compared to PANI, these composites can act as good conducting materials at higher temperatures. The composite can also act as a promising material for high performance humidity sensors.
Acknowledgements
Authors are thankful to University Grant Commission, New Delhi for major research project and Department of Science and Technology, New Delhi for FIST (Fund for Improvement of Science and Technology Infrastructure).
REFERENCES
[1] WMAT Bandara; DMM Krishantha; JSHQ Perera; RMG Rajapakse; DTB Tennakoon, J. Compos. Mater.,
2005, 39, 759-775.
[2] P Aranda; M Darder; RF Saavedra; ML Blanco; ER Hitzky, Thin Solid Films, 2006, 495, 104-112.
[3] SL Patil; SG Pawar; MA Chougule; BT Raut; PS Godse; S Sen; VB Patil, Int. J. Polym. Mater., 2012, 61, 809– 820.
[4] MJ Morita, Polym. Sci. Part B: Polym. Phys., 1994, 32, 231-242.
[5] FW Zeng; XX Liu; D Diamond; KT Lau, Sens. Actuators: Part B, 2010, 143, 530-534. [6] AJ Heeger, Rev. Mod. Phys., 2001, 73, 681-718.
[7] S Manjunath; KR Anilkumar; M Revanasiddappa; MVN Ambika Prasad, Ferroelect. Let., 2008, 35, 36-46. [8] S Manjunath; KR Anilkumar; MVN Ambika Prasad, Ferroelectrics, 2008, 366, 22-28.
[9] SD Patil; SC Raghavendra; M Revansiddappa; P Narsimha; MVN Ambika Prasad, Bull. Mater. Sci., 2007, 30, 89-92.
[10] J Alam; U Riaz; SJ Ahmad, Magn. Mater., 2007, 314, 93-99. [11] M Saeed; A Shakoor; E Ahmad, J. mater. Sci., 2013, 24, 3536-3540. [12] E Kumar; P Selvarajan; D Muthuraj, J. Mater. Sci., 2012, 47, 7148–7156.
[13] DM Jundale; ST Navale; GD Khuspe; DS Dalavi; PS Patil; VB Patil, J. Mater. Sci., 2013, 24, 3526–3535. [14] KC Sajjan; AS Roy; A Parveen; S Khasim, J. Mater. Sci., 2014, 25, 1237-1243.
[15] S Ameen; MS Akhtar; YS Kim; OB Yang; HS Shin, Colloid. Polym. Sci., 2011, 289, 415–421. [16] MA Chougule; S Sen; VB Patil, Synth. Met., 2012, 162, 1598–1603.
[17] SA Chen; KR Chuang; CI Chao; HT Lee, Synth. Met., 1996, 82, 207-210. [18] Asha; SL Goyal; N Kishore, J. Int. Sci. Tech., 2013, 1, 25-27.
[19] Asha; SL Goyal; D Kumar; S Kumar; N Kishore, Ind. J. of Pure & Appl. Phys., 2014, 52, 341-347. [20] R Ganesan; A Gedanken, Nanotechnology, 2008, 19, 435709-435713.
[21] R Sharma; R Malik; S Lamba; S Annapoorni, Bull. Mater. Sci., 2008, 31, 409-413.
[22] E Ozkazanc; S Zorb; H Ozkazanc, J. of Macromol. Sci. Part B: Phys., 2012, 51, 2122-2132.
[23] MR Nabid; M Golbabaee; A Bayandori; MR Dinarvand; R Sedghi, Int. J. Electrochem.Sci., 2008, 3, 1117-1126.
[24] Asha; SL Goyal; N Kishore, AIP Conf. Proceeding, 2013, 1536, 617-618.
[25] I Dumitrescu; CA Nicolae; AM Mocioiu; RA Gabor; M Grigorescu; M Mihailescu, UPB Sci. Bull., 2009, 71, 63-72.
[26] HH Horowitz; G Metzger, Anal. Chem., 1963, 35, 1464-1468.
[27] R Gupta; V Kumar; PK Goyal; S Kumar; SL Goyal, Adv. Appl. Sci. Res., 2012, 3, 2766-2773. [28] PC Kalsi; KDS Mudher; AK Pandey; RH Iyer, Thermochimica Acta, 1995, 254, 331-336.
[29] R Gupta; V Kumar; PK Goyal; S Kumar; PC Kalsi; SL Goyal, Adv. Appl.Sci. Res., 2011, 2, 248-254. [30] EV Anslyn; DA Dougherty, ModPhysical Org Chem. Edwards Brothers, Inc USA, 2006.
[31] KG Mallikarjun, E-Journal of Chem., 2004, 1, 105-109.
[32] M Reghu; Y Cao; D Moses; AJ Heeger, Phys. Rev. Part B, 1993, 47, 1758-1764.