Journal of Chemical and Pharmaceutical Research, 2014, 6(7):200-207
Research Article
CODEN(USA) : JCPRC5
ISSN : 0975-7384
The similarity/dissimilarity analysis of protein sequence based on
nucleotide triplet codon
1
Keru Hua,
1Qin Yu,
1Jie Tang,
1Ruiming Zhang,
2Zhiyong Zhang and
1*Xiaoli Xie
1
College of Science, Northwest A&F University, Yangling, Shaanxi, P.R. China
2
College of Information Engineering, Northwest A&F University, Yangling, Shaanxi, P.R. China
_____________________________________________________________________________________________
ABSTRACT
Based on nucleotide triplet codon, a graphical representation of protein sequences is outlined. A numerical characterization including the location, number and distribution information of all the 20 kinds of amino acids is proposed. The similarity/dissimilarity analysis of ND5 protein sequences of nine species is done, and our approach is compared to other approaches recently proposed based on the coefficient of correlation of the results of these approaches with the results calculated by ClustalW. It shows that our approach has better correlations with ClustalW for all nine species than other approaches, which gives an intuition of better performance.
Keywords: Protein sequence; Similarity/dissimilarity analysis; Graphical representation; Numerical characterization.
_____________________________________________________________________________________________
INTRODUCTION
It is well known that scientists are anxious to know the similarity/dissimilarity of biological sequences because it is closely correlated with the structures and functions of the sequences as well as their roles in biological process, and hence the similarity/dissimilarity property is very important to both basic research and drug target development. However, many newly found protein sequences do not have significant sequence alignment similarity to the attributes-known proteins [1], and the alignment becomes misleading due to gene rearrangements, inversion, transposition and translocation at substring level, unequal length of sequences [2]. So the alignment-free methods would be the feasible approaches to identify their attributes and compare biological sequences. Recently, many alignment-free methods have been proposed, but they are still in the early stage compared with alignment-based method. The alignment-free methods of protein mainly include the following classes:
(1) The graphical approaches can provide insights to analyze complicated sequences. They were applied into many important biological researches, for example, protein-protein interactions [3-5], the similarity/dissimilarity analysis of biological sequence [6-15], enzyme-catalysed reactions [16-18], analysis of codon usage [19-21], and drug metabolism system [22]. Actually, the graphic representations are distinguished from each other on their properties, for instance, chemical properties [23].
(3) Statistical method is used to compare biological sequences. According to k-word frequency of biological sequences, many researchers have proposed many different numeric characterizations and distance formulas as similarity/dissimilarity measures [25-28].
(4) They also extract feature vectors from biological sequences [29] and introducing some special technology.
In this work, we present a graphical representation of protein sequences based on a new kind of numerical characterization of DNA sequence [10], and a numerical characterization of protein sequences is given. We also apply our method to the ND5 (NADH dehydrogenase subunit) protein sequences of 9 species and compare our alignment-free method to other approaches. To present to our work, this paper is organized as follows: In the section 2, we will give a detail description on the method we propose. In detail, subsection 2.1 illustrates the process of constructing the 3D curve for protein sequences. The subsection 2.2 is dedicated to present how to obtain the numeric characterization of protein sequences, and subsection 2.3 deals with the analysis of the similarities and dissimilarities of protein sequences based on the numeric characterization introduced in the last section. Subsection 2.4 a comparative study will be conducted. Section 3 covers the experimental of our research on the ND5 sequences of nine species. At last, the main results and discussion will be extracted and shown in the last discussion section.
METHOD
2.1 Construction of a 3D curve for protein sequence
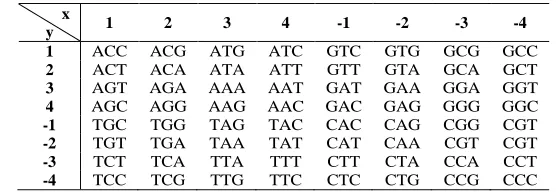
[image:2.595.164.442.421.518.2]As we know, there are 64 kinds of nucleotide triplet codons based on four bases T, C, A and G in mRNA and DNA sequence ,which can be translated into 20 kinds of amino acids. It is well know that the situation that several distinct codons corresponding to one amino acid could happen. Nafiseh [10] distributed each kind of 64 nucleotide triplet codons in Cartesian 2D coordinates as shown in Table1. Based on this design, we can consequently obtain a kind of numeric representations of all the 20 kinds of amino acids by taking the average of the coordinates of the different codons which correspond to the same amino acid as the final coordinate of this amino acid based on the coordinates of 64 codons. For instance, TTT (4, -3) and TTC (4, -4) both correspond to Phenylalanine ( F ) and the 2D coordinate of F is defined to be (4, -3.5). Likewise, the other 2D coordinates of 19 amino acids can be obtained as listed in Table2.
Table 1 Sixty-four kinds of codons distributed in Cartesian 2D x
y 1 2 3 4 -1 -2 -3 -4
1 ACC ACG ATG ATC GTC GTG GCG GCC
2 ACT ACA ATA ATT GTT GTA GCA GCT
3 AGT AGA AAA AAT GAT GAA GGA GGT
4 AGC AGG AAG AAC GAC GAG GGG GGC
-1 TGC TGG TAG TAC CAC CAG CGG CGT
-2 TGT TGA TAA TAT CAT CAA CGT CGT
-3 TCT TCA TTA TTT CTT CTA CCA CCT
-4 TCC TCG TTG TTC CTC CTG CCG CCC
We use the following notations:
a
AA
denotes the amino acid with namea
(
x y i
a,
a, )
denotes the Cartesian 3D coordinate ofAA
a, wherei
is the location ofAA
a in a particular protein sequence.N
adenotes the number ofAA
a.N
denotes the total number of the amino acids contained in the protein sequence of interest.j
a
______________________________________________________________________________
Table 2. Values of corresponding parameters of 20 amino acids Amino acids x-coordinate y-coordinate
F 4 -3.5
L 0 -3.67
S 1.33 -1.17
Y 4 -1.5
W 2 -1
C 1 -1.5
N 4 3.5
P -3.5 -3.5
H -1 -1.5
Q -2 -1.5
R -1.67 0.17
I 3.67 1.67
T 1.5 1.5
K 3 3.5
M 3 1
V -1.5 1.5
A -3.5 1.5
D -1 3.5
E -2 3.5
G -3.5 3.5
Based on the aforementioned analysis, the graphic representation of protein sequences could be constructed directly,
and an arbitrary protein sequence can be converted into an unique curve containing no loops based on
(
x
a, y ,
ai
)
,which avoids the loss of information due to overlapping by introducing the location . For example, sequence
S
=
WTFESRNDPAK
can be represented by vector(
) (
) (
) (
) (
)
(
) (
) (
) (
) (
) (
)
{ 2, 1, 1 , 1.5, 1.5, 2 , 4, 3.5, 3 ,
2, 3.5, 4 , 1.33, 1.17, 5 ,
1.67, 0.17, 6 , 4, 3.5, 7 ,
1, 3.5, 8 ,
3.5, 3.5, 9 ,
3.5, 1.5, 10 , 3, 3.5, 11 }
S
=
−
−
−
−
−
−
−
−
−
(2.1)According to
S
, we can get 3D Curve ofS
(Fig. 1).Fig.1 3D curve of S=WTFESRNDPAK
2.2Numeric characterization of protein sequences
Now, we are constructing two vectors derived from the curve constructed above to facilitate quantitative comparisons of similarities/dissimilarities analysis of protein sequences. We can get the mean Euclidean distance of
[image:3.595.157.452.442.620.2]1
a j
N a j a
a
D
D
N
=
=
∑
, whenN
a=
0
, thenD
a=
0
. (2.2)Consequently, we could obtain a numeric characterization vector containing all
D
aof all the 20 kinds of amino acids of the protein sequence of interest:}
{
D , D , D , D , D , D , D , D , D , D , D , D , D , D , D , D , D , D , D , D
A C D E F G H I K L M N P Q R S T V W Y.
DV
=
(2.3)Here we choose the mean Euclidean distance between
AA
a and original point(
0, 0, 0
)
rather than the first amino acid, abstaining from overweighting the first vertex (amino acid) and subsequently poisoning the following analysisand lead to bad results consequently. This distance is a kind of absolute Euclidean distance of
AA
a which can override the drawback brought by adopting the first amino acid.If we Let
p
n be the frequency ofAA
a in the protein sequence of interest, then we can get an another numeric characterization vector of this sequencePV
, which takesp
aa
N
N
=
(2.4) As its components, wherea
iterate all over the 20 kinds of amino acids:}
{
p , p , p , p , p , p , p , p , p , p , p , p , p , p , p , p , p , p , p , p
A C D E F G H I K L M N P Q R S T V W YPV
=
(2.5)Derived from Eqs. (2.3) and (2.5), we get a 40 dimension vector:
{
}
{dv; PV}
, d , d , d , d , d , d , d , d , d , d , d , d , d , d , d , d , d , d , d ;
p , p , p , p , p , p , p , p , p , p , p , p , p , p , p , p , p , p , p , p
A C D E F G H I K L M N P Q R S T V W Y
A C D E F G H I K L M N P Q R S T V W Y
DP
d
=
=
(2.6)
where
dv
is obtained by normalizingDV
, i.e.,{
A, d , d , d , d , d , d , d , d , d , d , d , d , d , d , d , d , d , d , d }
(DV)
C D E F G H I K L M N P Q R S T V W YDV
dv
Max
d
=
=
(2.7)
Through
DP
we grasp certain degree information of the location, number and distribution of 20 amino acids by including the mean Euclidean distance and distribution attribute. From the mathematical perspective, a protein sequence is a repeatable permutations and distribution of all the 20 kinds of amino acids, which contains information of category, location and quantity of every kind of the 20 amino acids, which is the reason why we can distinguish the sequences of different species. It is obvious that the more information our numeric characterization captures the more precise results and the more objective consequence we can get. Based on this point, we are confident to regardDP
as an appropriate numeric characterization of protein sequences.2.3Similarities/dissimilarities analysis
In this section, we are about to consider similarities and dissimilarities among protein sequences based on graphic presentation constructed in section 2.2. According to the above definitions, i.e., Eqs. (2.3) and (2.5), two DP characterization representations X and Y of two different sequences can be used to identify two given protein
______________________________________________________________________________
vectors. Euclidean distance, and angle distance are chosen in the current paper to define the similarity and dissimilarity, which we can obtain by the formulas below:
40 2
1
( , )
(
i i) ;
i
D X Y
x
y
=
=
∑
−
(2.8)40
1
40 2 40 2
1 1
,
i i ii i
i i
x y
arc X Y
x
y
=
= =
=
∑
∑
∑
(2.9)It is supposed that
D X Y
( , )
andarc X Y
,
are smaller, the protein sequencesS
1 andS
2 are more similar.2.4 Evaluation method
Firstly, we give a concept of similarity vector here:
{
}
( )
1
,
2,
,
,
p
a n
SV
=
s s
L
s
(2.10)where
s
i is the similarity(distance), getting by approacha
, between speciesp
(protein sequence) and the othern
species. For example,{
}
1
( )
0.2230, 0.2373, 0.1918, 0.3154, 0.3164, 0.4357, 0.3564, 0.4635
Human a
SV
=
(2.11)is the similarity vector of Human to other species based on approach
a
1.As a measure of the consistency, the Pearson's coefficient of correlation between the similarity vectors of different approaches and the ClustalW (Table 6) of the same species is adopted as the criteria of the quality of approach.
1 1
1 2
1 1
1 2
(1) (1)
1 2 ( ) ( ) ( ) ( )
(
,
)
(
,
)
p p a a p p a a p p a a SV SVCov SV
SV
r SV
SV
σ
σ
=
(2.12)where the 1 1
1 2
( ) ( )
(
ap,
ap)
Cov SV
SV
is the covariance between 1 1(p)
a
SV
, and 12
(p)
a
SV
, and (1)1
p a
SV
σ
standard variance of1 1
(p)
a
SV
, and so as the (1)2
p a
SV
σ
. Apparently, the largerr
you get, the higher quality of the approacha
1 is.EXPERIMENTAL SECTION
3.1Material
Protein sequences are downloaded from http://www.ncbi.nlm.nih.gov/. The nine ND5 proteins are: Human (Homo sapiens, ADB78261.1), Gorilla (Gorilla, NP_008222.1), Pygmy Chimpanzee(NP_008209.1), Common Chimpanzee (NP_008196.1), Fin Whale (NP_006899.1), Blue Whale (NP_007066.1), Rat (AP_004902.1), Mouse (NP_904338.1), and Opossum (NP_007105.1).
3.2The 3D curve of the nine species
In Fig. 2, we built new 3D curves of ND5 protein sequences of nine species. Observing the figure, it is evident that Human and Gorilla, Pygmy Chimpanzee and Common are more similar to each other than to others, so are Fin Whale and Blue Whale, Rat and Mouse.
3.3The similarity/dissimlarity analysis of the nine species
The similarity/dissimilarity matrices in sense of two distance metrics of nine ND5 proteins based on
DP
Table 3. The similarity/dissimilarity matrix for the nine ND5 proteins based on Euclidean distance between the DP vectors Gorilla P.chim C.chim F.whale B.whale Rat Mouse Opossum
Human 0.2230 0.2373 0.1918 0.3154 0.3164 0.4357 0.3564 0.4635
Gorilla 0.2652 0.1763 0.3172 0.3718 0.5052 0.4338 0.4438
P.chim 0.1427 0.3965 0.4456 0.4508 0.383 0.3814
C.chim 0.3571 0.3934 0.4464 0.3869 0.3743
F.whale 0.1931 0.4225 0.3732 0.4929
B.whale 0.4383 0.3644 0.5241
Rat 0.3593 0.5328
Mouse 0.488
______________________________________________________________________________
Table 4. The similarity/dissimilarity matrix for the nine ND5 proteins based on Angle distance between the DP vectors Gorilla P.chim C.chim F.whale B.whale Rat Mouse Opossum
Human 0.0591 0.0629 0.0507 0.0831 0.0837 0.1133 0.0942 0.1197
Gorilla 0.0704 0.0466 0.0837 0.0984 0.1329 0.1152 0.1145
P.chim 0.0376 0.1051 0.118 0.1177 0.1015 0.0965
C.chim 0.0953 0.1041 0.118 0.1033 0.0966
F.whale 0.0486 0.1133 0.1004 0.1321
B.whale 0.1129 0.0957 0.1357
Rat 0.0959 0.1461
Mouse 0.1307
The two distance matrices consistently show that Human, Gorilla, Pygmy Chimpanzee and Common are close, so are Fin Whale and Blue Whale, Rat and Mouse, which also consistent to the 3D curve which is more intuitive but less precise.
RESULTS AND DISCUSSION
The coefficients of correlation between the results of Refs. [24, 25, 26, 27] and the distance matrices in Table 5 calculated by ClustalW are illustrated in Table 6 to compare with our approach shown in first two columns. These two coefficients of correlation tables tell that our approach, either Euclidean distance or the angle distance, performs
[image:7.595.144.470.344.432.2]better consistent with ClustalW based on alignment approach than other approaches of Refs.
[
24, 25, 26, 27 .
]
†Table 5. The distances for the ND5 protein sequences of nine species based on ClustalW Gorilla P.chim C.chim F.whale B.whale Rat Mouse Opossum Human 10.7 7.1 6.9 41.0 41.3 50.2 48.9 50.4
Gorilla 9.7 9.9 42.7 42.4 52.4 49.9 54.0
P.chim 5.1 40.1 40.1 50.2 48.9 50.1
C.chim 40.4 40.4 50.8 49.6 51.4
F.whale 3.50 45.3 46.8 52.7
B.whale 45.0 45.9 52.7
Rat 25.9 54.0
Mouse 50.8
Table 6 The coefficients of correlation for the nine ND5 proteins of our approach(Table 3, 4) and the approaches in Refs. [24,25,26,27] compared with ClustalW results
Table 2 & C.W
Ref.[24](T3) & C.W
Ref.[24](T4) & C.W
Ref.[25](T3) & C.W
Ref.[25](T4) & C.W
Ref.[26](T3) & C.W
Ref.[26](T4) & C.W
Ref.[27](T3) & C.W
Human 0.9113 0.8849 0.9236 0.9143 0.4566 0.9306 0.7177 0.9059
Gorilla 0.9199 0.7398 0.9317 0.6969 0.785 0.9293 0.7748 0.88
P. chim 0.9092 0.8889 0.9541 0.9222 0.7861 0.8403 0.7661 0.6823
C. chim 0.971 0.892 0.9607 0.9257 0.7676 0.9344 0.7845 0.8819
F. whale 0.8666 0.6839 0.7388 0.6026 0.2839 0.3508 0.5318 0.3287
B. whale 0.8541 0.7296 0.8148 0.6981 −0.0730 0.6486 0.5512 0.3381
Rat 0.8412 0.8085 0.5882 0.7167 0.3693 0.4453 0.8376 0.6696
Mouse 0.4288 0.7612 0.5221 0.6711 0.4881 0.4192 0.4559 0.5914
Opossum 0.5259 −0.4344 −0.2992 −0.4746 −0.2044 −0.2975 −0.4326 −0.1342
† In the Table 6, Ref.[24](T3)&C.W denotes the coefficients of correlation of the table 3 of the reference [24] and the results of ClustalW(C.W). The others are the same.
CONCLUSION
[image:7.595.21.586.466.570.2]At last, this approach is compared with other alignment-free methods recently published, and the results showed that our approach has a better consistent with the consequence of the ClustalW. What’s more, our method is more simple, convenient, and fast.
Acknowledgements
This work is supported by Fundamental research funds for the Central Universities (No. Z109021306) and Doctoral Fund of Northwest A&F University ( No. Z109021413).
REFERENCES
[1]K. Chou and H. Shen, Anal. Biochem, 2007, 370, 1–16.
[2]H.H. Otu and K. Sayood, Bioinformatics, 2003, 2122–2130.
[3]K. Chou, W. Lin and X. Xiao, Natural Science, 2011, 3, 862-86.
[4]K. Chou, Z. Wu and X. Xiao, PLoS One, 2011, 6, e18258.
[5]G. Zhou, Journal of Theoretical Biology, 2011, 284, 142-148.
[6]Y. Huang and T.Wang, International Journal of Quantum Chemistry, 2012, 112, 1746-1757.
[7]B. Liao, X. Shan, W. Zhu and R. Li, Chemical physics letters, 2006, 422, 282-288. [8]M. Randić, Chemical physics letters, 2004, 386, 468-471.
[9]C. Zhang, R. Zhang and Hong-Yu Ou, Bioinformatics, 2003, 19,593-599.
[10]N. Jafarzadeh and A. Iranmanesh, Mathematical biosciences, 2012.
[11]B. Blaisdell, A measure of the similarity of sets of sequences not requiring sequence alignment, in:
Proceedings of the National Academy of Sciences of the United States of America, 1986, 83, 5155–5159
[12]P. He, et al, Journal of Theoretical Biology, 2012, 304, 81-87.
[13]X. Xie, et al, Journal of Zhejiang University SCIENCE B, 2012, 13, 152-158.
[14]Y. Zhang, Chemical Physics Letters, 2010, 497, 223-228.
[15]Y. Yang, et al, Combinatorial chemistry & high throughput screening, 2013. [16]J. Andraos, Canadian Journal of Chemistry, 2008, 86, 342-357.
[17]K. Chou, European Journal of Biochemistry, 1980, 113, 195-198.
[18]K. Chou, Journal of Biological Chemistry, 1989, 264, 12074-12079.
[19]K. Chou and C. Zhang, AIDS research and human retroviruses, 1992, 8, 1967-1976.
[20]X. Qi, J. Wen and Z. Qi, Journal of theoretical biology, 2007, 249, 681-690. [21]C. Zhang and K. Chou, Journal of molecular biology, 1994, 238, 1-8.
[22]K. Chou, Current Drug Metabolism, 2010, 11, 369-378.
[23]Y. Liu and Y. Peng, Journal of Computational and Theoretical Nanoscience, 2013, 10, 2102-2105.
[24]Y.H. Yao, et al, Proteins: Structure, Function, and Bioinformatics, 2008, 73, 864-871.
[25]J. Wen and Y. Zhang, Chemical Physics Letters, 2009, 476, 281-286.
[26]M. Maatyet, et al, Physica A: Statistical Mechanics and Its Applications, 2010, 389, 4668-4676. [27]Z Wu, X. Xiao and K. Chou, Journal of theoretical biology, 2010, 267, 29-34.
[28]P. He, et al, MATCH, 2011, 65, 445-458.
[29]L. Zhang, X. Zhao and L. Kong, Biochimie, 2013.
[30]M. Gupta, R. Niyogi and M. Misra, An alignment-free method to find similarity among protein sequences
via the general form of Chou’s pseudo amino acid composition, SAR and QSAR in environmental research
ahead-of-print, 2013, 1-13.
[31]B. Liao, et al, A new graphical coding of DNA sequence and its similarity calculation, Physica A: